| Param | Original file | Final file |
|---|---|---|
| Filename | modeM0/AS1T01_164T01_9000001140_08239cztM0_level2.evt | modeM0/AS1T01_164T01_9000001140_08239cztM0_level2_quad_clean.evt |
| Size (bytes) | 498,231,360 | 86,757,120 |
| Size | 475.2 MB | 82.7 MB |
| Events in quadrant A | 3,582,229 | 533,375 |
| Events in quadrant B | 3,773,291 | 540,495 |
| Events in quadrant C | 3,376,258 | 534,793 |
| Events in quadrant D | 3,860,400 | 509,504 |
| Mode M0 | |||
|---|---|---|---|
| Quadrant | BADHDUFLAG | Total packets | Discarded packets |
| A | 0 | 15532 | 3 |
| B | 0 | 16014 | 2 |
| C | 0 | 15034 | 2 |
| D | 0 | 16628 | 2 |
| Mode SS | |||
|---|---|---|---|
| Quadrant | BADHDUFLAG | Total packets | Discarded packets |
| A | 0 | 150 | 0 |
| B | 0 | 150 | 0 |
| C | 0 | 150 | 0 |
| D | 0 | 150 | 0 |
| Mode M9 | |||
|---|---|---|---|
| Quadrant | BADHDUFLAG | Total packets | Discarded packets |
| A | 0 | 13 | 0 |
| B | 0 | 13 | 0 |
| C | 0 | 13 | 0 |
| D | 0 | 13 | 0 |
| Quadrant | Total seconds | Saturated seconds | Saturation percentage |
|---|---|---|---|
| A | 7312 | 159 | 2.174508% |
| B | 7312 | 148 | 2.024070% |
| C | 7312 | 36 | 0.492341% |
| D | 7312 | 90 | 1.230853% |
Noise dominated data is calculated using 1-second bins in cleaned event files. If a bin has >2000 counts, and if more than 50% of those come from <1% of pixels, then it is considered to be noise-dominated and hence unusable.
| Quadrant | # 1 sec bins | Bins with >0 counts | Bins with >2000 counts | High rate bins dominated by noise | Noise dominated (total time) | Noise dominated (detector-on time) | Marked lightcurve |
|---|---|---|---|---|---|---|---|
| A | 8577 | 7314 | 44 | 44 | 0.51% | 0.60% | 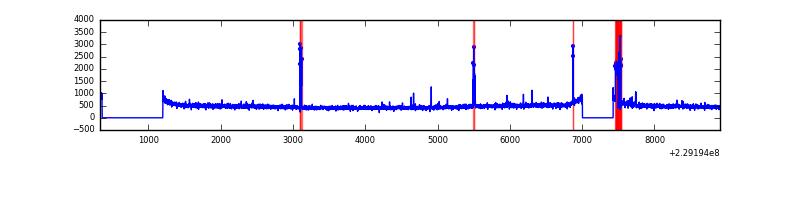 |
| B | 8577 | 7314 | 12 | 12 | 0.14% | 0.16% | 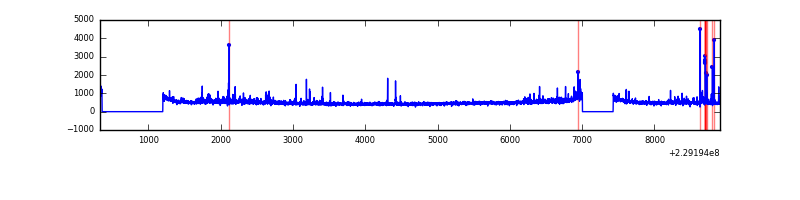 |
| C | 8577 | 7314 | 2 | 2 | 0.02% | 0.03% | 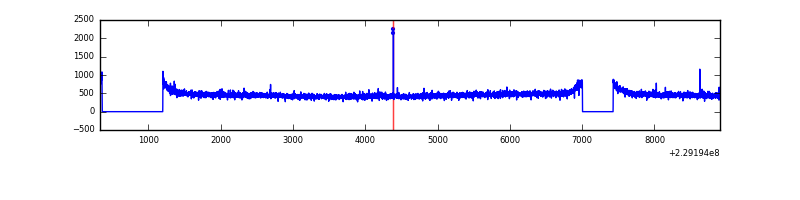 |
| D | 8577 | 7314 | 48 | 48 | 0.56% | 0.66% | 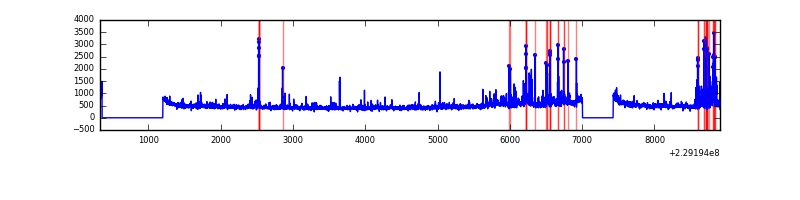 |
Top three noisy pixels from each quadrant. If the there are fewer than three noisy pixels in the level2.evt file, extra rows are filled as -1
| Pixel properties | Quadrant properties | ||||||
|---|---|---|---|---|---|---|---|
| Quadrant | DetID | PixID | Counts | Sigma | Mean | Median | Sigma |
| A | 15 | 234 | 150593 | 836.57 | 879 | 858 | 179.0 |
| A | 13 | 248 | 30506 | 165.64 | 879 | 858 | 179.0 |
| A | 5 | 16 | 9615 | 48.93 | 879 | 858 | 179.0 |
| B | 10 | 16 | 89891 | 522.65 | 890 | 868 | 170.3 |
| B | 11 | 51 | 76434 | 443.65 | 890 | 868 | 170.3 |
| B | 0 | 214 | 58772 | 339.95 | 890 | 868 | 170.3 |
| C | 12 | 4 | 8134 | 36.01 | 862 | 868 | 201.8 |
| C | 13 | 61 | 6461 | 27.72 | 862 | 868 | 201.8 |
| C | 3 | 233 | 6378 | 27.31 | 862 | 868 | 201.8 |
| D | 1 | 52 | 324010 | 1532.81 | 860 | 836 | 210.8 |
| D | 8 | 230 | 133102 | 627.33 | 860 | 836 | 210.8 |
| D | 13 | 105 | 97168 | 456.9 | 860 | 836 | 210.8 |
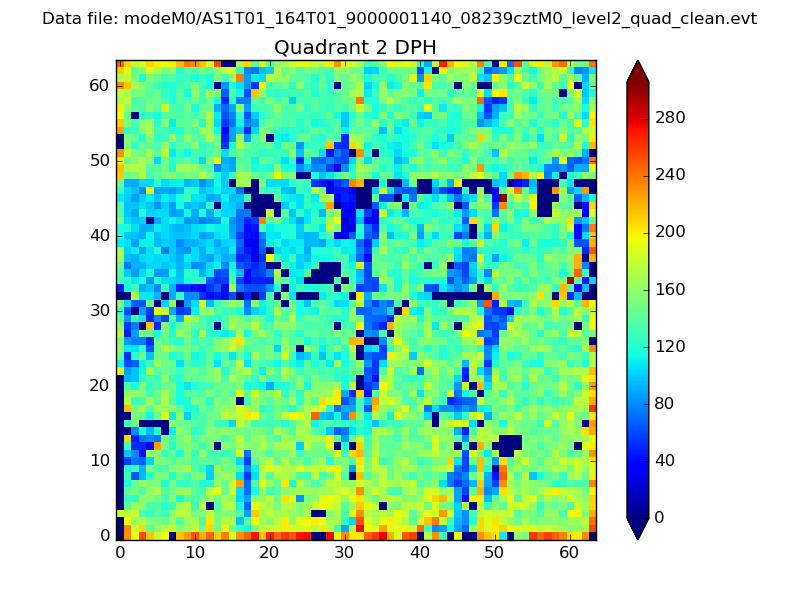
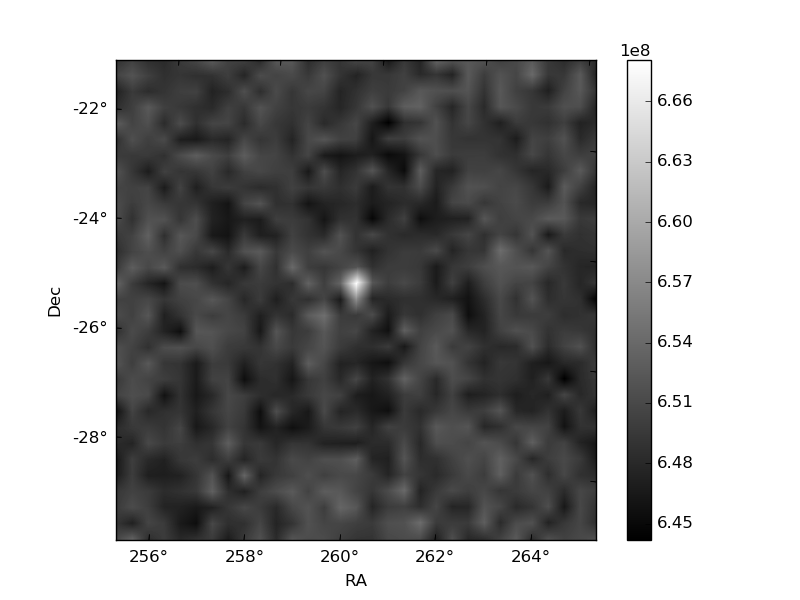
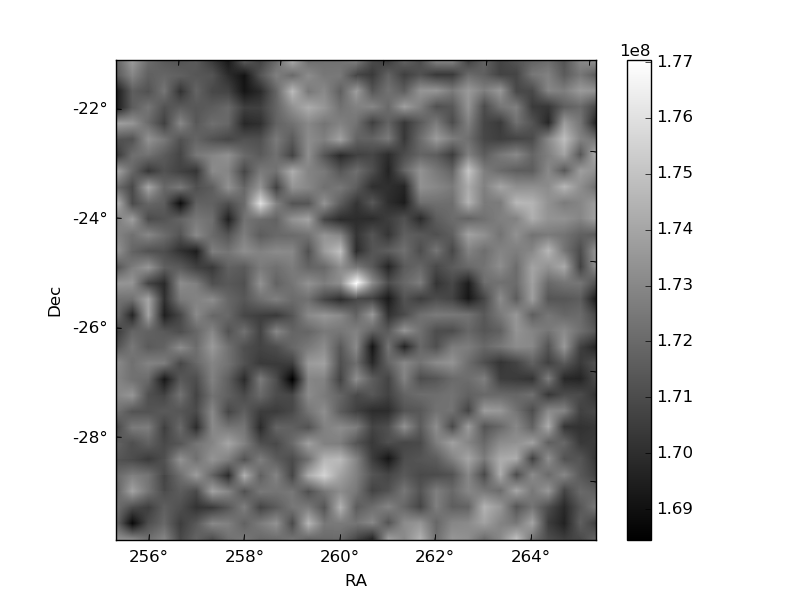
Histogram calculated using DETX and DETY for each event in the final _common_clean file
| Quadrant A | 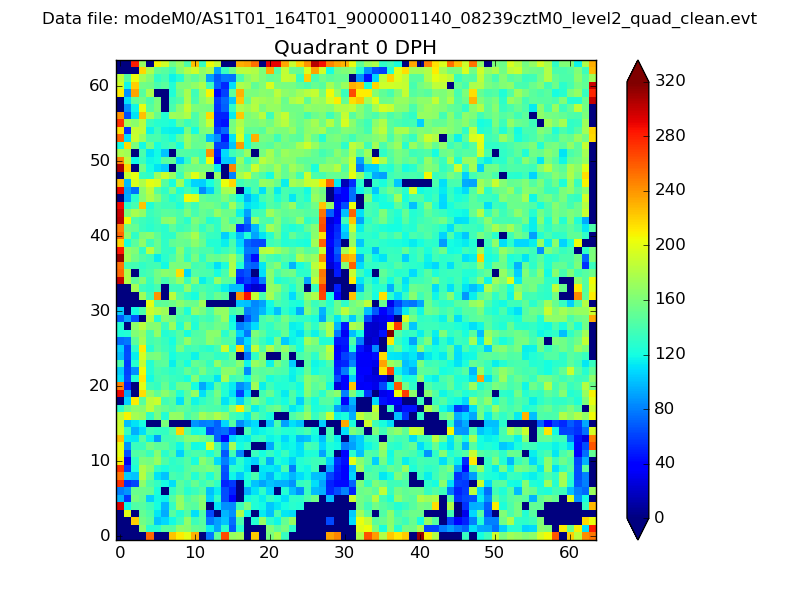 |
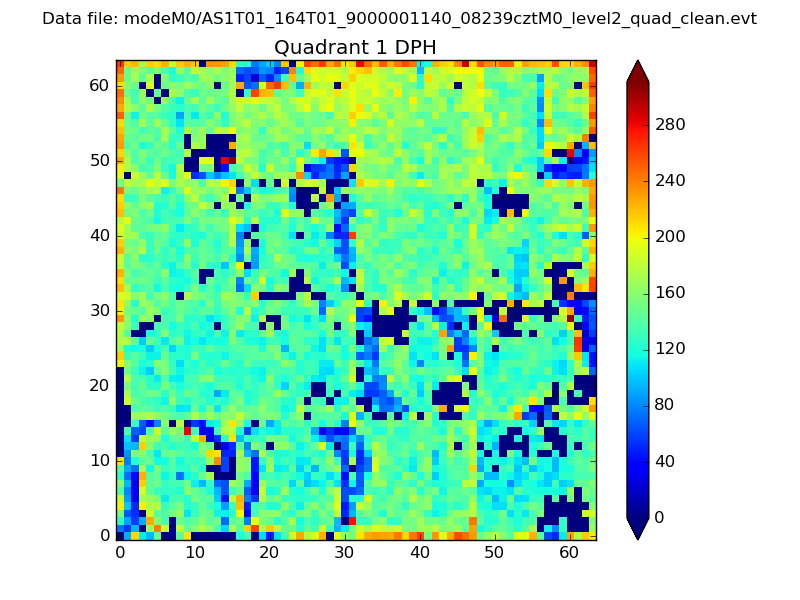 |
Quadrant B |
|---|---|---|---|
| Quadrant D | 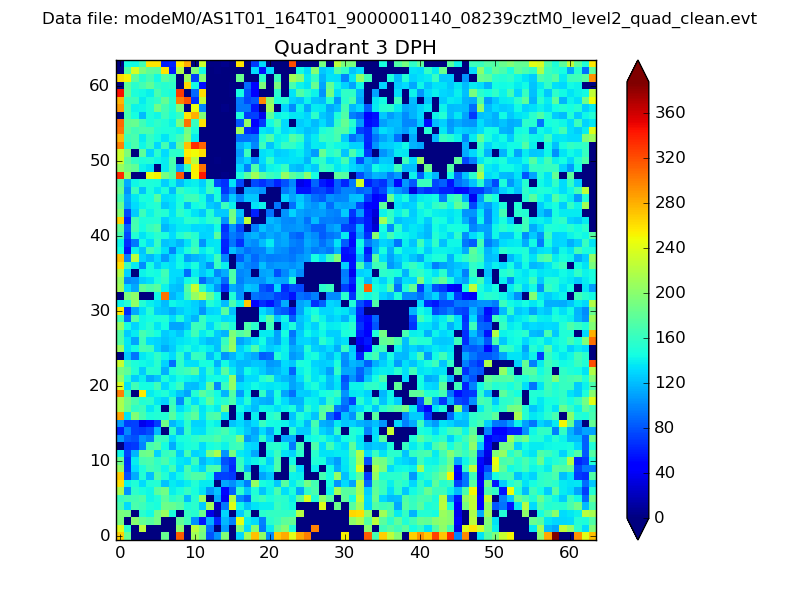 |
 |
Quadrant C |
| Plot type | Count rate plots | Images |
|---|---|---|
| Comparison with Poisson distribution Blue bars denote a histogram of data divided into 1 sec bins. Red curve is a Poisson curve with rate = median count rate of data. |
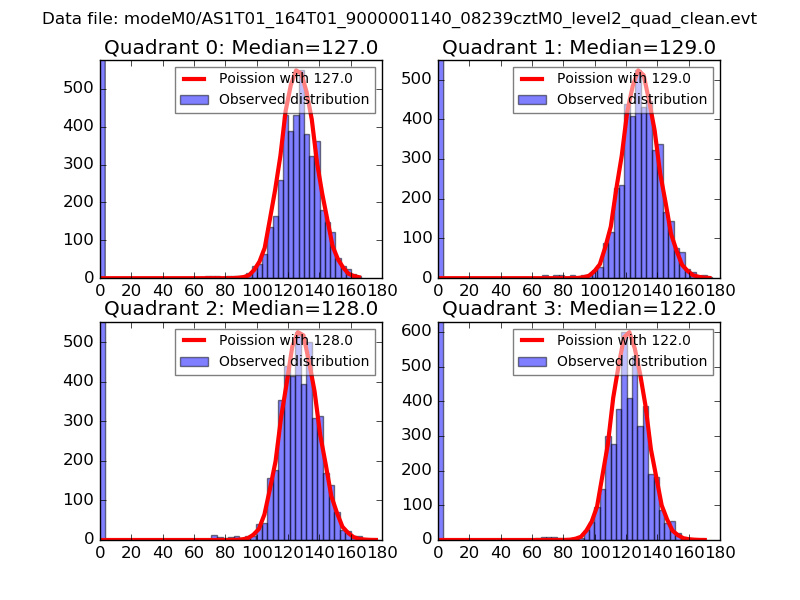 |
 |
| Quadrant-wise count rates Data is divided into 100 sec bins |
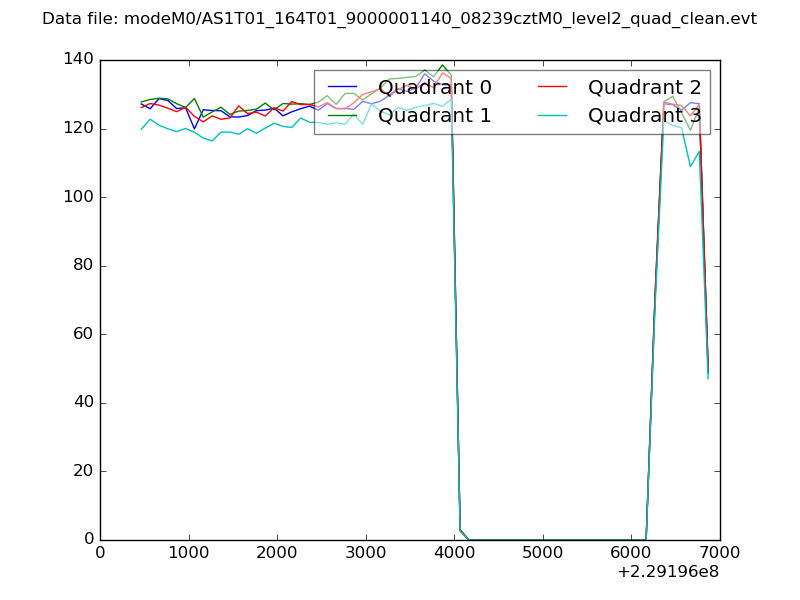 |
|
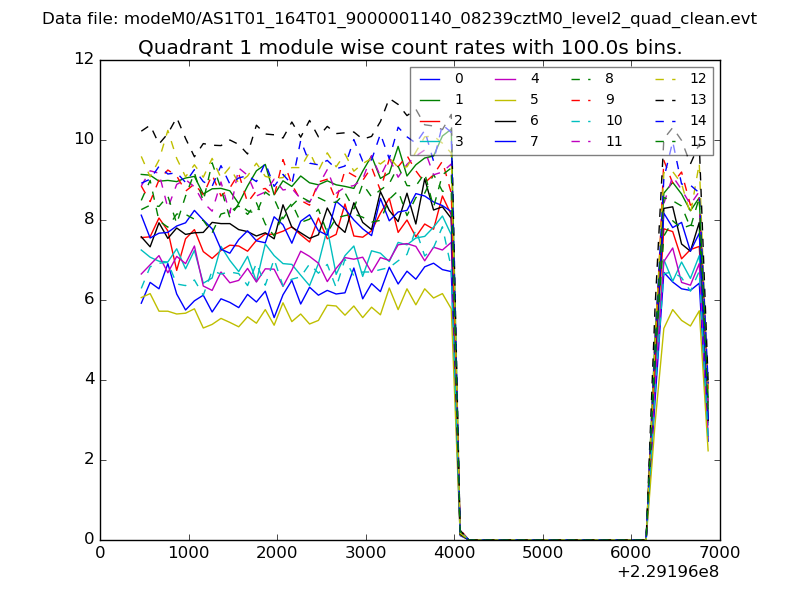
| Module-wise count rates for Quadrant A Data is divided into 100 sec bins |
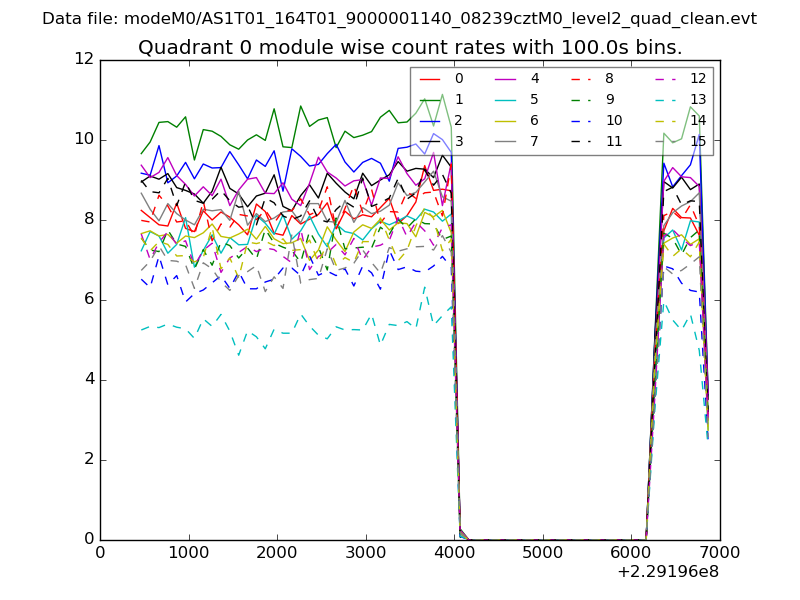 |
 |
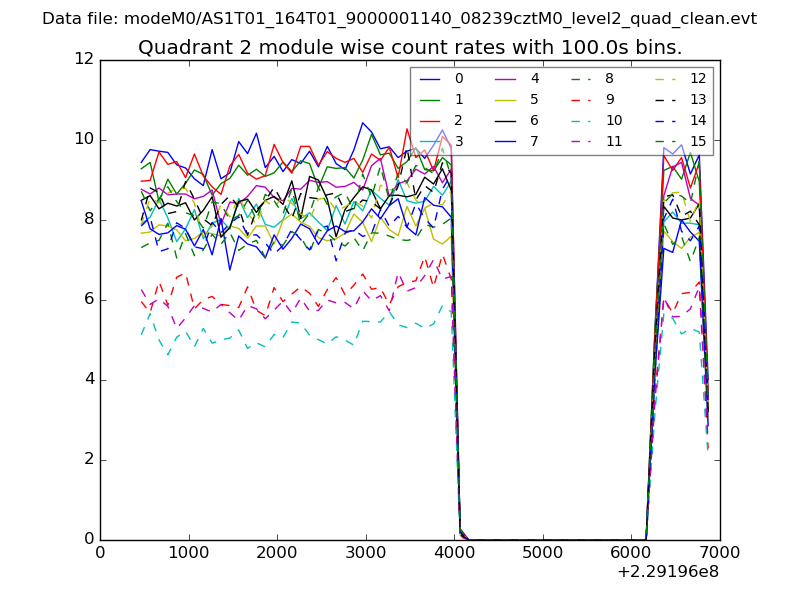
| Module-wise count rates for Quadrant B Data is divided into 100 sec bins |
 |
 |
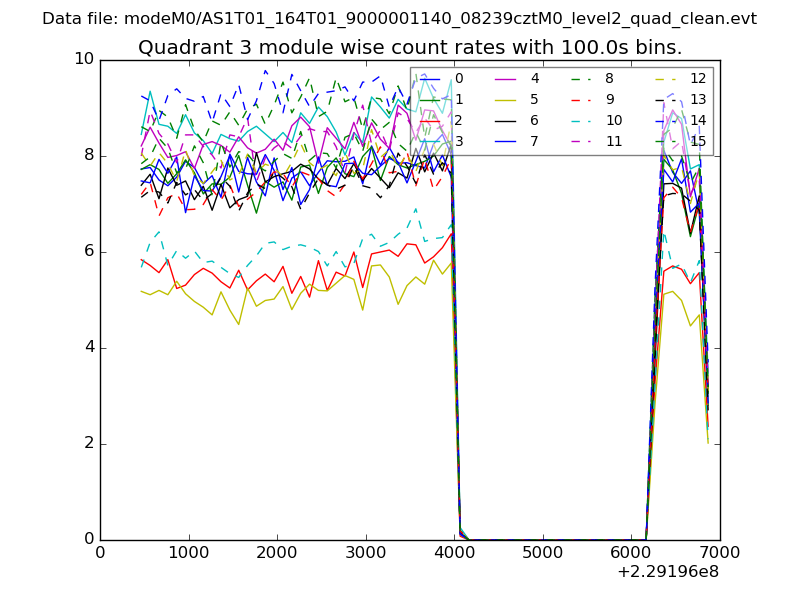
| Module-wise count rates for Quadrant C Data is divided into 100 sec bins |
 |
 |
| Module-wise count rates for Quadrant D Data is divided into 100 sec bins |
 |
 |
| Parameter | Plot |
|---|---|
| CZT HV Monitor | 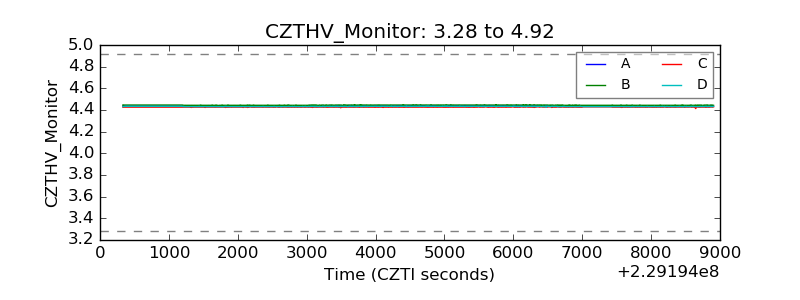 |
| D_VDD | 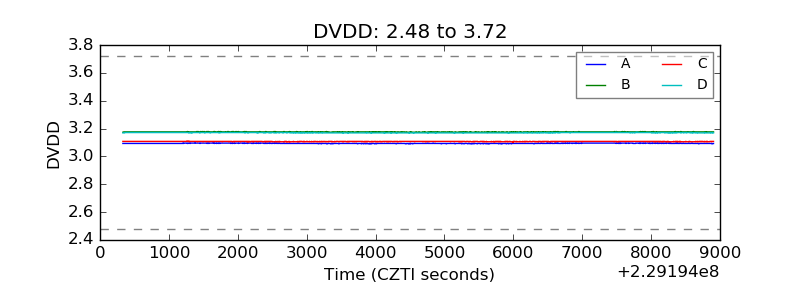 |
| Temperature 1 |  |
| Veto HV Monitor | 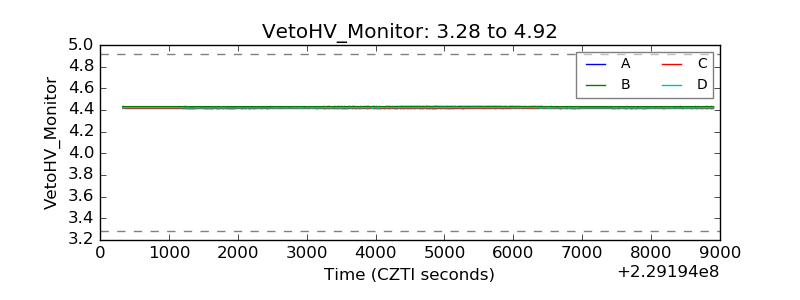 |
| Veto LLD | 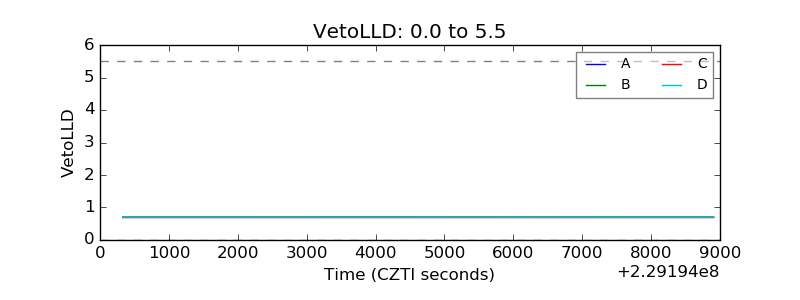 |
| Alpha Counter | 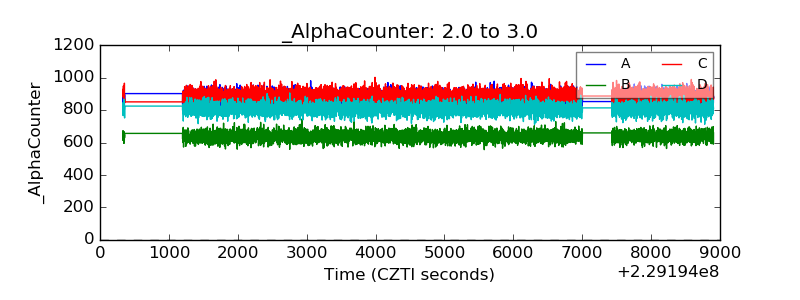 |
| _CPM_Rate | 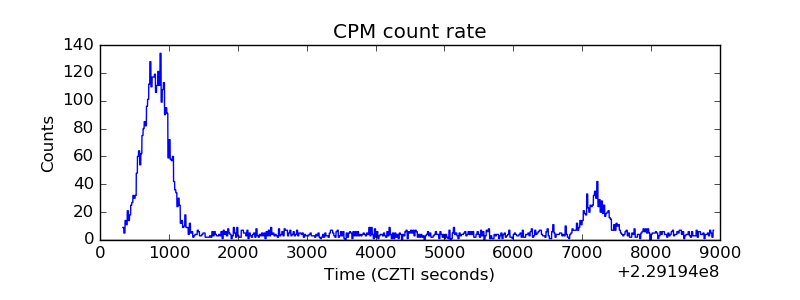 |
| CZT Counter | 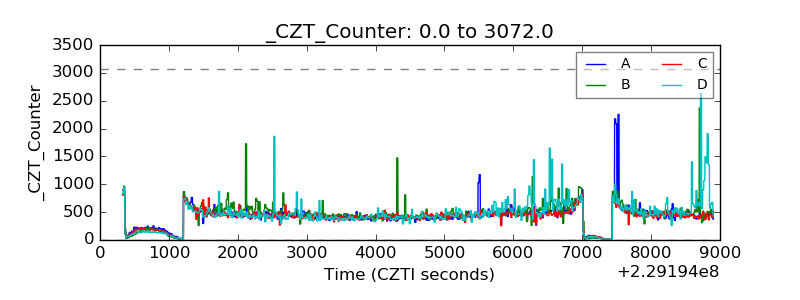 |
| +2.5 Volts monitor |  |
| +5 Volts monitor |  |
| _ROLL_ROT |  |
| _Roll_DEC | 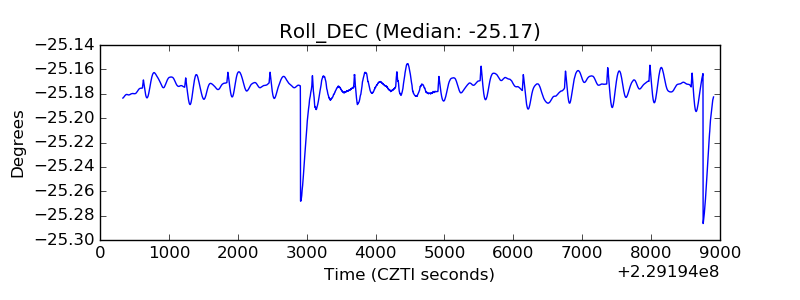 |
| _Roll_RA | 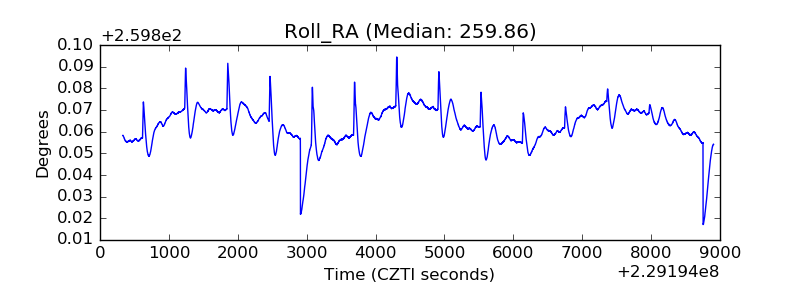 |
| Veto Counter | 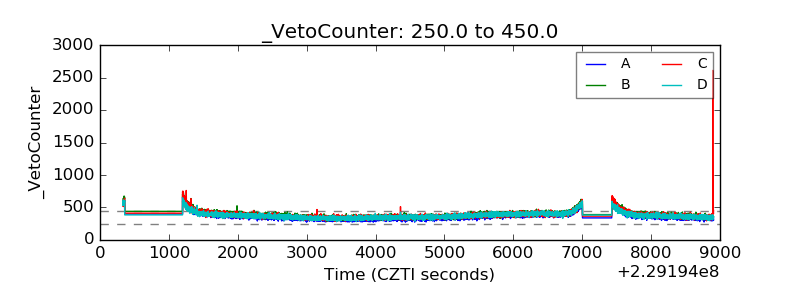 |