| Param | Original file | Final file |
|---|---|---|
| Filename | modeM0/AS1C02_028T01_9000001146cztM0_level2.fits | modeM0/AS1C02_028T01_9000001146cztM0_level2_quad_clean.evt |
| Size (bytes) | 244,054,080 | 204,439,680 |
| Size | 232.7 MB | 195.0 MB |
| Events in quadrant A | 772,659 | 673,824 |
| Events in quadrant B | 1,683,044 | 1,344,881 |
| Events in quadrant C | 1,713,881 | 1,239,355 |
| Events in quadrant D | 1,460,619 | 1,179,556 |
| Mode M9 | |||
|---|---|---|---|
| Quadrant | BADHDUFLAG | Total packets | Discarded packets |
| A | 0 | 35 | 0 |
| B | 0 | 39 | 0 |
| C | 0 | 37 | 0 |
| D | 0 | 37 | 0 |
| Mode SS | |||
|---|---|---|---|
| Quadrant | BADHDUFLAG | Total packets | Discarded packets |
| A | 0 | 508 | 0 |
| B | 0 | 527 | 0 |
| C | 0 | 524 | 0 |
| D | 0 | 524 | 0 |
| Mode M0 | |||
|---|---|---|---|
| Quadrant | BADHDUFLAG | Total packets | Discarded packets |
| A | 0 | 153585 | 0 |
| B | 0 | 53600 | 0 |
| C | 0 | 51968 | 0 |
| D | 0 | 63386 | 0 |
| Quadrant | Total seconds | Saturated seconds | Saturation percentage |
|---|---|---|---|
| A | 25536 | 15094 | 59.108709% |
| B | 25543 | 204 | 0.798653% |
| C | 25486 | 115 | 0.451228% |
| D | 25365 | 999 | 3.938498% |
Noise dominated data is calculated using 1-second bins in cleaned event files. If a bin has >2000 counts, and if more than 50% of those come from <1% of pixels, then it is considered to be noise-dominated and hence unusable.
| Quadrant | # 1 sec bins | Bins with >0 counts | Bins with >2000 counts | High rate bins dominated by noise | Noise dominated (total time) | Noise dominated (detector-on time) | Marked lightcurve |
|---|---|---|---|---|---|---|---|
| A | 21600 | 18962 | 0 | 0 | 0.00% | 0.00% |  |
| B | 21600 | 20451 | 0 | 0 | 0.00% | 0.00% |  |
| C | 21600 | 20432 | 0 | 0 | 0.00% | 0.00% |  |
| D | 21600 | 20406 | 0 | 0 | 0.00% | 0.00% |  |
Top three noisy pixels from each quadrant. If the there are fewer than three noisy pixels in the level2.evt file, extra rows are filled as -1
| Pixel properties | Quadrant properties | ||||||
|---|---|---|---|---|---|---|---|
| Quadrant | DetID | PixID | Counts | Sigma | Mean | Median | Sigma |
| A | 14 | 188 | 802 | 11.82 | 200 | 188 | 51.9 |
| A | 14 | 204 | 712 | 10.09 | 200 | 188 | 51.9 |
| A | 0 | 29 | 706 | 9.97 | 200 | 188 | 51.9 |
| B | 2 | 9 | 1223 | 9.41 | 447 | 426 | 84.7 |
| B | 12 | 226 | 1031 | 7.14 | 447 | 426 | 84.7 |
| B | 5 | 128 | 988 | 6.63 | 447 | 426 | 84.7 |
| C | 1 | 80 | 1079 | 5.67 | 456 | 437 | 113.1 |
| C | 12 | 241 | 1068 | 5.58 | 456 | 437 | 113.1 |
| C | 9 | 242 | 1013 | 5.09 | 456 | 437 | 113.1 |
| D | 6 | 231 | 971 | 5.74 | 418 | 389 | 101.3 |
| D | 3 | 14 | 939 | 5.43 | 418 | 389 | 101.3 |
| D | 1 | 19 | 931 | 5.35 | 418 | 389 | 101.3 |
Histogram calculated using DETX and DETY for each event in the final _common_clean file
| Quadrant A |  |
 |
Quadrant B |
|---|---|---|---|
| Quadrant D | 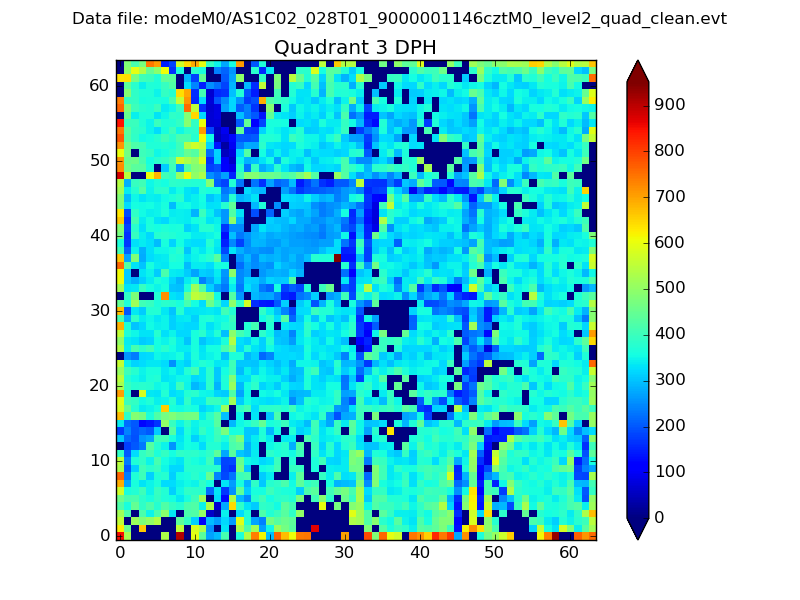 |
 |
Quadrant C |
| Plot type | Count rate plots | Images |
|---|---|---|
| Comparison with Poisson distribution Blue bars denote a histogram of data divided into 1 sec bins. Red curve is a Poisson curve with rate = median count rate of data. |
 |
 |
| Quadrant-wise count rates Data is divided into 100 sec bins |
 |
|
| Module-wise count rates for Quadrant A Data is divided into 100 sec bins |
 |
 |
| Module-wise count rates for Quadrant B Data is divided into 100 sec bins |
 |
 |
| Module-wise count rates for Quadrant C Data is divided into 100 sec bins |
 |
 |
| Module-wise count rates for Quadrant D Data is divided into 100 sec bins |
 |
 |
| Parameter | Plot |
|---|---|
| CZT HV Monitor |  |
| D_VDD |  |
| Temperature 1 |  |
| Veto HV Monitor |  |
| Veto LLD |  |
| Alpha Counter |  |
| _CPM_Rate |  |
| CZT Counter |  |
| +2.5 Volts monitor |  |
| +5 Volts monitor |  |
| _ROLL_ROT |  |
| _Roll_DEC |  |
| _Roll_RA |  |
| Veto Counter |  |