| Param | Original file | Final file |
|---|---|---|
| Filename | modeM0/AS1C02_028T01_9000001146_08437cztM0_level2.evt | modeM0/AS1C02_028T01_9000001146_08437cztM0_level2_quad_clean.evt |
| Size (bytes) | 57,392,640 | 7,750,080 |
| Size | 54.7 MB | 7.4 MB |
| Events in quadrant A | 403,956 | 39,058 |
| Events in quadrant B | 451,791 | 51,266 |
| Events in quadrant C | 393,072 | 41,947 |
| Events in quadrant D | 428,291 | 35,732 |
| Mode SS | |||
|---|---|---|---|
| Quadrant | BADHDUFLAG | Total packets | Discarded packets |
| A | 0 | 273359709408 | 0 |
| B | 0 | -1 | -1 |
| C | 0 | -1 | -1 |
| D | 0 | -1 | -1 |
| Mode M0 | |||
|---|---|---|---|
| Quadrant | BADHDUFLAG | Total packets | Discarded packets |
| A | 0 | 2485 | 732 |
| B | 0 | 2671 | 792 |
| C | 0 | 2543 | 785 |
| D | 0 | 2842 | 1069 |
| Quadrant | Total seconds | Saturated seconds | Saturation percentage |
|---|---|---|---|
| A | 875 | 2 | 0.228571% |
| B | 903 | 1 | 0.110742% |
| C | 879 | 0 | 0.000000% |
| D | 774 | 4 | 0.516796% |
Noise dominated data is calculated using 1-second bins in cleaned event files. If a bin has >2000 counts, and if more than 50% of those come from <1% of pixels, then it is considered to be noise-dominated and hence unusable.
| Quadrant | # 1 sec bins | Bins with >0 counts | Bins with >2000 counts | High rate bins dominated by noise | Noise dominated (total time) | Noise dominated (detector-on time) | Marked lightcurve |
|---|---|---|---|---|---|---|---|
| A | 1637 | 1251 | 0 | 0 | 0.00% | 0.00% | 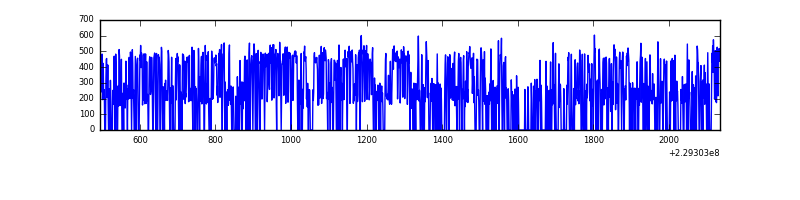 |
| B | 1640 | 1267 | 0 | 0 | 0.00% | 0.00% | 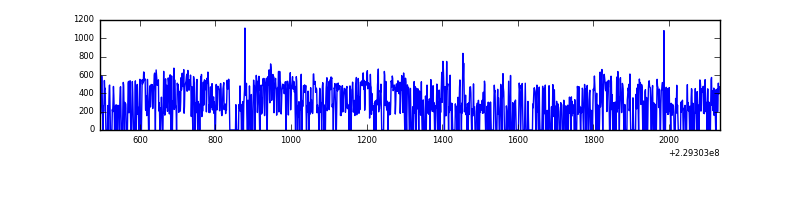 |
| C | 1639 | 1227 | 0 | 0 | 0.00% | 0.00% |  |
| D | 1638 | 1137 | 0 | 0 | 0.00% | 0.00% | 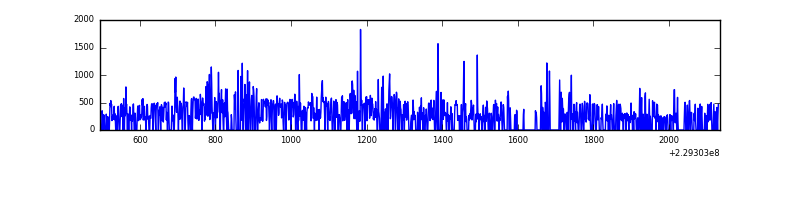 |
Top three noisy pixels from each quadrant. If the there are fewer than three noisy pixels in the level2.evt file, extra rows are filled as -1
| Pixel properties | Quadrant properties | ||||||
|---|---|---|---|---|---|---|---|
| Quadrant | DetID | PixID | Counts | Sigma | Mean | Median | Sigma |
| A | 12 | 194 | 1037 | 40.24 | 104 | 102 | 23.2 |
| A | 0 | 226 | 1017 | 39.38 | 104 | 102 | 23.2 |
| A | 15 | 236 | 876 | 33.31 | 104 | 102 | 23.2 |
| B | 0 | 214 | 33080 | 1497.22 | 105 | 103 | 22.0 |
| B | 11 | 51 | 6304 | 281.54 | 105 | 103 | 22.0 |
| B | 12 | 111 | 1874 | 80.41 | 105 | 103 | 22.0 |
| C | 13 | 61 | 733 | 25.54 | 100 | 100 | 24.8 |
| C | 12 | 4 | 618 | 20.89 | 100 | 100 | 24.8 |
| C | 3 | 202 | 270 | 6.84 | 100 | 100 | 24.8 |
| D | 6 | 225 | 52030 | 2199.8 | 89 | 86 | 23.6 |
| D | 7 | 71 | 25838 | 1090.58 | 89 | 86 | 23.6 |
| D | 12 | 233 | 9513 | 399.23 | 89 | 86 | 23.6 |
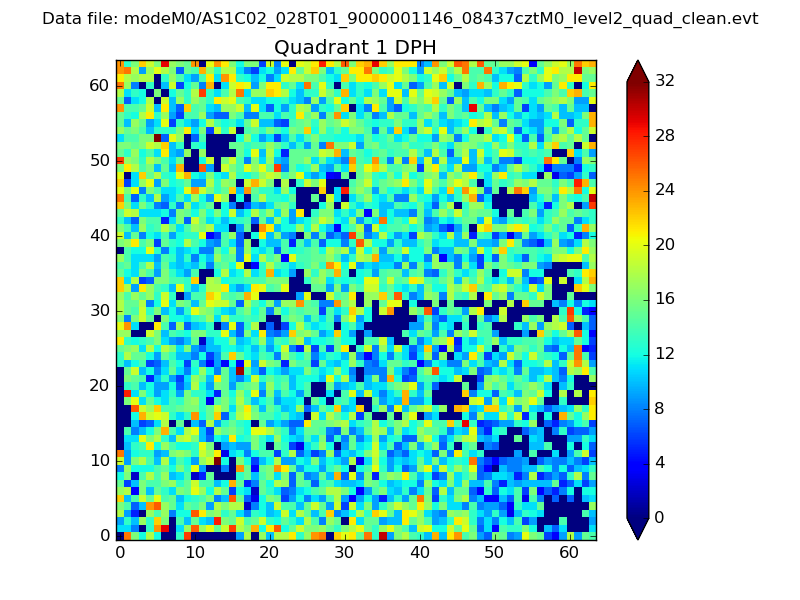
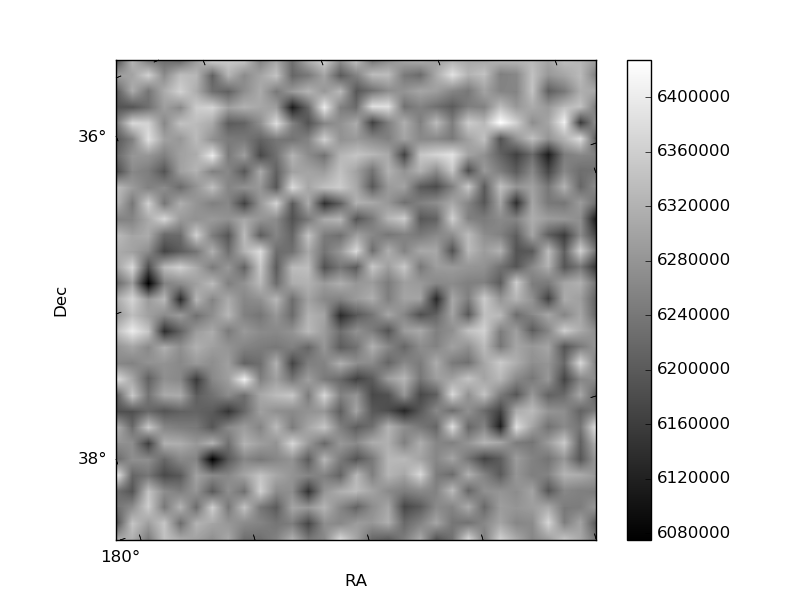
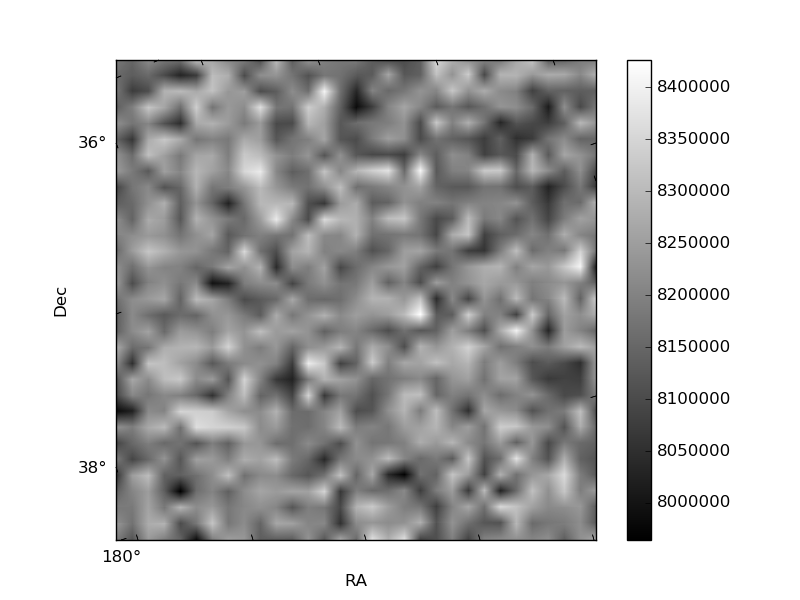
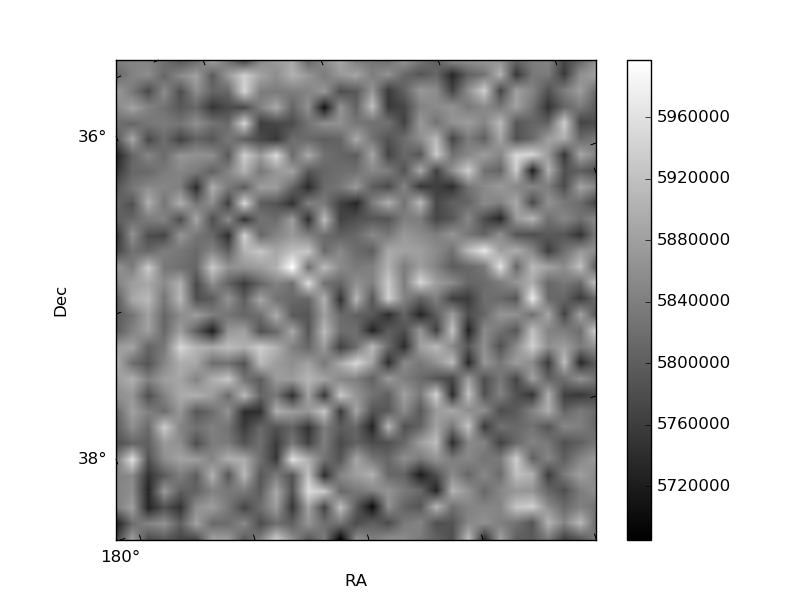
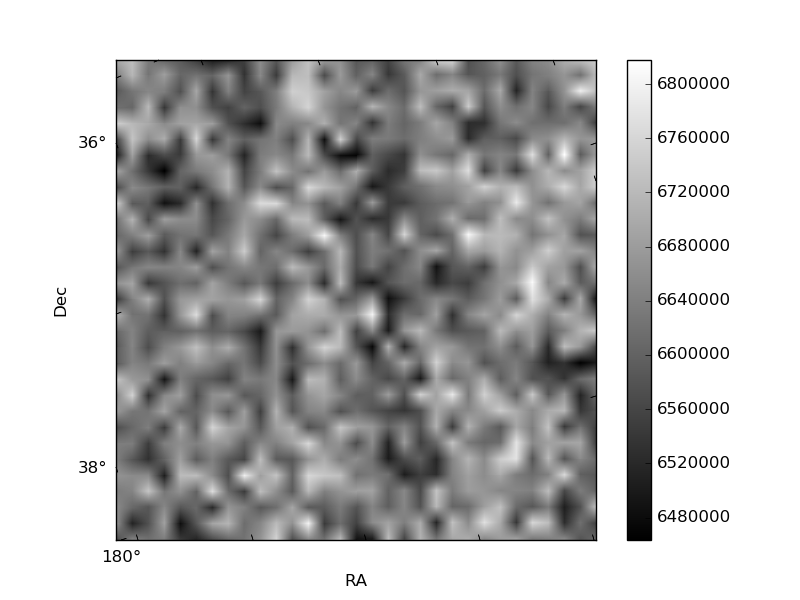
Histogram calculated using DETX and DETY for each event in the final _common_clean file
| Quadrant A |  |
 |
Quadrant B |
|---|---|---|---|
| Quadrant D |  |
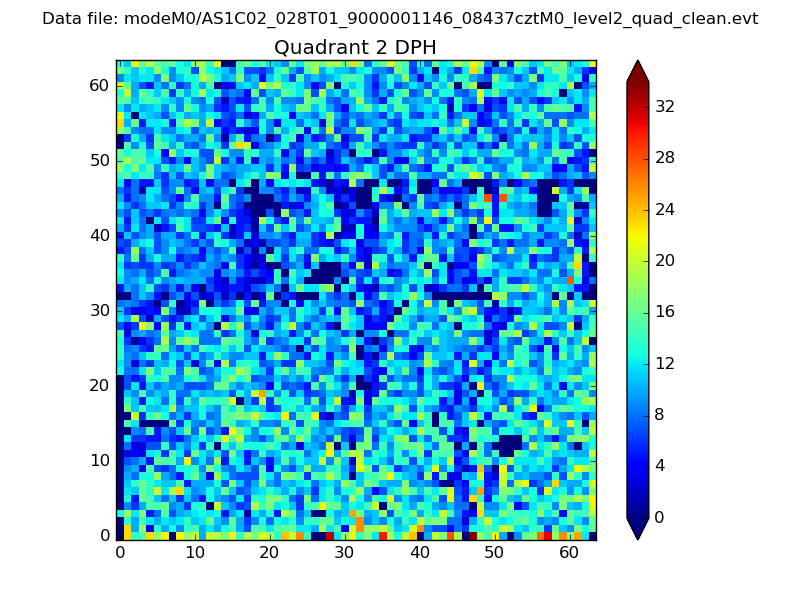 |
Quadrant C |
| Plot type | Count rate plots | Images |
|---|---|---|
| Comparison with Poisson distribution Blue bars denote a histogram of data divided into 1 sec bins. Red curve is a Poisson curve with rate = median count rate of data. |
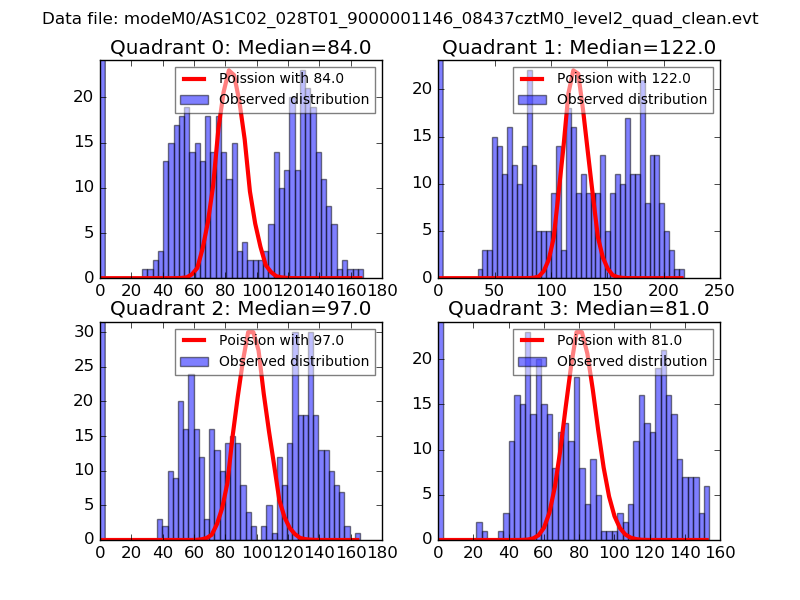 |
 |
| Quadrant-wise count rates Data is divided into 100 sec bins |
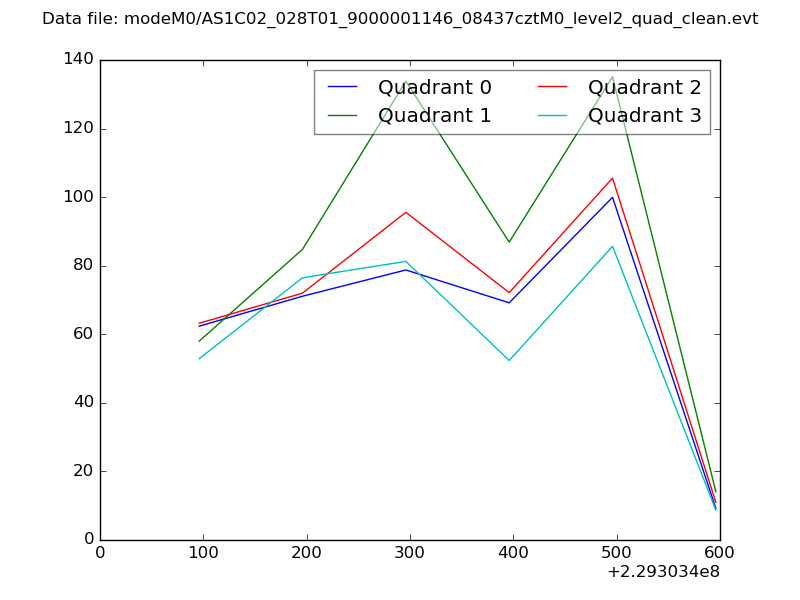 |
|
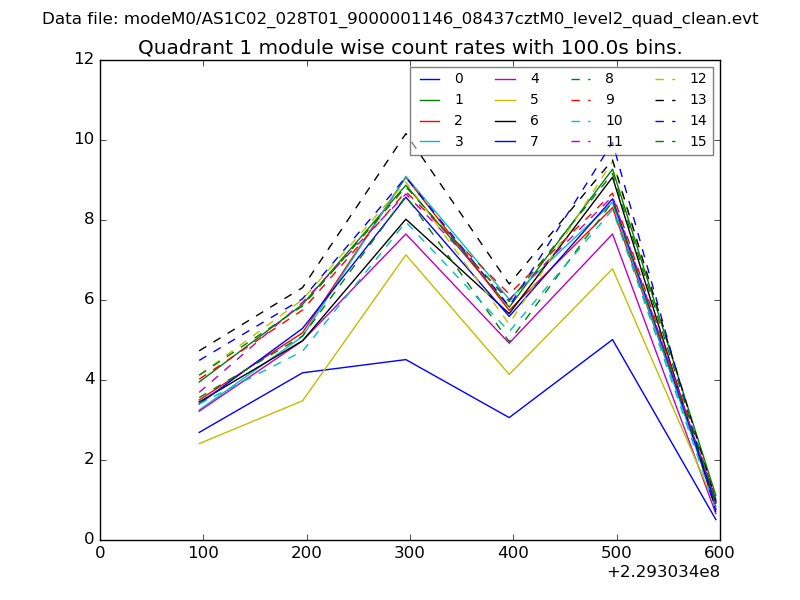
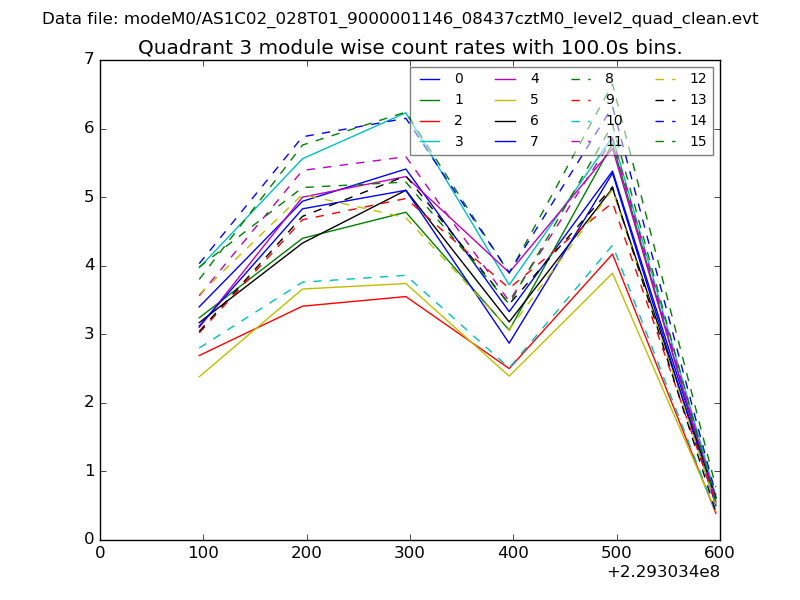
| Module-wise count rates for Quadrant A Data is divided into 100 sec bins |
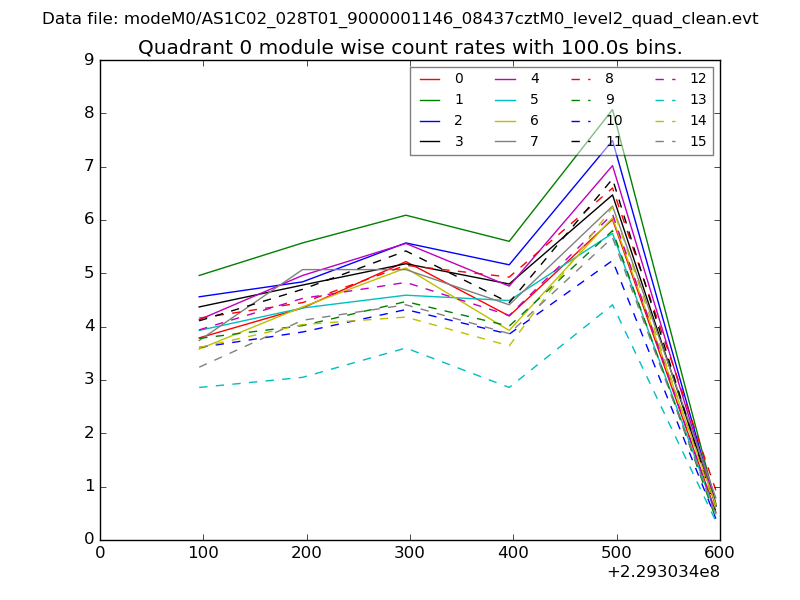 |
 |
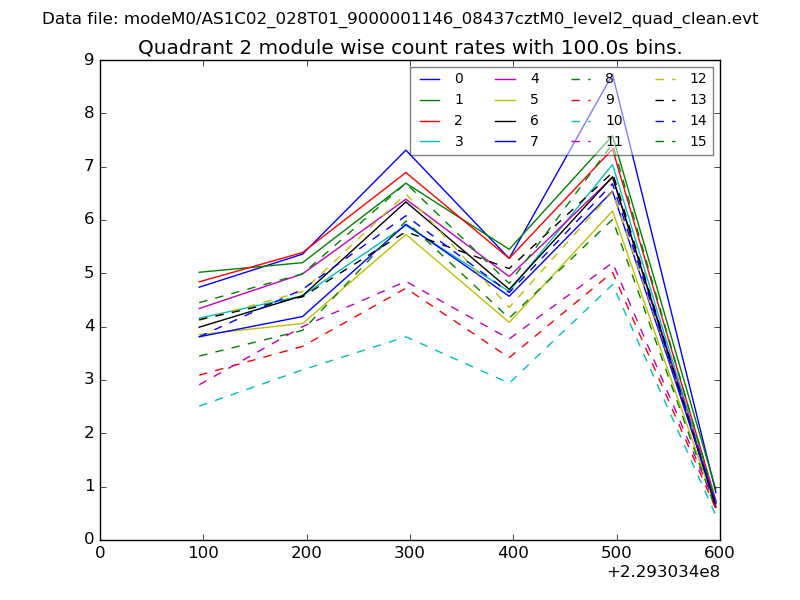
| Module-wise count rates for Quadrant B Data is divided into 100 sec bins |
 |
 |
| Module-wise count rates for Quadrant C Data is divided into 100 sec bins |
 |
 |
| Module-wise count rates for Quadrant D Data is divided into 100 sec bins |
 |
 |
| Parameter | Plot |
|---|---|
| CZT HV Monitor | 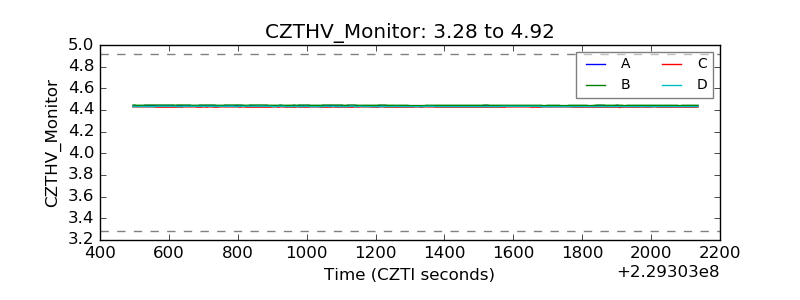 |
| D_VDD | 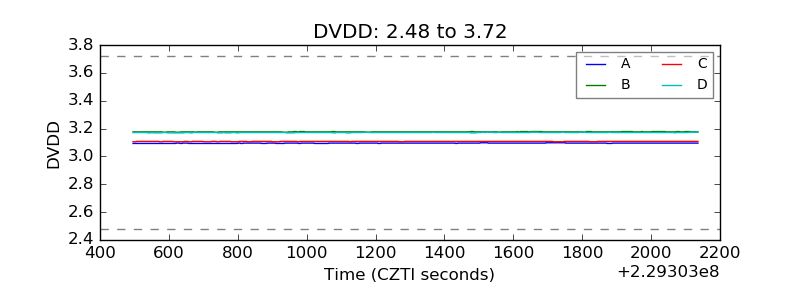 |
| Temperature 1 | 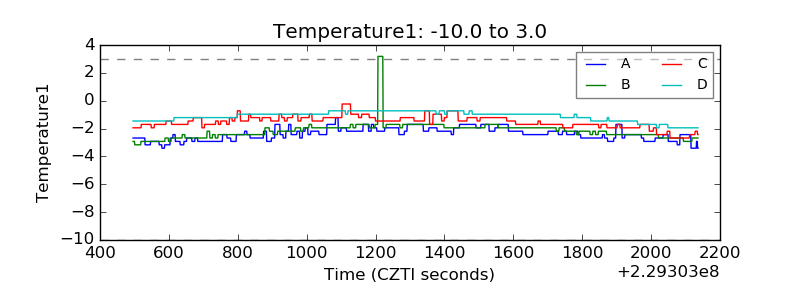 |
| Veto HV Monitor | 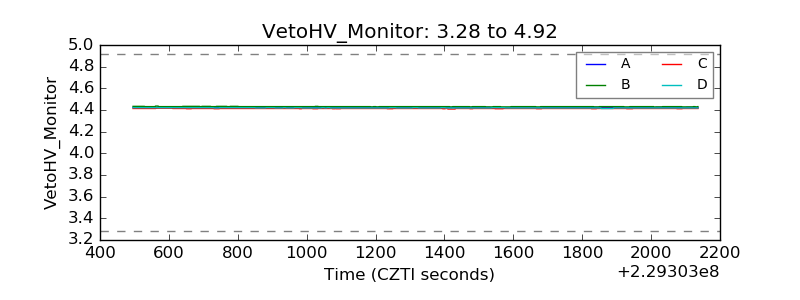 |
| Veto LLD | 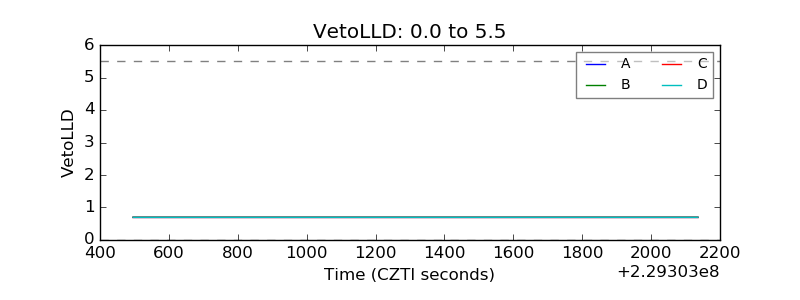 |
| Alpha Counter | 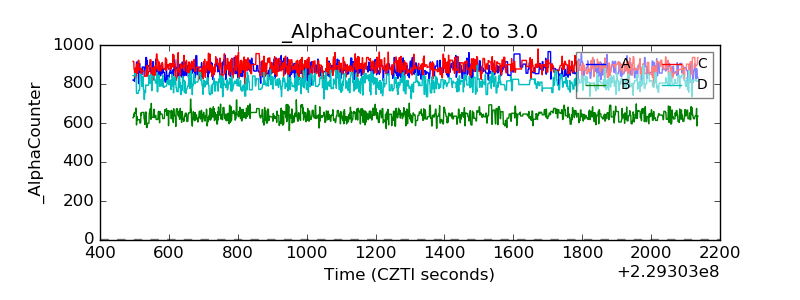 |
| _CPM_Rate | 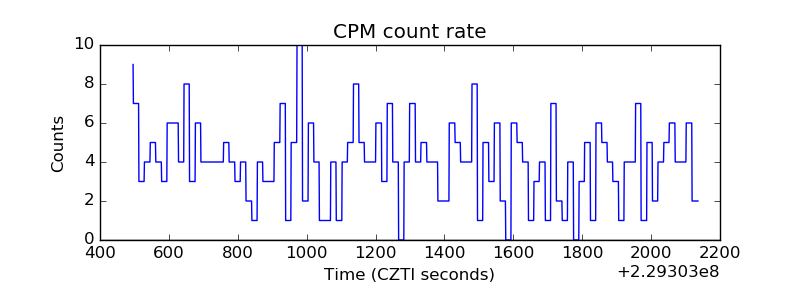 |
| CZT Counter | 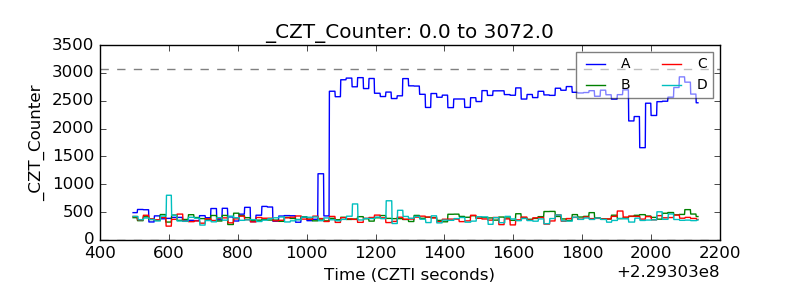 |
| +2.5 Volts monitor |  |
| +5 Volts monitor |  |
| _ROLL_ROT |  |
| _Roll_DEC | 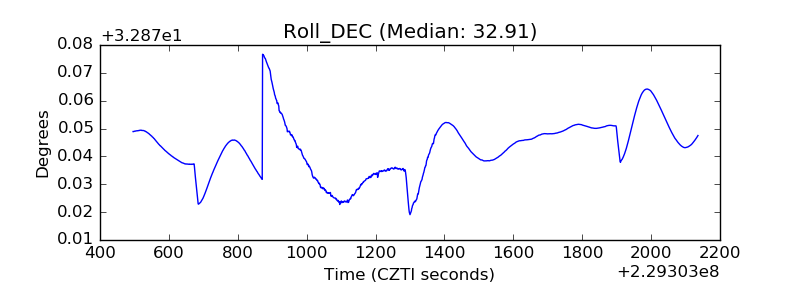 |
| _Roll_RA |  |
| Veto Counter | 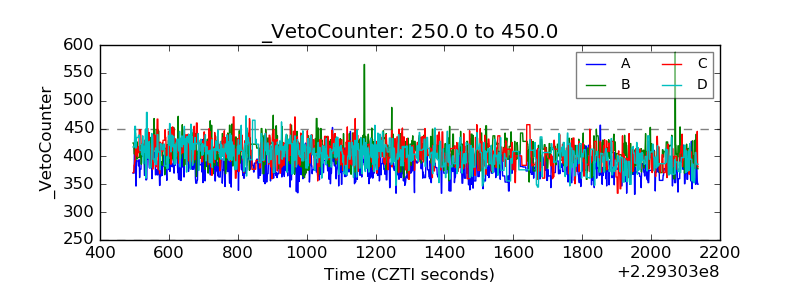 |