| Param | Original file | Final file |
|---|---|---|
| Filename | modeM0/AS1C02_028T01_9000001146_08438cztM0_level2.evt | modeM0/AS1C02_028T01_9000001146_08438cztM0_level2_quad_clean.evt |
| Size (bytes) | 25,318,080 | 4,052,160 |
| Size | 24.1 MB | 3.9 MB |
| Events in quadrant A | 202,786 | 25,267 |
| Events in quadrant B | 190,302 | 20,887 |
| Events in quadrant C | 177,618 | 21,067 |
| Events in quadrant D | 168,560 | 22,377 |
| Mode M9 | |||
|---|---|---|---|
| Quadrant | BADHDUFLAG | Total packets | Discarded packets |
| A | 0 | 6 | 0 |
| B | 0 | 10 | 0 |
| C | 0 | 8 | 0 |
| D | 0 | 8 | 0 |
| Mode SS | |||
|---|---|---|---|
| Quadrant | BADHDUFLAG | Total packets | Discarded packets |
| A | 0 | 72 | 62 |
| B | 0 | 60 | 51 |
| C | 0 | 63 | 56 |
| D | 0 | 65 | 53 |
| Mode M0 | |||
|---|---|---|---|
| Quadrant | BADHDUFLAG | Total packets | Discarded packets |
| A | 0 | 6779 | 5962 |
| B | 0 | 6910 | 6152 |
| C | 0 | 6608 | 5877 |
| D | 0 | 6921 | 6227 |
| Quadrant | Total seconds | Saturated seconds | Saturation percentage |
|---|---|---|---|
| A | 381 | 6 | 1.574803% |
| B | 340 | 8 | 2.352941% |
| C | 336 | 5 | 1.488095% |
| D | 320 | 6 | 1.875000% |
Noise dominated data is calculated using 1-second bins in cleaned event files. If a bin has >2000 counts, and if more than 50% of those come from <1% of pixels, then it is considered to be noise-dominated and hence unusable.
| Quadrant | # 1 sec bins | Bins with >0 counts | Bins with >2000 counts | High rate bins dominated by noise | Noise dominated (total time) | Noise dominated (detector-on time) | Marked lightcurve |
|---|---|---|---|---|---|---|---|
| A | 4347 | 607 | 0 | 0 | 0.00% | 0.00% |  |
| B | 2452 | 539 | 0 | 0 | 0.00% | 0.00% |  |
| C | 6004 | 552 | 0 | 0 | 0.00% | 0.00% | 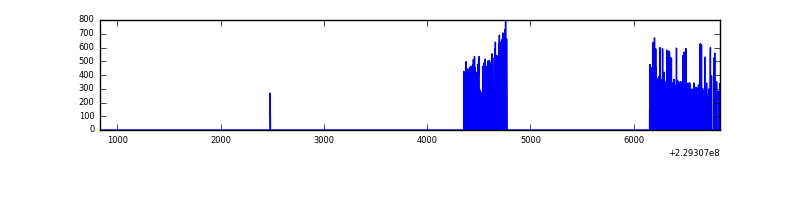 |
| D | 2481 | 537 | 0 | 0 | 0.00% | 0.00% |  |
Top three noisy pixels from each quadrant. If the there are fewer than three noisy pixels in the level2.evt file, extra rows are filled as -1
| Pixel properties | Quadrant properties | ||||||
|---|---|---|---|---|---|---|---|
| Quadrant | DetID | PixID | Counts | Sigma | Mean | Median | Sigma |
| A | 0 | 226 | 497 | 36.21 | 52 | 51 | 12.3 |
| A | 12 | 194 | 431 | 30.85 | 52 | 51 | 12.3 |
| A | 15 | 223 | 363 | 25.33 | 52 | 51 | 12.3 |
| B | 15 | 204 | 2199 | 196.77 | 47 | 46 | 10.9 |
| B | 5 | 255 | 1430 | 126.49 | 47 | 46 | 10.9 |
| B | 12 | 111 | 870 | 75.31 | 47 | 46 | 10.9 |
| C | 8 | 222 | 475 | 35.05 | 45 | 45 | 12.3 |
| C | 13 | 61 | 333 | 23.48 | 45 | 45 | 12.3 |
| C | 7 | 159 | 120 | 6.11 | 45 | 45 | 12.3 |
| D | 12 | 233 | 3938 | 323.04 | 42 | 40 | 12.1 |
| D | 13 | 169 | 1143 | 91.41 | 42 | 40 | 12.1 |
| D | 2 | 234 | 917 | 72.68 | 42 | 40 | 12.1 |
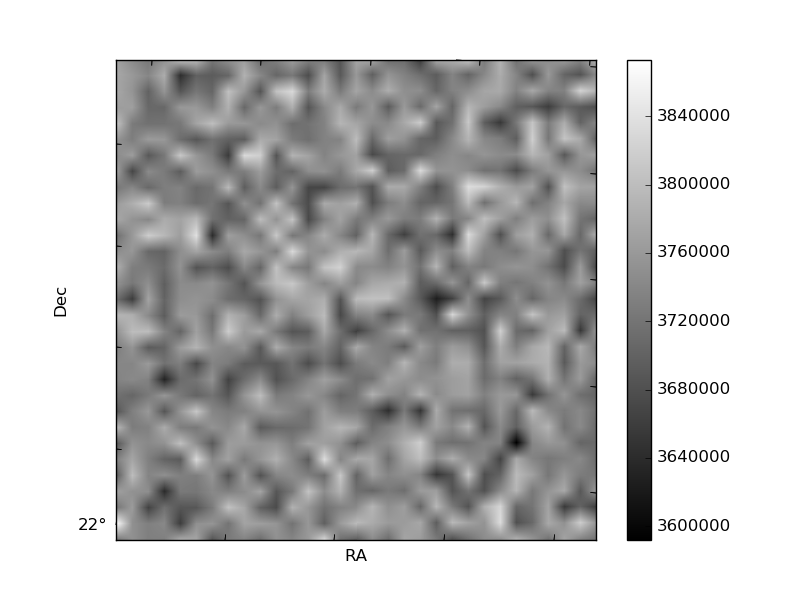
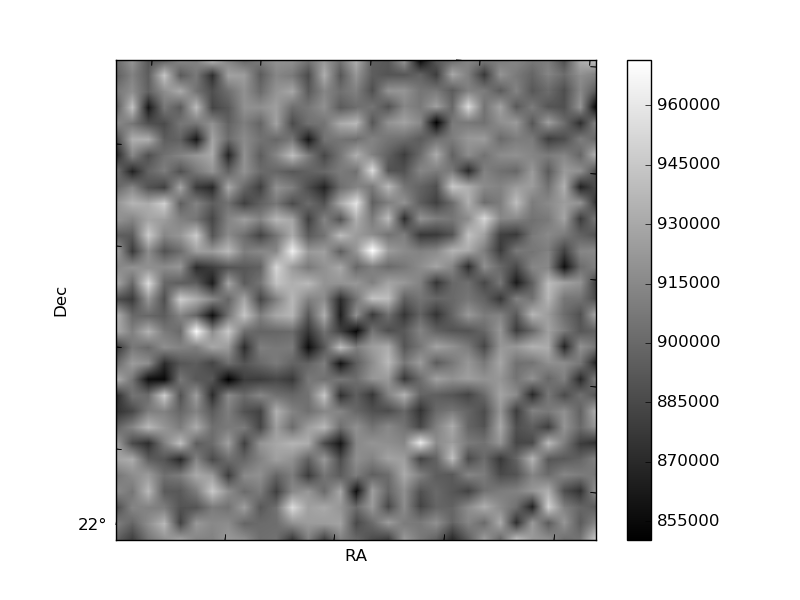
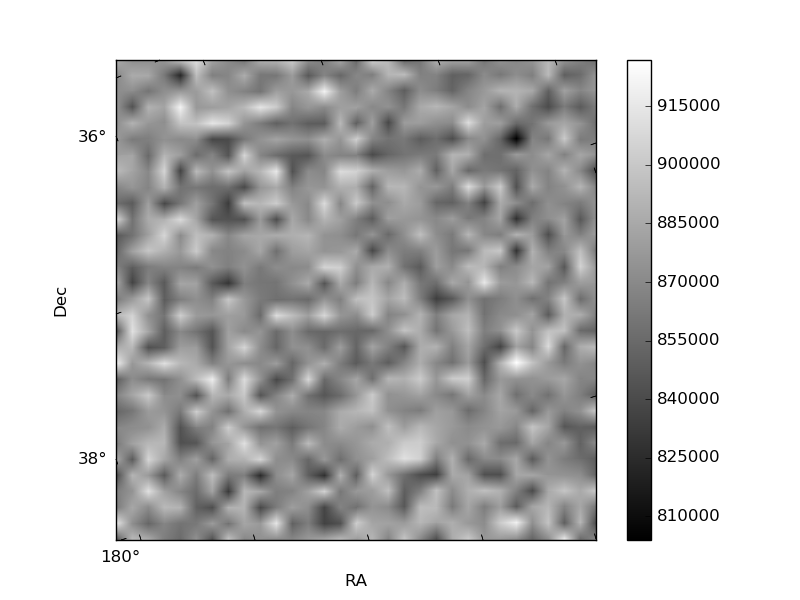
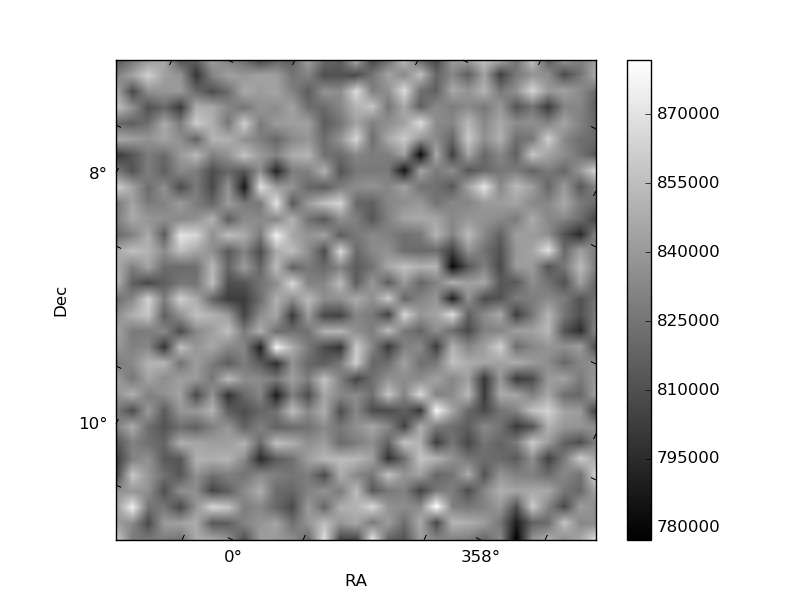
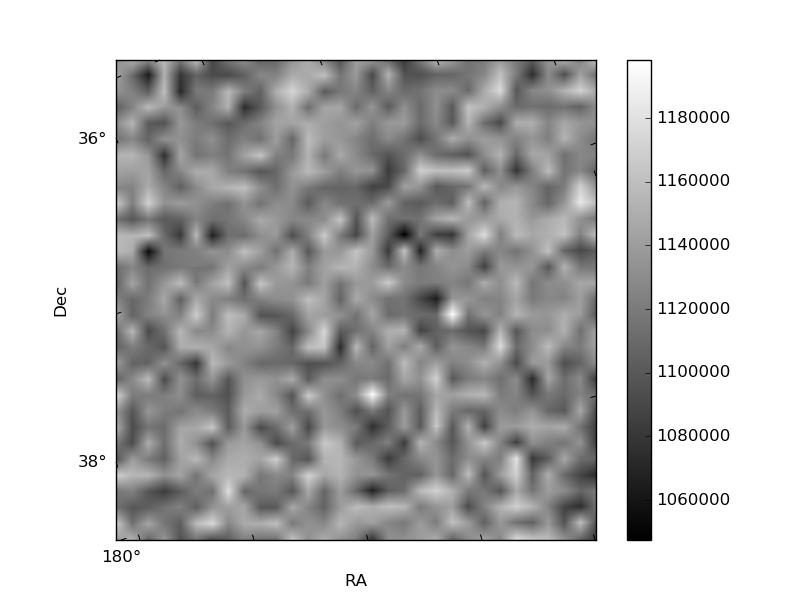
Histogram calculated using DETX and DETY for each event in the final _common_clean file
| Quadrant A | 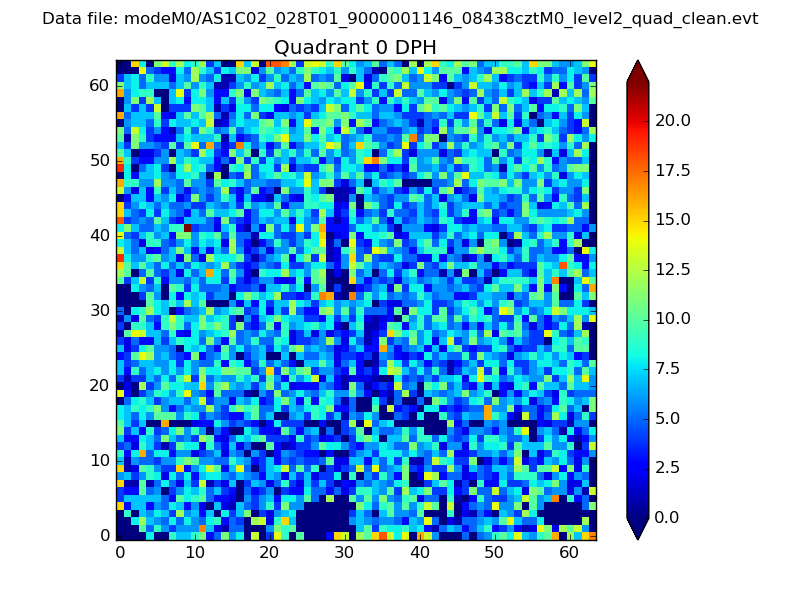 |
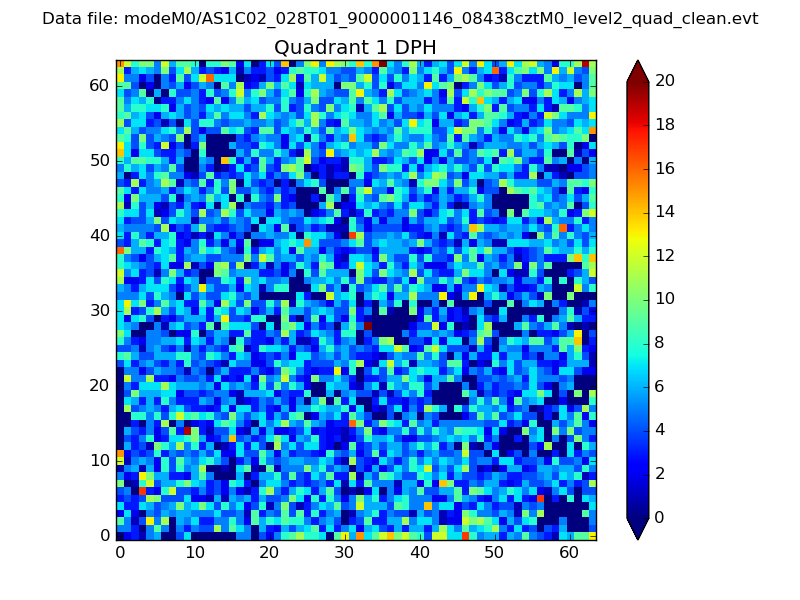 |
Quadrant B |
|---|---|---|---|
| Quadrant D |  |
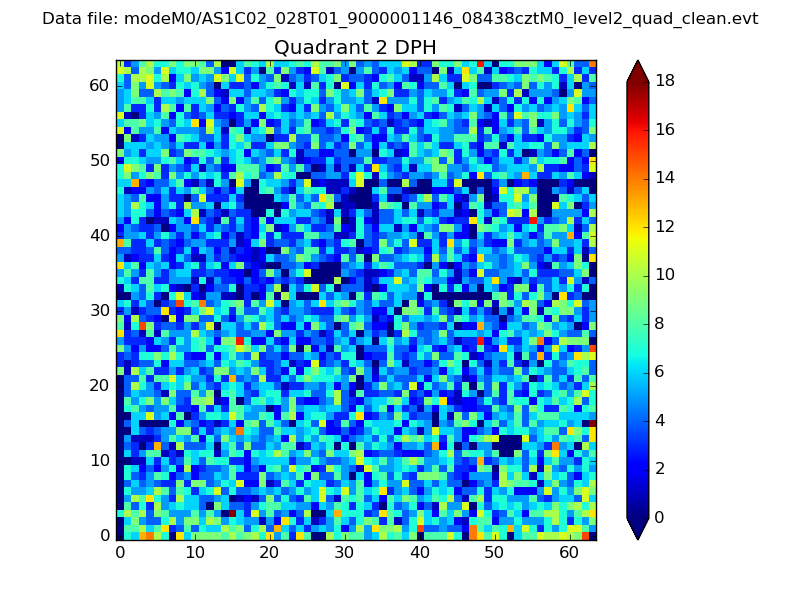 |
Quadrant C |
| Plot type | Count rate plots | Images |
|---|---|---|
| Comparison with Poisson distribution Blue bars denote a histogram of data divided into 1 sec bins. Red curve is a Poisson curve with rate = median count rate of data. |
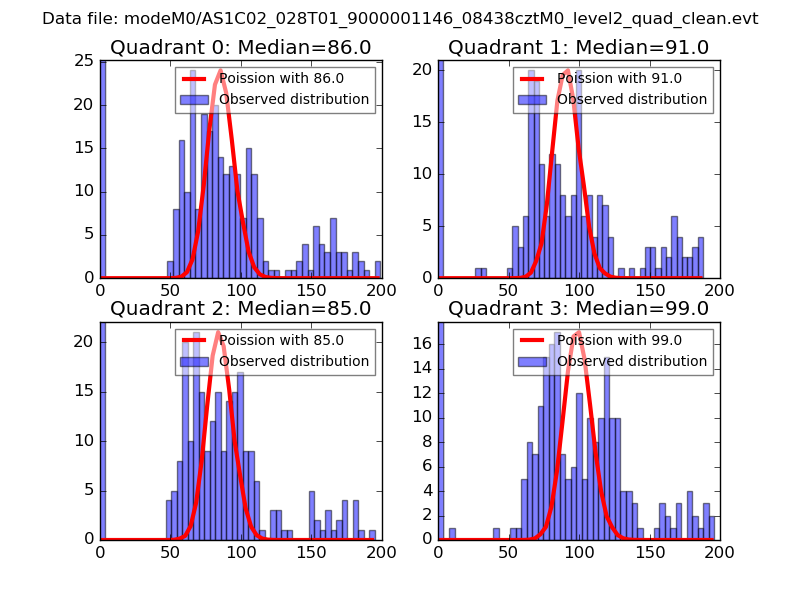 |
 |
| Quadrant-wise count rates Data is divided into 100 sec bins |
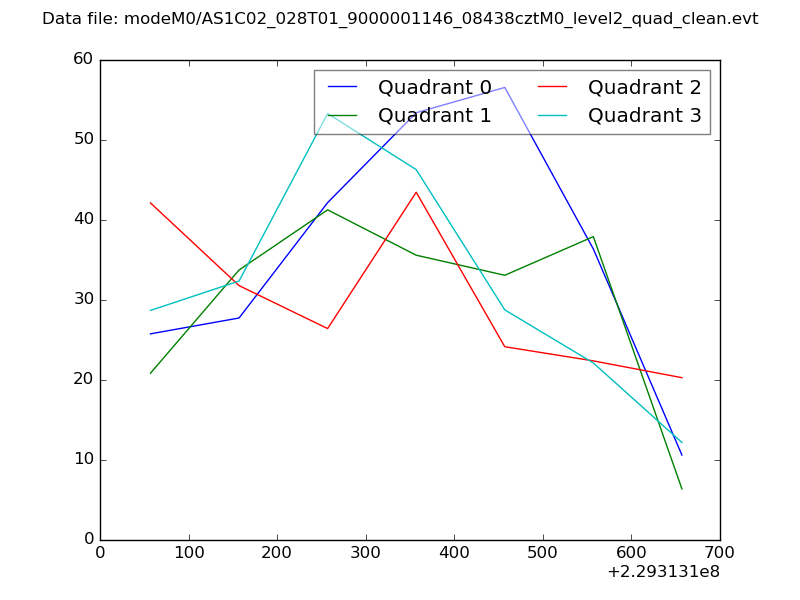 |
|
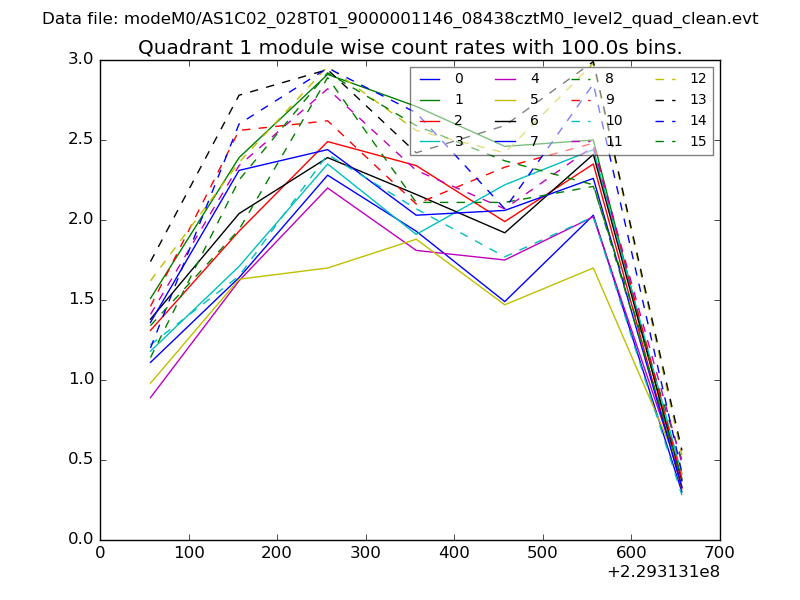
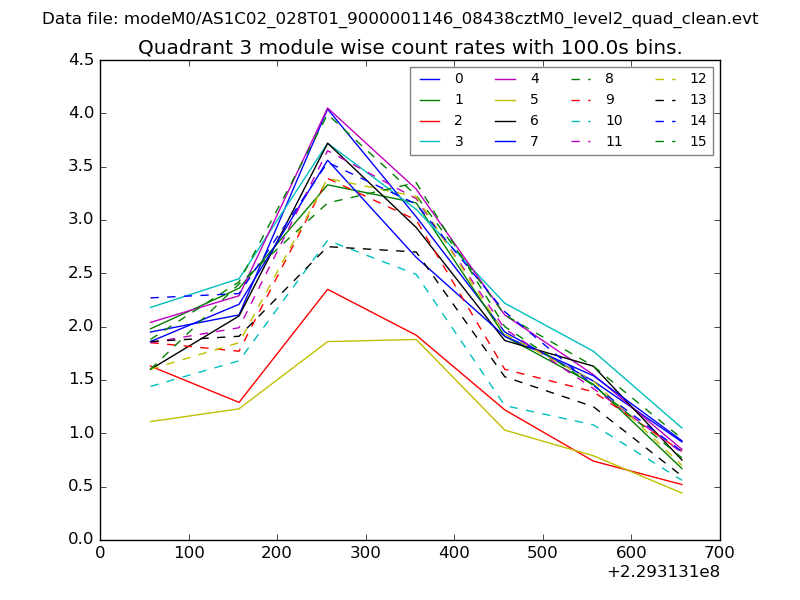
| Module-wise count rates for Quadrant A Data is divided into 100 sec bins |
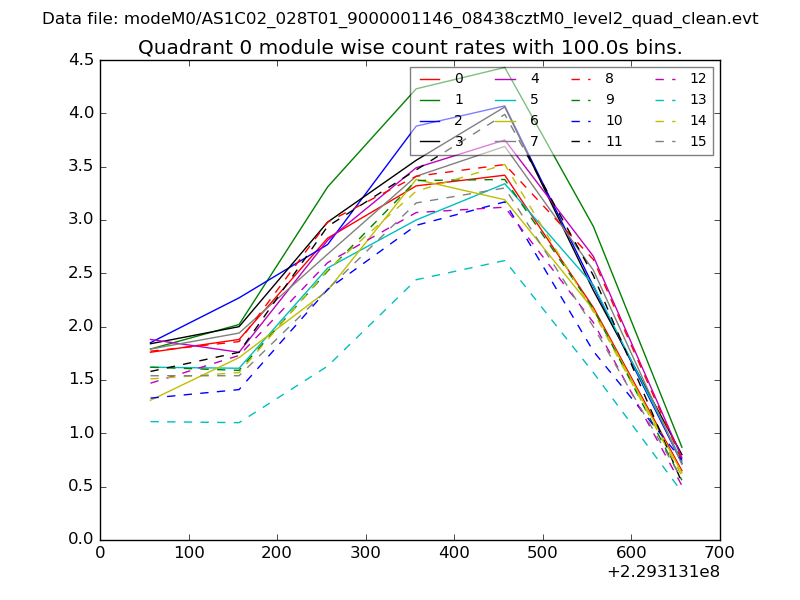 |
 |
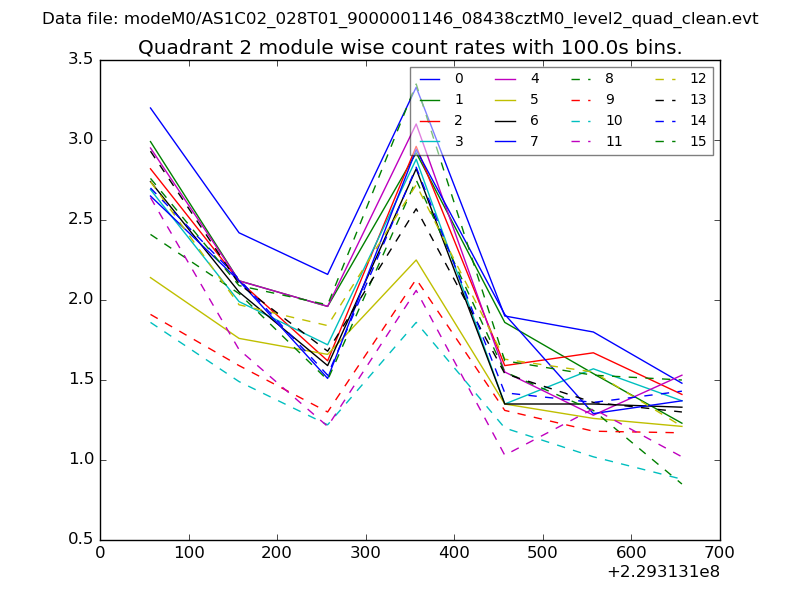
| Module-wise count rates for Quadrant B Data is divided into 100 sec bins |
 |
 |
| Module-wise count rates for Quadrant C Data is divided into 100 sec bins |
 |
 |
| Module-wise count rates for Quadrant D Data is divided into 100 sec bins |
 |
 |
| Parameter | Plot |
|---|---|
| CZT HV Monitor | 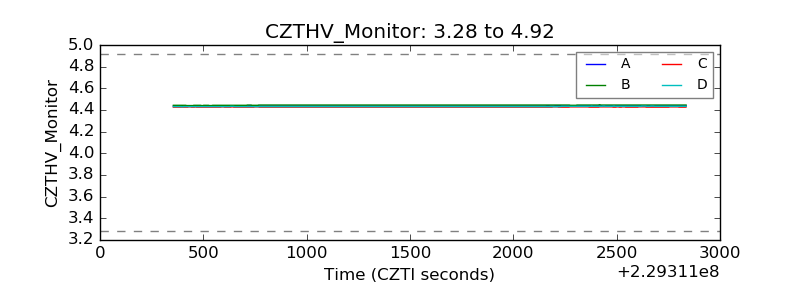 |
| D_VDD | 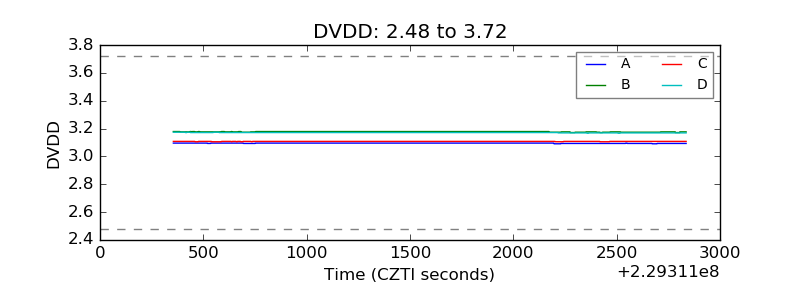 |
| Temperature 1 | 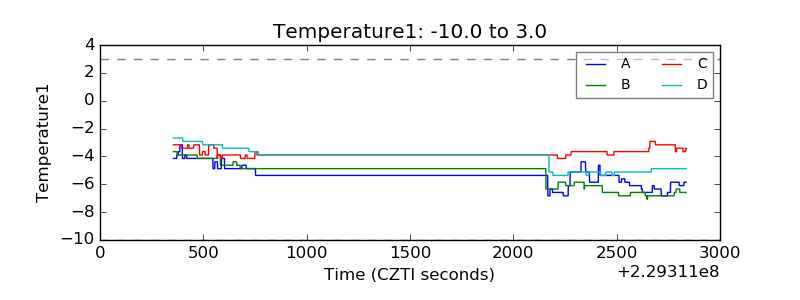 |
| Veto HV Monitor | 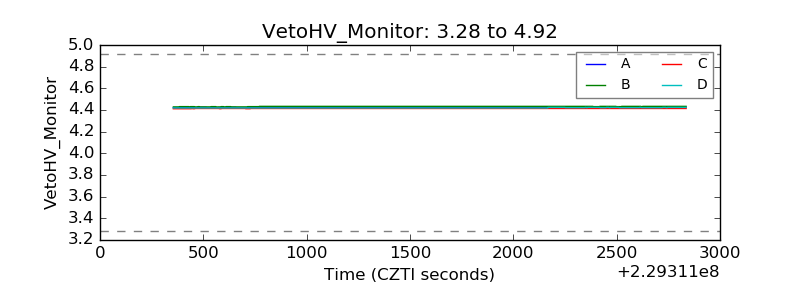 |
| Veto LLD |  |
| Alpha Counter | 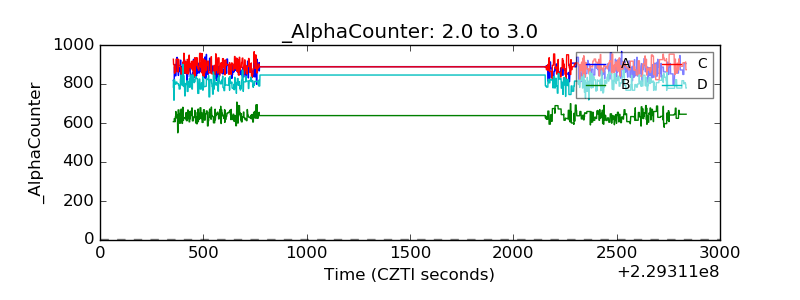 |
| _CPM_Rate | 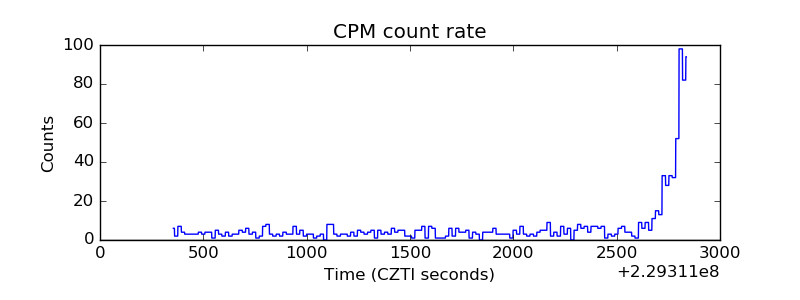 |
| CZT Counter | 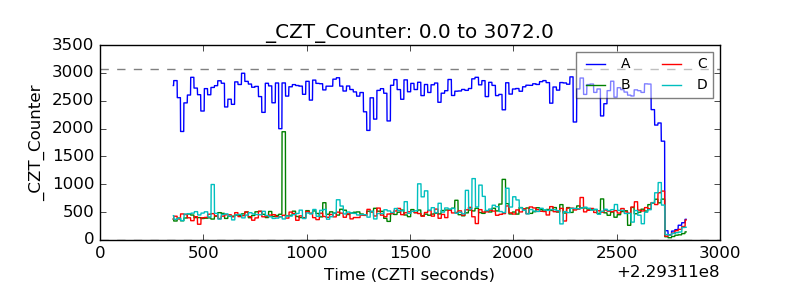 |
| +2.5 Volts monitor |  |
| +5 Volts monitor |  |
| _ROLL_ROT | 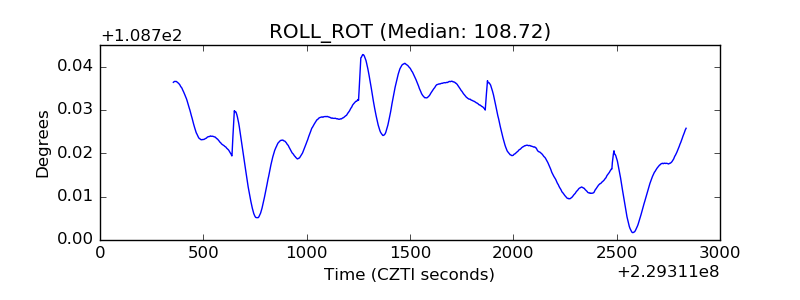 |
| _Roll_DEC | 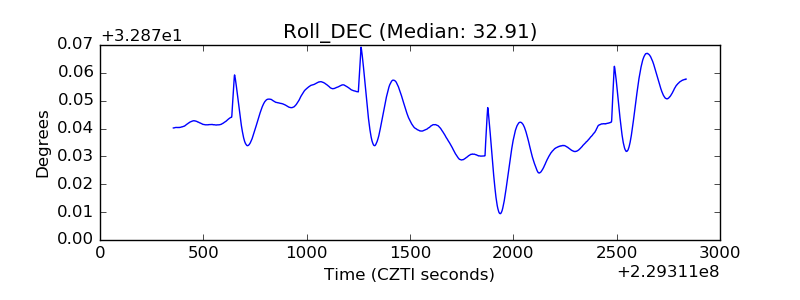 |
| _Roll_RA | 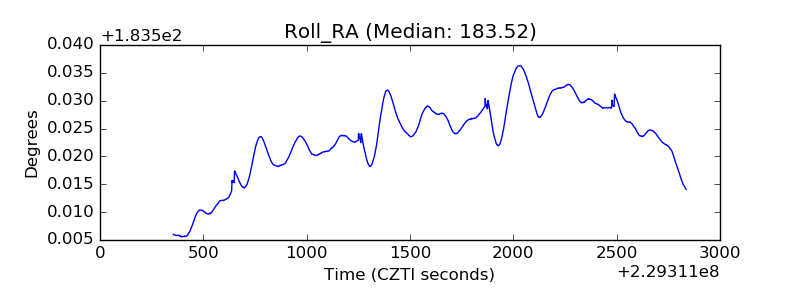 |
| Veto Counter | 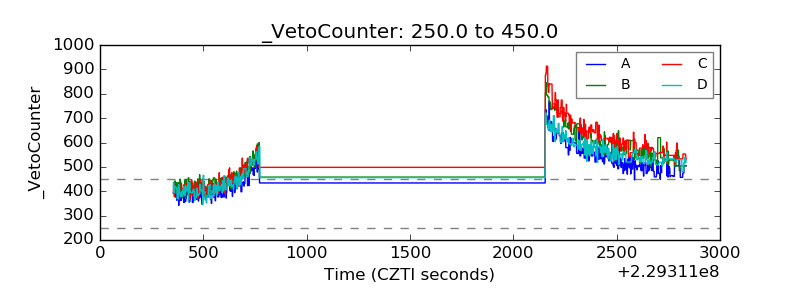 |