| Param | Original file | Final file |
|---|---|---|
| Filename | modeM0/AS1C02_028T01_9000001146_08439cztM0_level2.evt | modeM0/AS1C02_028T01_9000001146_08439cztM0_level2_quad_clean.evt |
| Size (bytes) | 414,290,880 | 61,804,800 |
| Size | 395.1 MB | 58.9 MB |
| Events in quadrant A | 2,463,193 | 387,437 |
| Events in quadrant B | 2,670,689 | 393,791 |
| Events in quadrant C | 2,322,806 | 386,852 |
| Events in quadrant D | 4,764,140 | 366,711 |
| Mode M9 | |||
|---|---|---|---|
| Quadrant | BADHDUFLAG | Total packets | Discarded packets |
| A | 0 | 12 | 0 |
| B | 0 | 12 | 0 |
| C | 0 | 12 | 0 |
| D | 0 | 12 | 0 |
| Mode SS | |||
|---|---|---|---|
| Quadrant | BADHDUFLAG | Total packets | Discarded packets |
| A | 0 | 98 | 0 |
| B | 0 | 98 | 0 |
| C | 0 | 98 | 0 |
| D | 0 | 98 | 0 |
| Mode M0 | |||
|---|---|---|---|
| Quadrant | BADHDUFLAG | Total packets | Discarded packets |
| A | 0 | 10343 | 1 |
| B | 0 | 10859 | 1 |
| C | 0 | 10064 | 1 |
| D | 0 | 17307 | 1 |
| Quadrant | Total seconds | Saturated seconds | Saturation percentage |
|---|---|---|---|
| A | 4792 | 139 | 2.900668% |
| B | 4792 | 122 | 2.545910% |
| C | 4792 | 81 | 1.690317% |
| D | 4792 | 760 | 15.859766% |
Noise dominated data is calculated using 1-second bins in cleaned event files. If a bin has >2000 counts, and if more than 50% of those come from <1% of pixels, then it is considered to be noise-dominated and hence unusable.
| Quadrant | # 1 sec bins | Bins with >0 counts | Bins with >2000 counts | High rate bins dominated by noise | Noise dominated (total time) | Noise dominated (detector-on time) | Marked lightcurve |
|---|---|---|---|---|---|---|---|
| A | 5997 | 4792 | 4 | 4 | 0.07% | 0.08% | 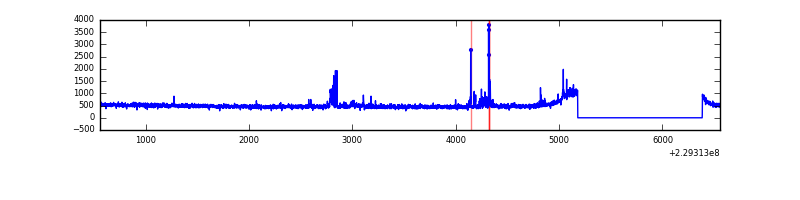 |
| B | 5997 | 4792 | 3 | 3 | 0.05% | 0.06% | 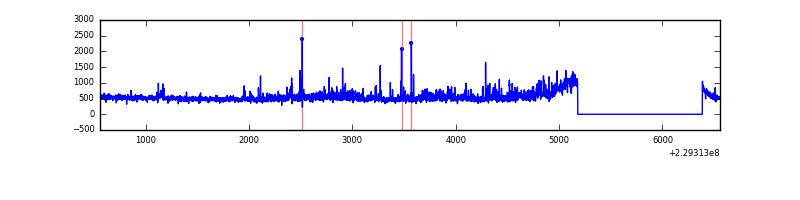 |
| C | 5997 | 4793 | 4 | 4 | 0.07% | 0.08% | 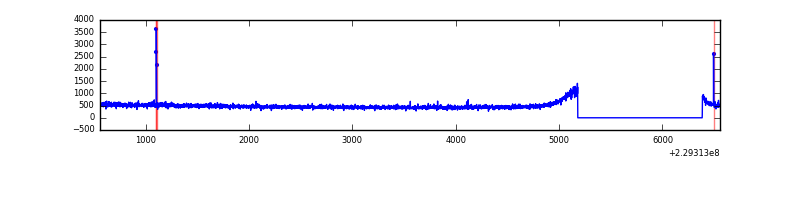 |
| D | 5997 | 4793 | 529 | 529 | 8.82% | 11.04% | 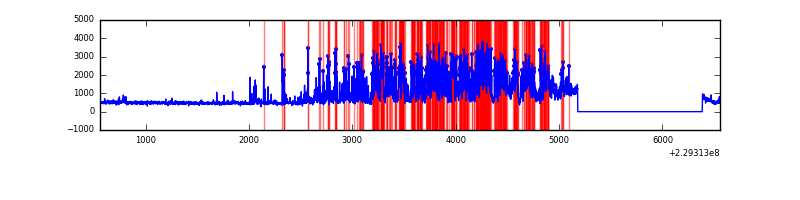 |
Top three noisy pixels from each quadrant. If the there are fewer than three noisy pixels in the level2.evt file, extra rows are filled as -1
| Pixel properties | Quadrant properties | ||||||
|---|---|---|---|---|---|---|---|
| Quadrant | DetID | PixID | Counts | Sigma | Mean | Median | Sigma |
| A | 14 | 111 | 94675 | 763.74 | 608 | 597 | 123.2 |
| A | 13 | 251 | 9232 | 70.1 | 608 | 597 | 123.2 |
| A | 15 | 223 | 6550 | 48.33 | 608 | 597 | 123.2 |
| B | 0 | 214 | 131762 | 1146.31 | 605 | 591 | 114.4 |
| B | 11 | 51 | 104165 | 905.14 | 605 | 591 | 114.4 |
| B | 5 | 255 | 51704 | 446.68 | 605 | 591 | 114.4 |
| C | 13 | 255 | 12529 | 87.49 | 591 | 593 | 136.4 |
| C | 13 | 61 | 6406 | 42.61 | 591 | 593 | 136.4 |
| C | 8 | 222 | 3821 | 23.66 | 591 | 593 | 136.4 |
| D | 2 | 152 | 2373784 | 16909.03 | 573 | 556 | 140.4 |
| D | 1 | 7 | 87045 | 616.23 | 573 | 556 | 140.4 |
| D | 12 | 233 | 64102 | 452.76 | 573 | 556 | 140.4 |
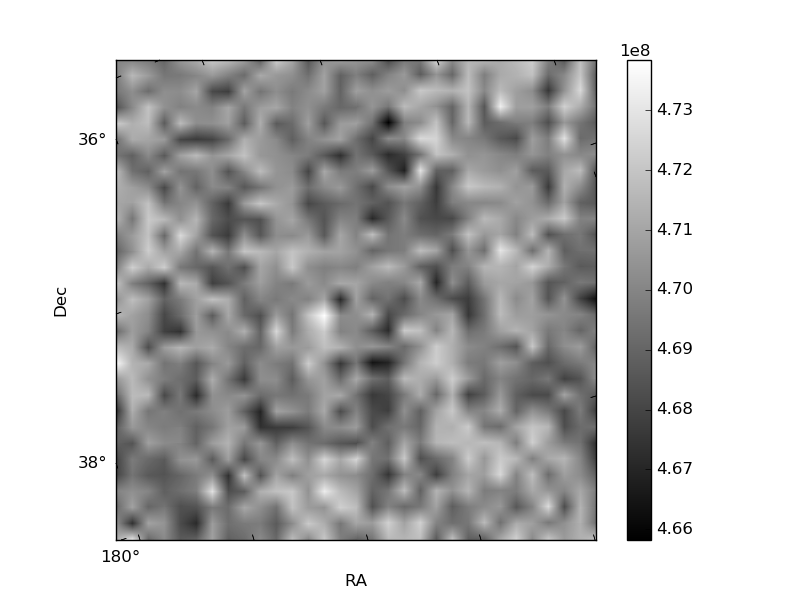
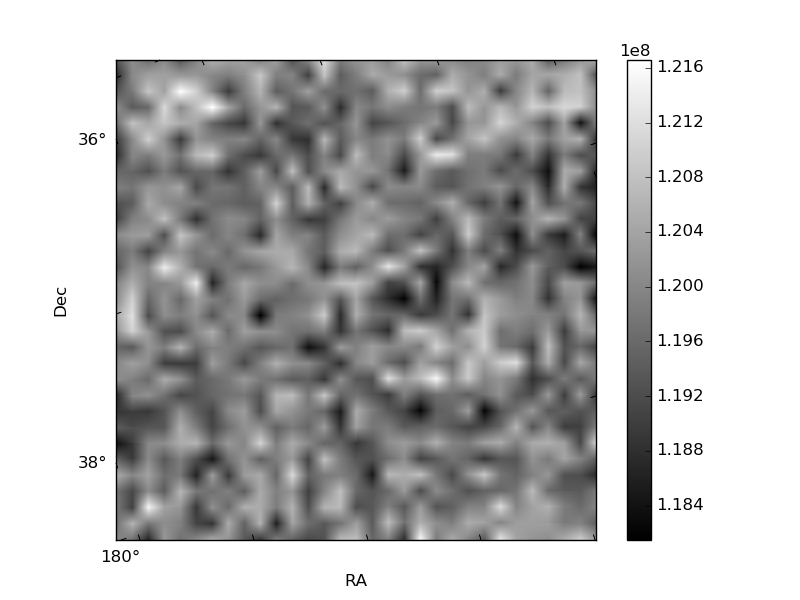
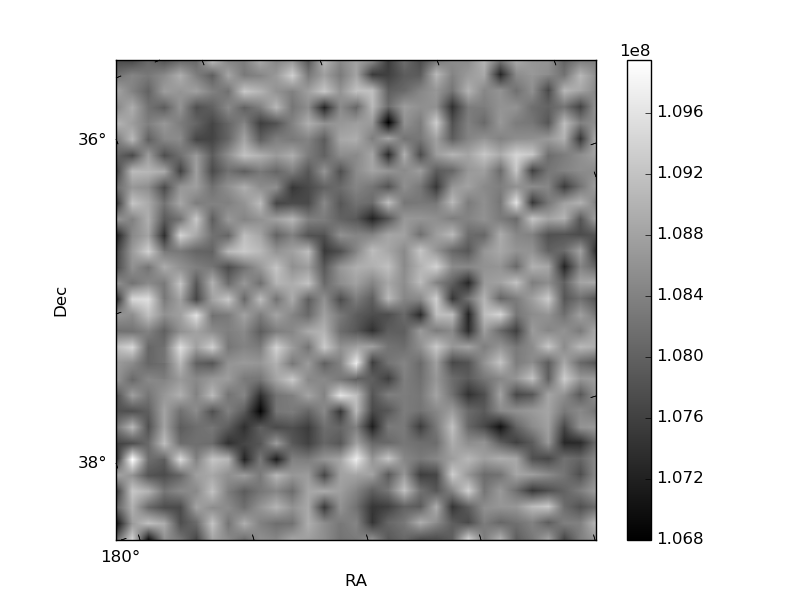
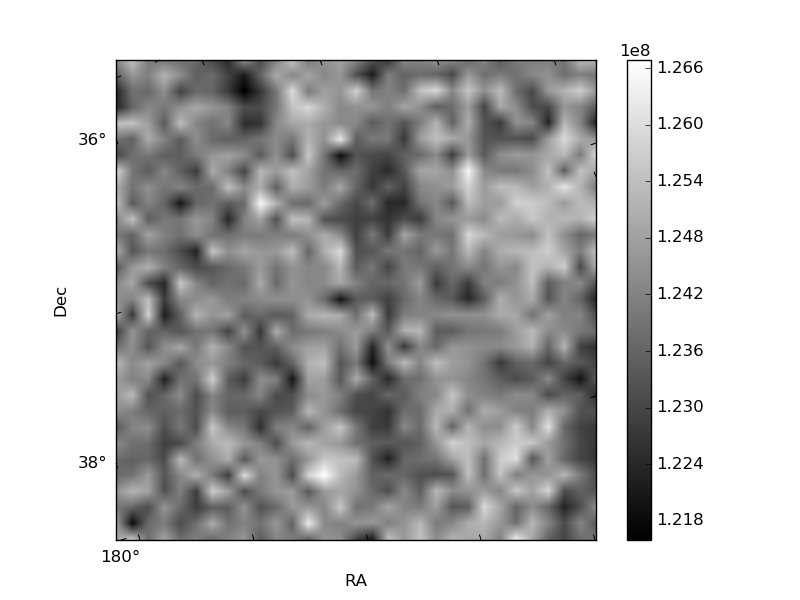
Histogram calculated using DETX and DETY for each event in the final _common_clean file
| Quadrant A | 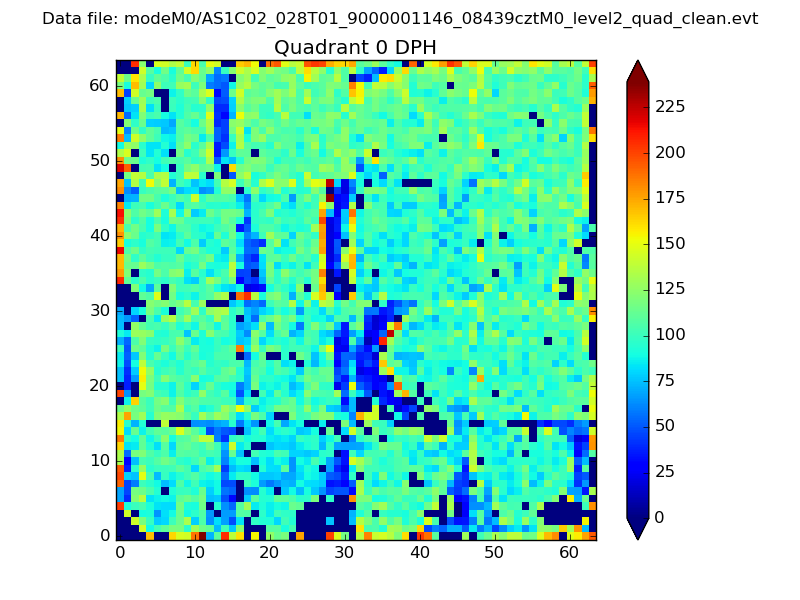 |
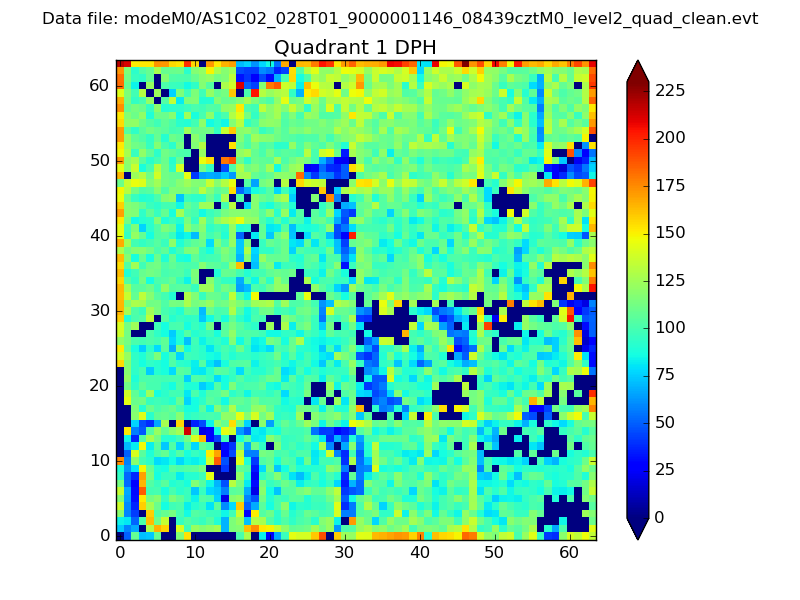 |
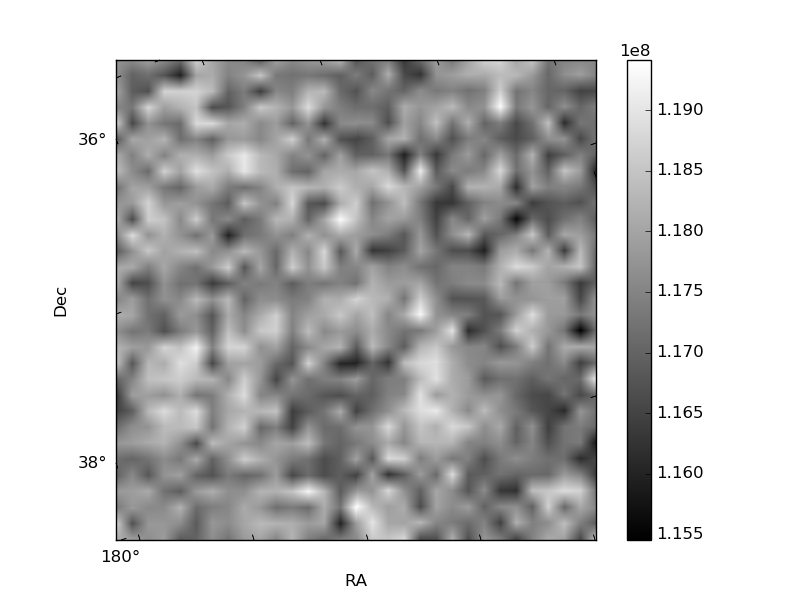
Quadrant B |
|---|---|---|---|
| Quadrant D | 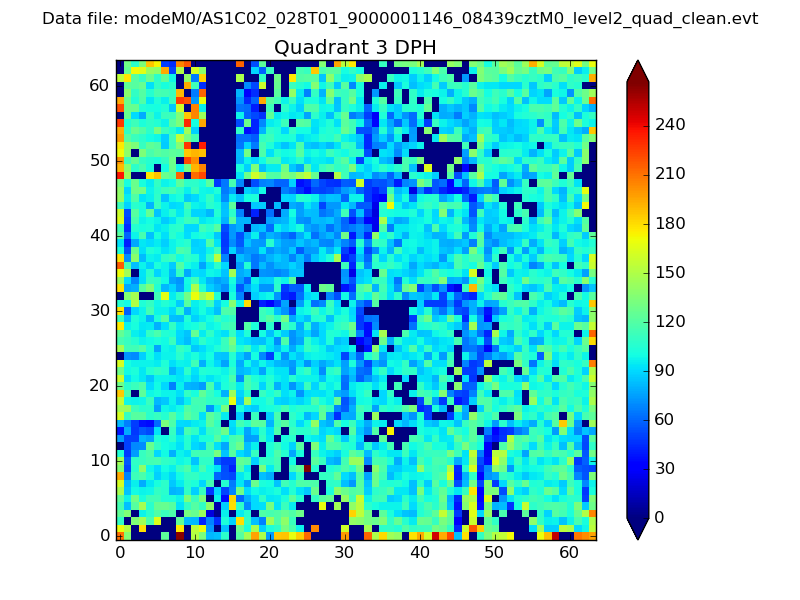 |
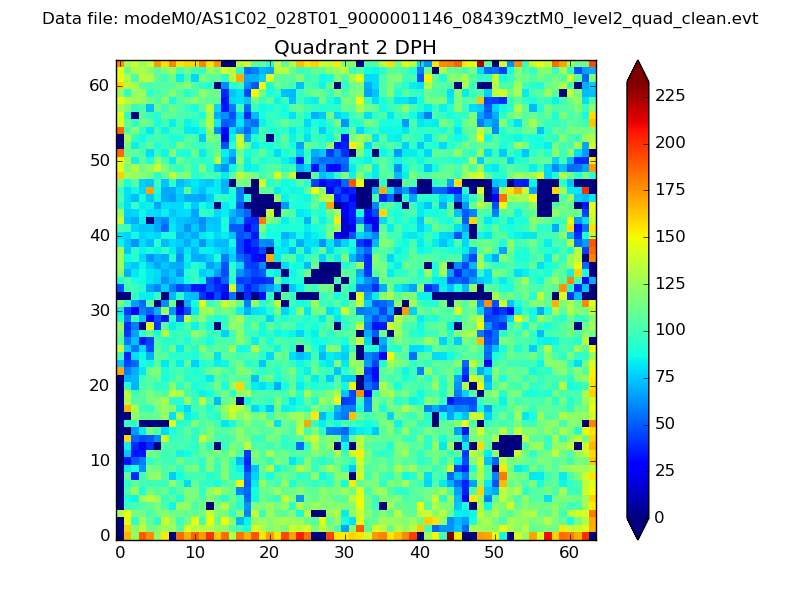 |
Quadrant C |
| Plot type | Count rate plots | Images |
|---|---|---|
| Comparison with Poisson distribution Blue bars denote a histogram of data divided into 1 sec bins. Red curve is a Poisson curve with rate = median count rate of data. |
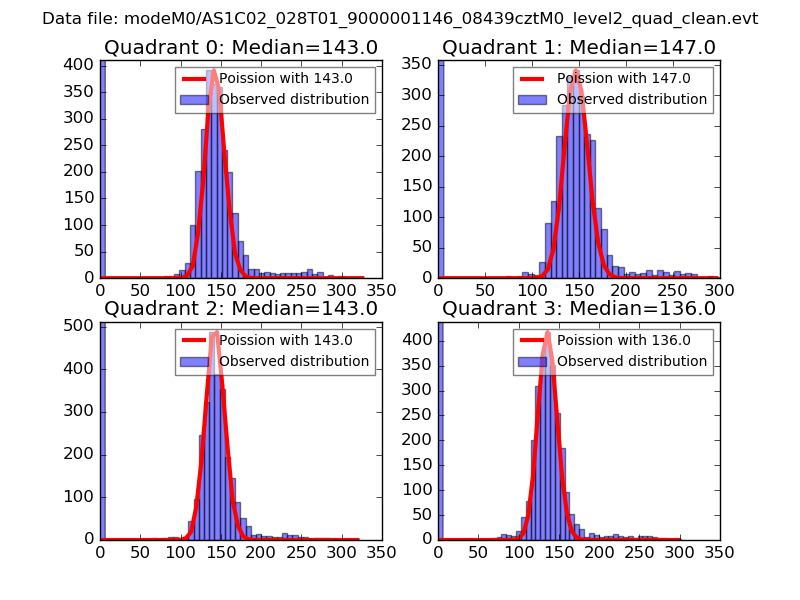 |
 |
| Quadrant-wise count rates Data is divided into 100 sec bins |
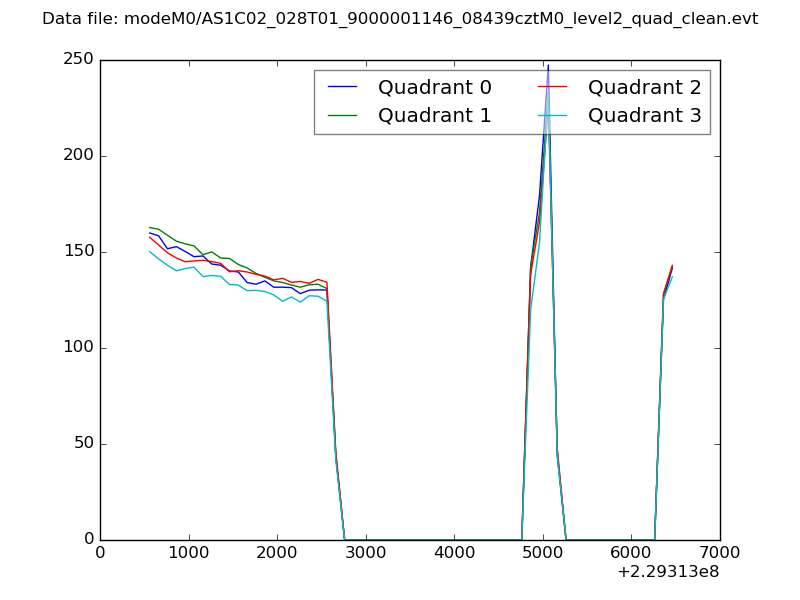 |
|
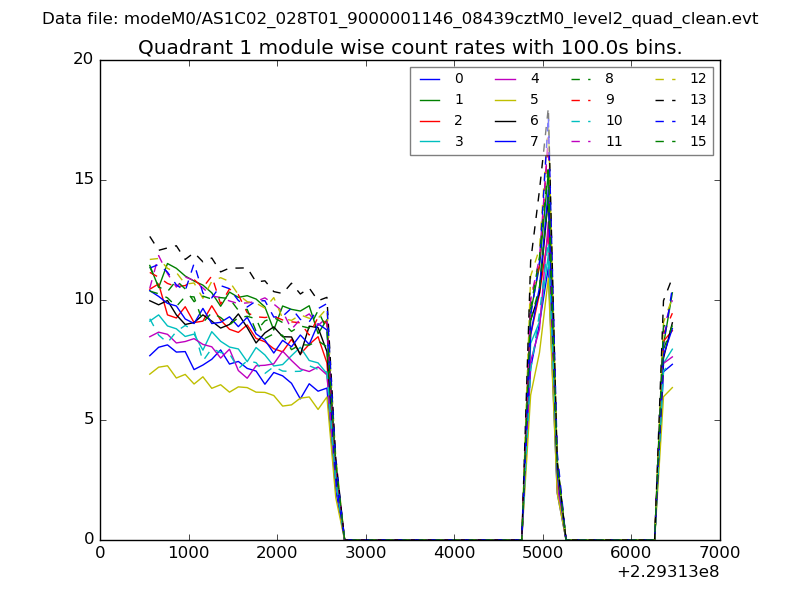
| Module-wise count rates for Quadrant A Data is divided into 100 sec bins |
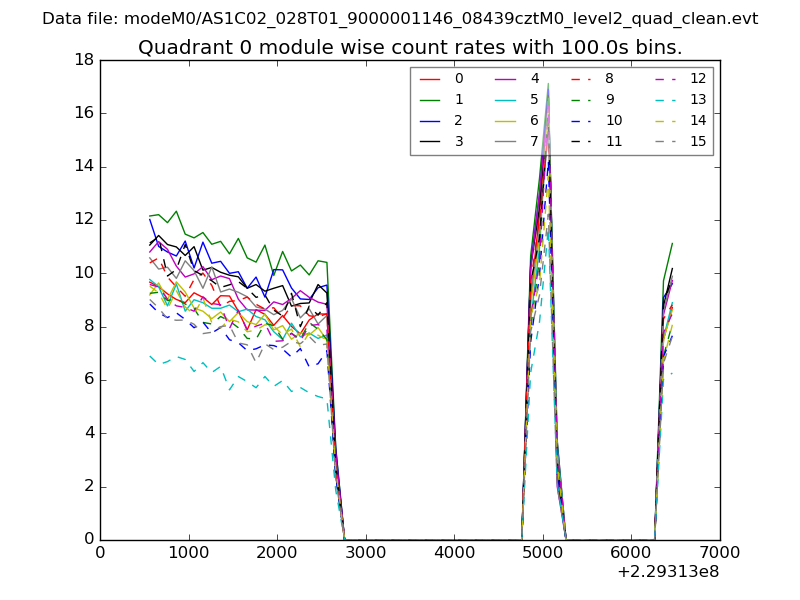 |
 |
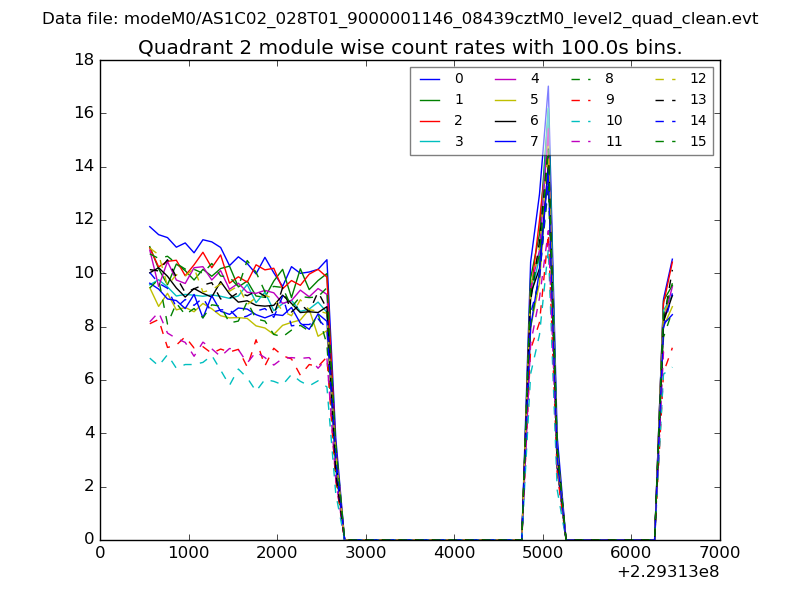
| Module-wise count rates for Quadrant B Data is divided into 100 sec bins |
 |
 |
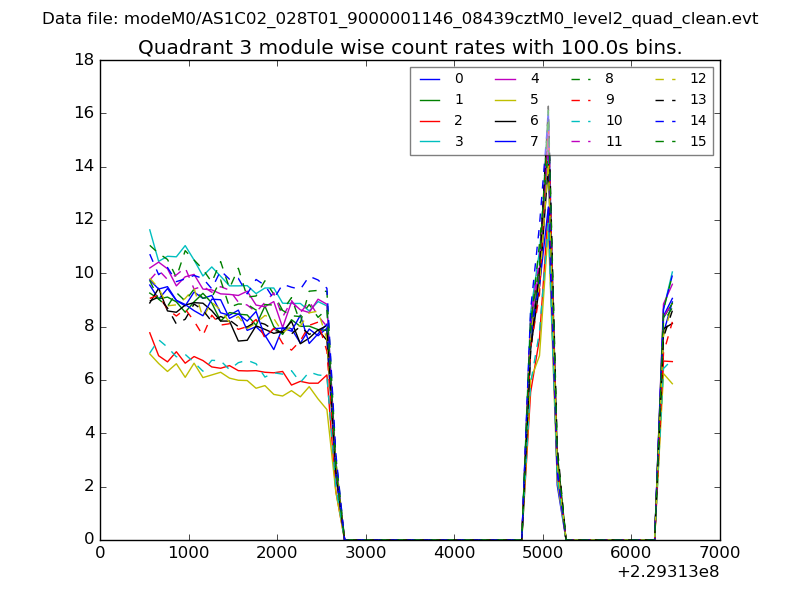
| Module-wise count rates for Quadrant C Data is divided into 100 sec bins |
 |
 |
| Module-wise count rates for Quadrant D Data is divided into 100 sec bins |
 |
 |
| Parameter | Plot |
|---|---|
| CZT HV Monitor | 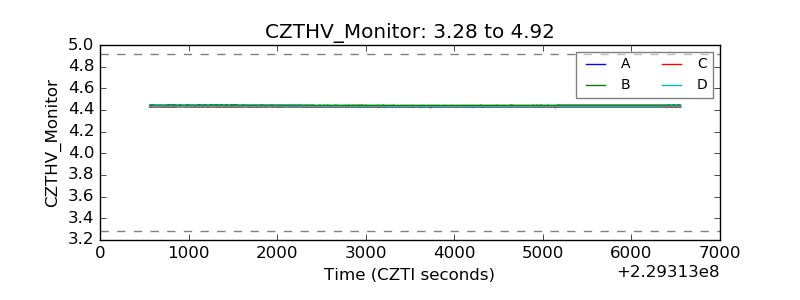 |
| D_VDD | 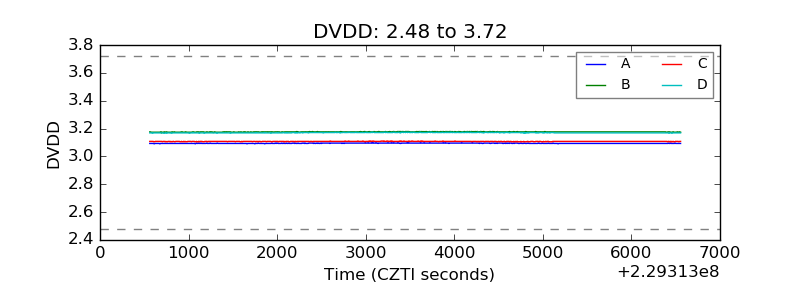 |
| Temperature 1 | 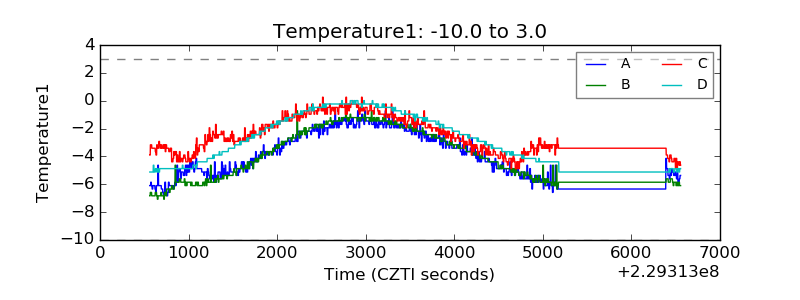 |
| Veto HV Monitor | 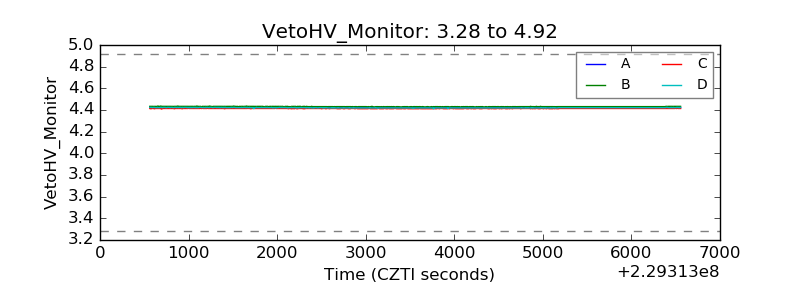 |
| Veto LLD | 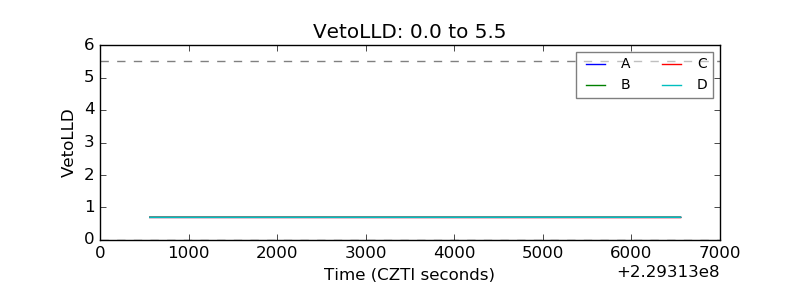 |
| Alpha Counter | 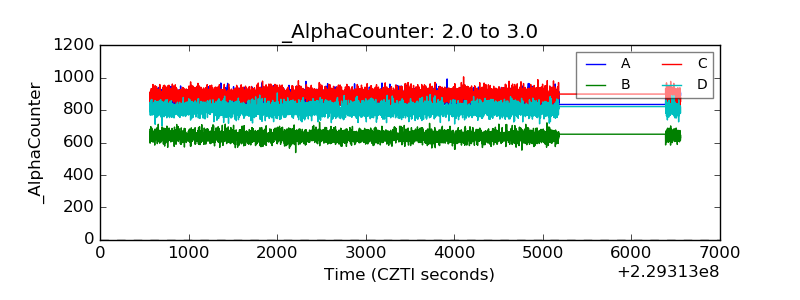 |
| _CPM_Rate | 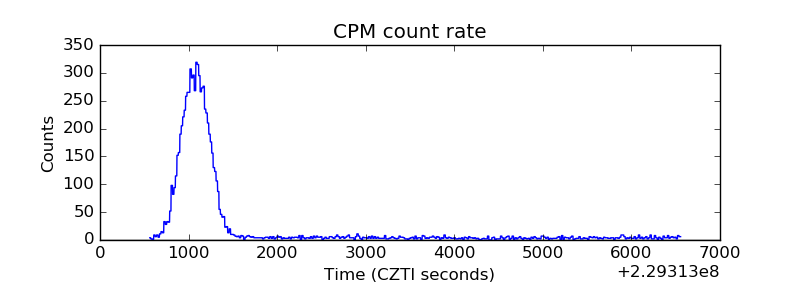 |
| CZT Counter | 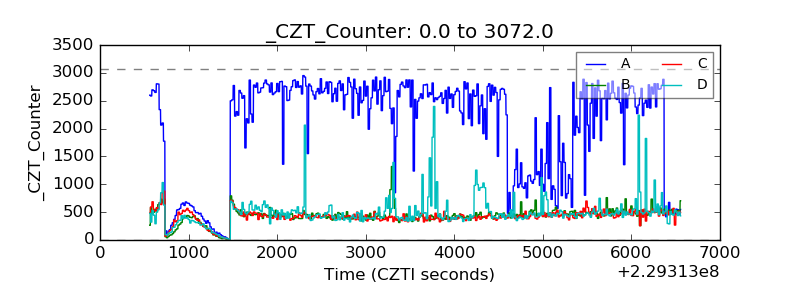 |
| +2.5 Volts monitor |  |
| +5 Volts monitor |  |
| _ROLL_ROT | 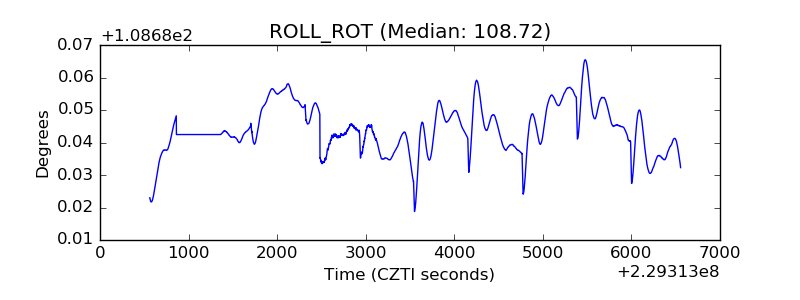 |
| _Roll_DEC | 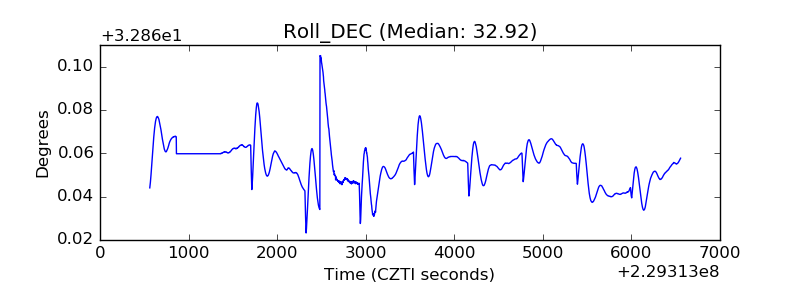 |
| _Roll_RA | 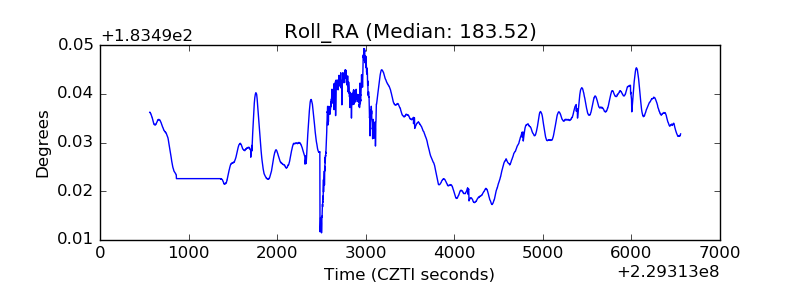 |
| Veto Counter | 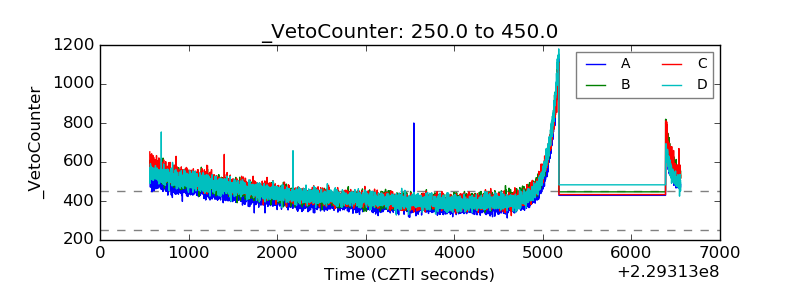 |