| Param | Original file | Final file |
|---|---|---|
| Filename | modeM0/AS1G07_086T02_9000001144_08251cztM0_level2.evt | modeM0/AS1G07_086T02_9000001144_08251cztM0_level2_quad_clean.evt |
| Size (bytes) | 183,049,920 | 32,875,200 |
| Size | 174.6 MB | 31.4 MB |
| Events in quadrant A | 1,338,294 | 204,983 |
| Events in quadrant B | 1,410,717 | 207,646 |
| Events in quadrant C | 1,311,601 | 202,014 |
| Events in quadrant D | 1,306,611 | 196,527 |
| Mode SS | |||
|---|---|---|---|
| Quadrant | BADHDUFLAG | Total packets | Discarded packets |
| A | 0 | 52 | 0 |
| B | 0 | 52 | 0 |
| C | 0 | 52 | 0 |
| D | 0 | 52 | 0 |
| Mode M0 | |||
|---|---|---|---|
| Quadrant | BADHDUFLAG | Total packets | Discarded packets |
| A | 0 | 5541 | 5 |
| B | 0 | 5724 | 4 |
| C | 0 | 5496 | 3 |
| D | 0 | 5552 | 1 |
| Mode M9 | |||
|---|---|---|---|
| Quadrant | BADHDUFLAG | Total packets | Discarded packets |
| A | 0 | 12 | 0 |
| B | 0 | 12 | 0 |
| C | 0 | 12 | 0 |
| D | 0 | 12 | 0 |
| Quadrant | Total seconds | Saturated seconds | Saturation percentage |
|---|---|---|---|
| A | 2568 | 129 | 5.023364% |
| B | 2568 | 138 | 5.373832% |
| C | 2568 | 97 | 3.777259% |
| D | 2569 | 110 | 4.281822% |
Noise dominated data is calculated using 1-second bins in cleaned event files. If a bin has >2000 counts, and if more than 50% of those come from <1% of pixels, then it is considered to be noise-dominated and hence unusable.
| Quadrant | # 1 sec bins | Bins with >0 counts | Bins with >2000 counts | High rate bins dominated by noise | Noise dominated (total time) | Noise dominated (detector-on time) | Marked lightcurve |
|---|---|---|---|---|---|---|---|
| A | 3714 | 2569 | 0 | 0 | 0.00% | 0.00% |  |
| B | 3714 | 2569 | 5 | 5 | 0.13% | 0.19% | 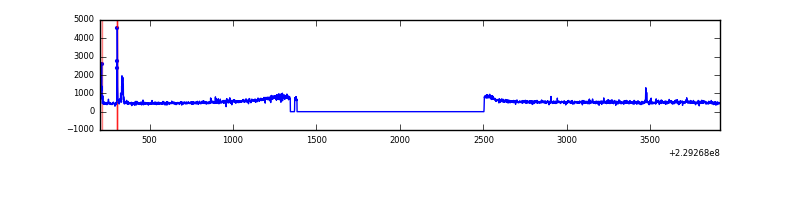 |
| C | 3714 | 2570 | 0 | 0 | 0.00% | 0.00% | 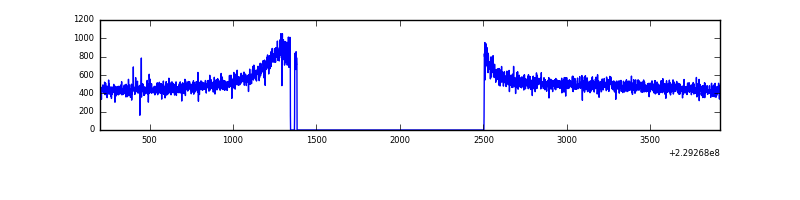 |
| D | 3714 | 2569 | 3 | 3 | 0.08% | 0.12% | 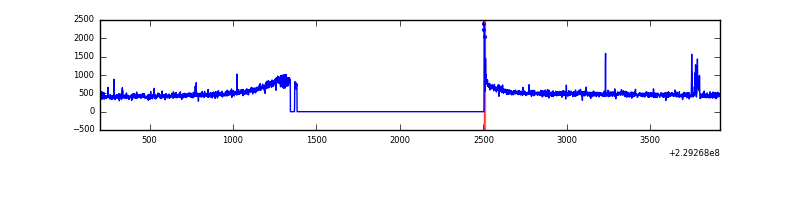 |
Top three noisy pixels from each quadrant. If the there are fewer than three noisy pixels in the level2.evt file, extra rows are filled as -1
| Pixel properties | Quadrant properties | ||||||
|---|---|---|---|---|---|---|---|
| Quadrant | DetID | PixID | Counts | Sigma | Mean | Median | Sigma |
| A | 8 | 15 | 4098 | 51.35 | 346 | 337 | 73.2 |
| A | 12 | 194 | 3255 | 39.84 | 346 | 337 | 73.2 |
| A | 0 | 226 | 3187 | 38.91 | 346 | 337 | 73.2 |
| B | 10 | 16 | 44879 | 651.54 | 345 | 337 | 68.4 |
| B | 0 | 214 | 16916 | 242.51 | 345 | 337 | 68.4 |
| B | 12 | 111 | 7236 | 100.91 | 345 | 337 | 68.4 |
| C | 13 | 61 | 2579 | 28.53 | 335 | 335 | 78.6 |
| C | 12 | 4 | 2166 | 23.28 | 335 | 335 | 78.6 |
| C | 3 | 202 | 797 | 5.87 | 335 | 335 | 78.6 |
| D | 13 | 105 | 13643 | 150.34 | 336 | 327 | 88.6 |
| D | 3 | 14 | 10333 | 112.97 | 336 | 327 | 88.6 |
| D | 2 | 234 | 8702 | 94.55 | 336 | 327 | 88.6 |
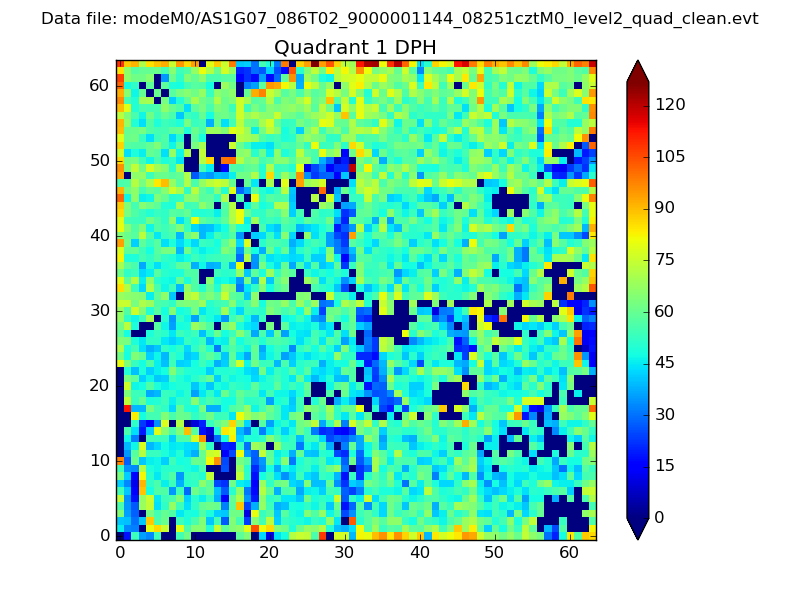
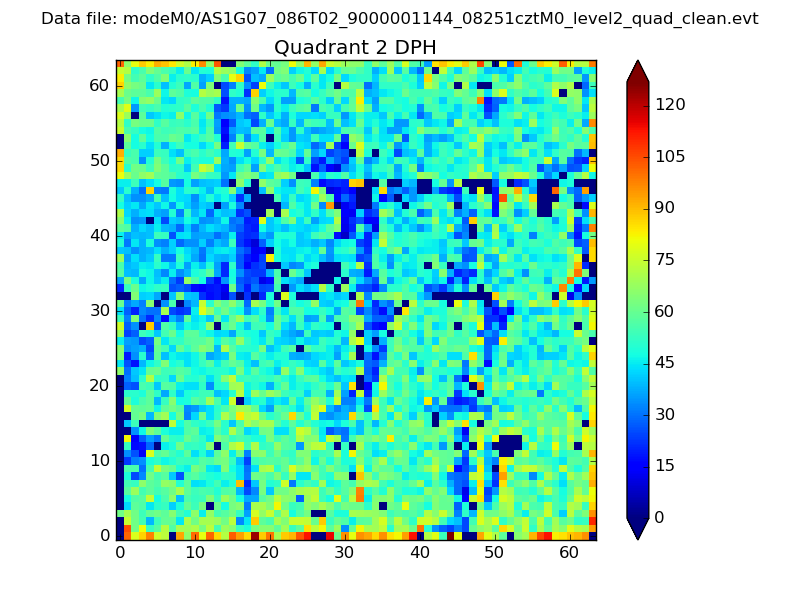
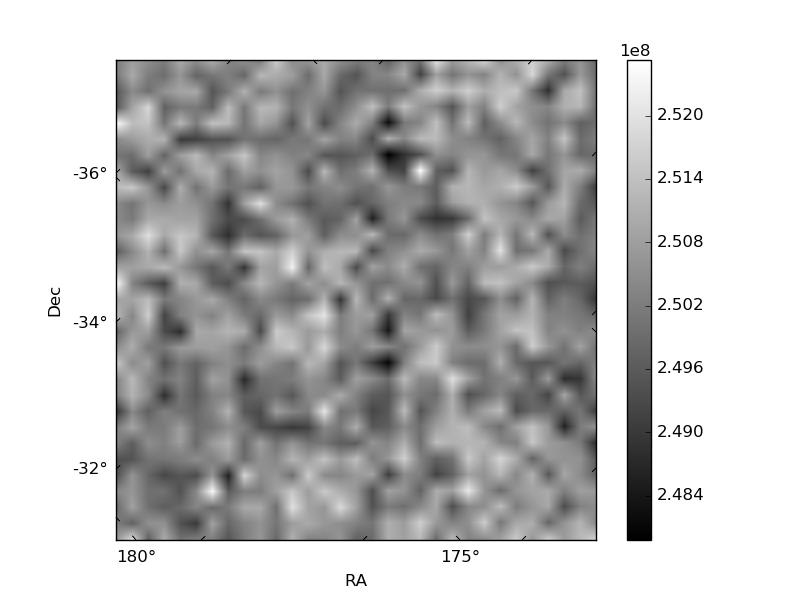
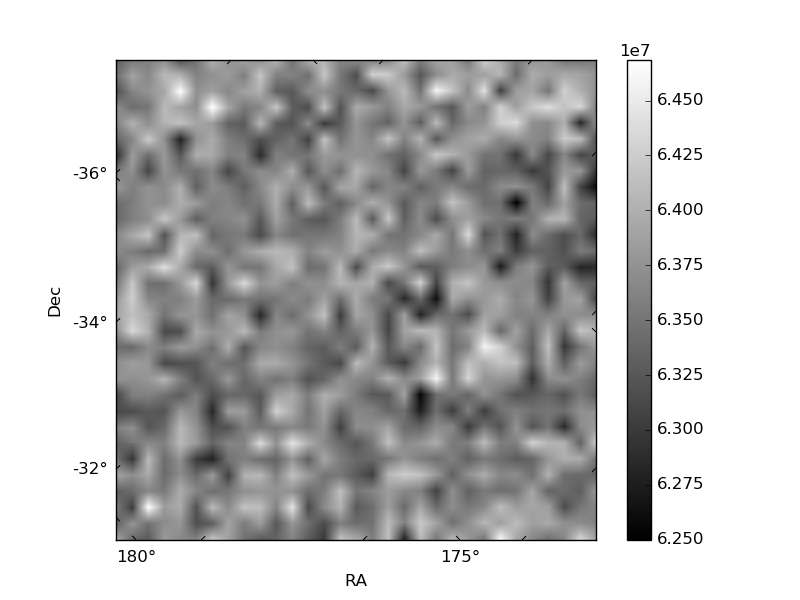
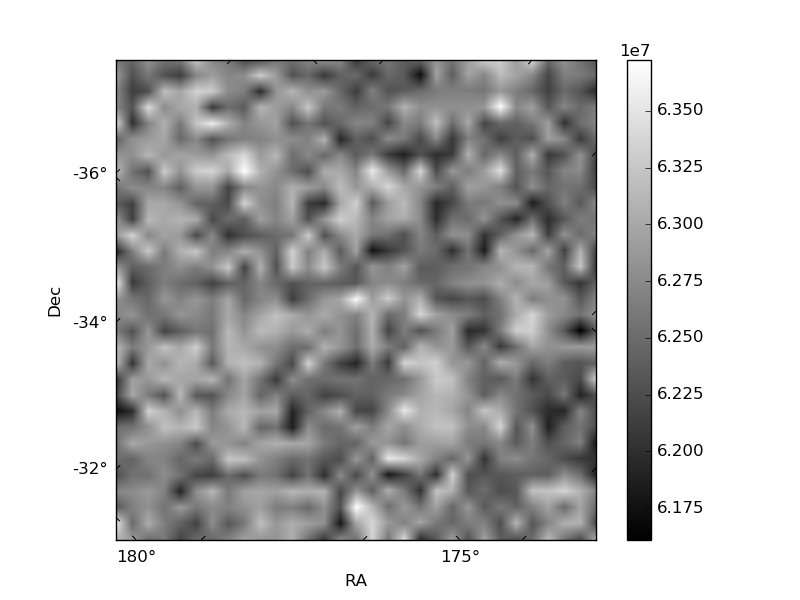
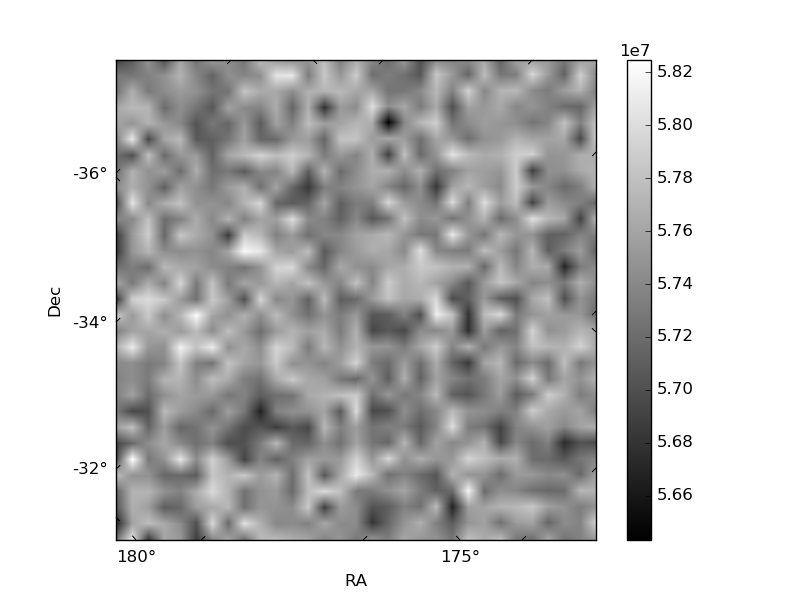
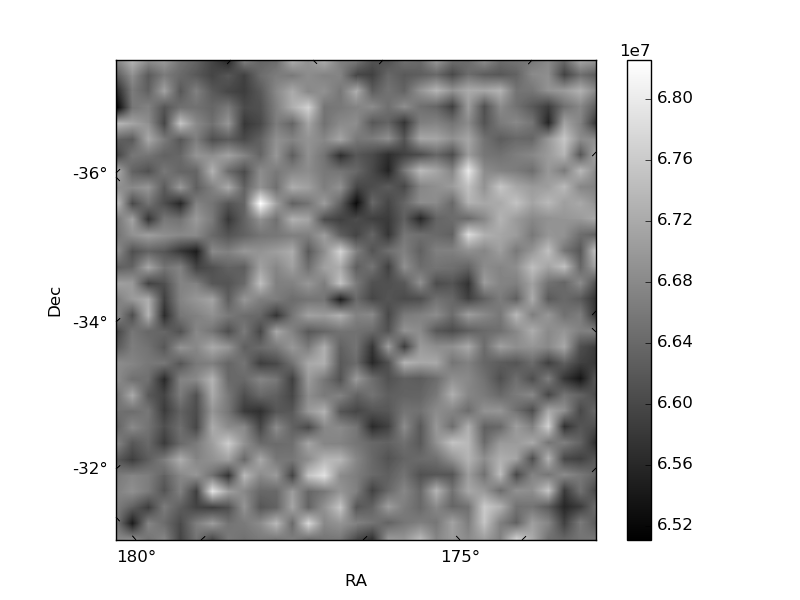
Histogram calculated using DETX and DETY for each event in the final _common_clean file
| Quadrant A | 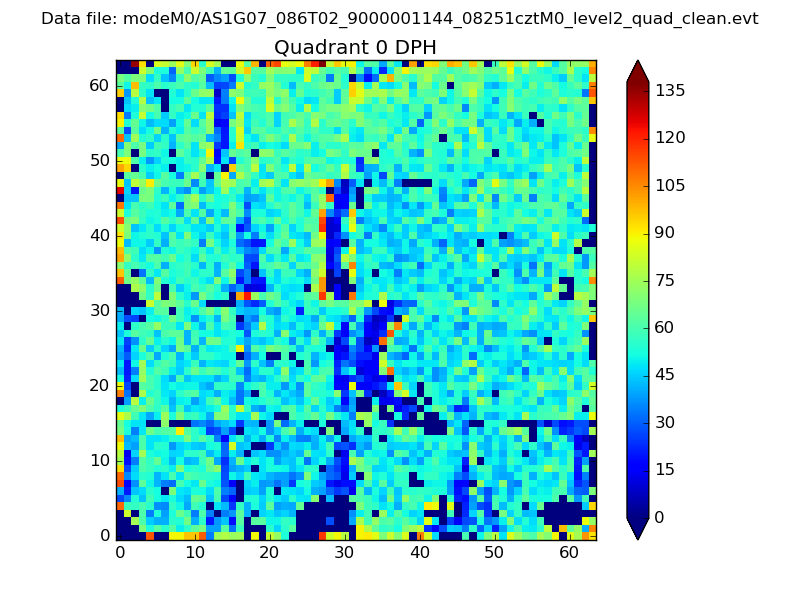 |
 |
Quadrant B |
|---|---|---|---|
| Quadrant D | 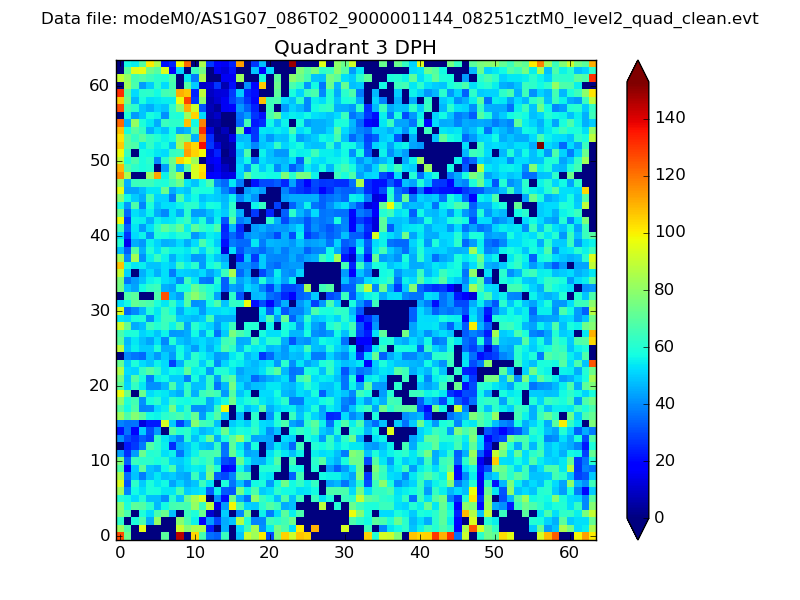 |
 |
Quadrant C |
| Plot type | Count rate plots | Images |
|---|---|---|
| Comparison with Poisson distribution Blue bars denote a histogram of data divided into 1 sec bins. Red curve is a Poisson curve with rate = median count rate of data. |
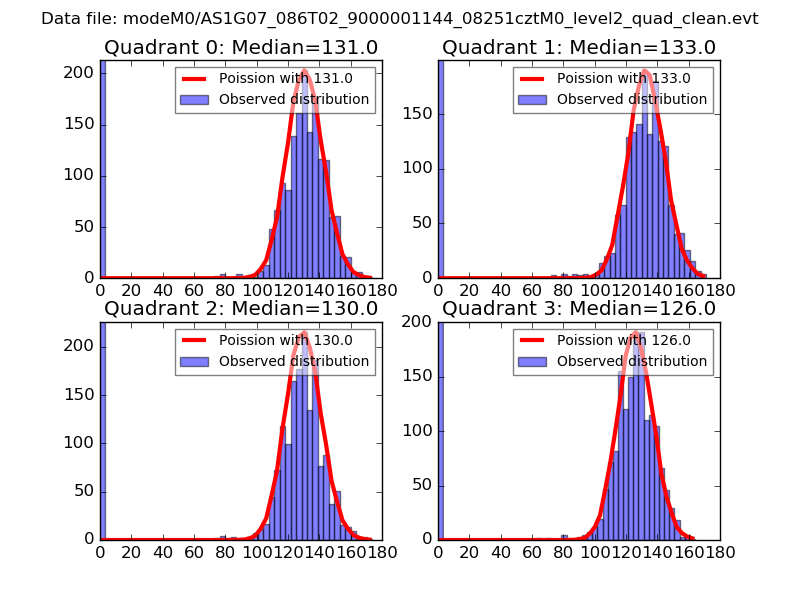 |
 |
| Quadrant-wise count rates Data is divided into 100 sec bins |
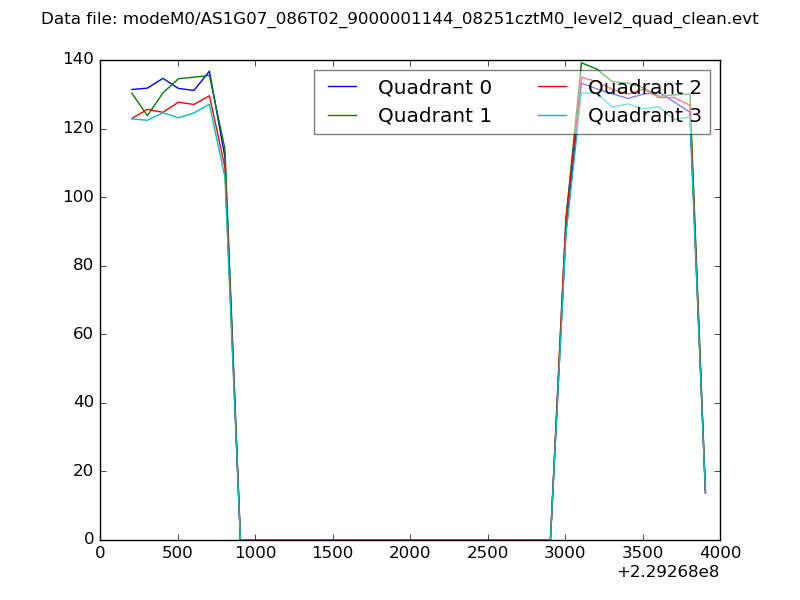 |
|
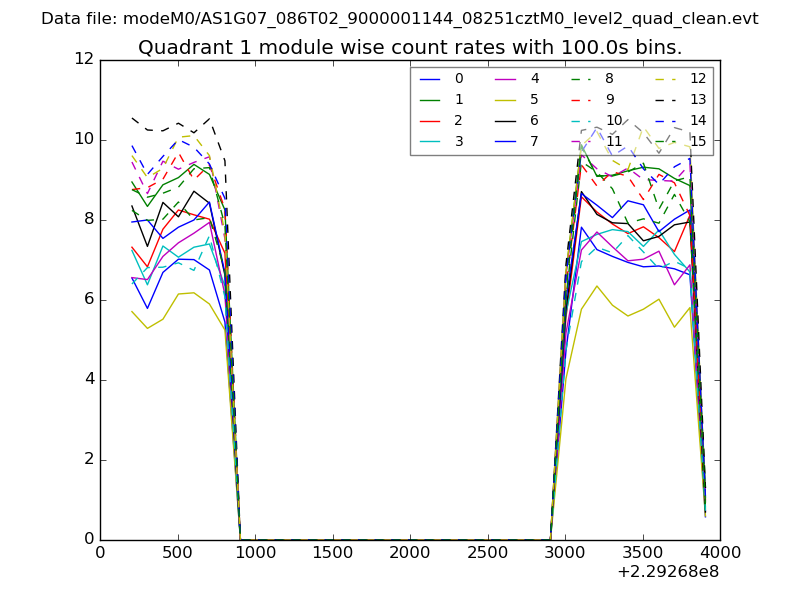
| Module-wise count rates for Quadrant A Data is divided into 100 sec bins |
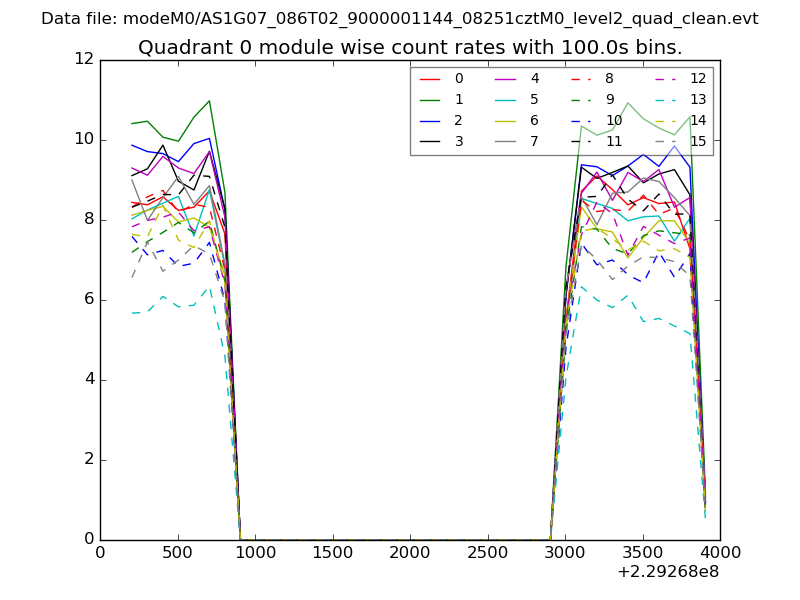 |
 |
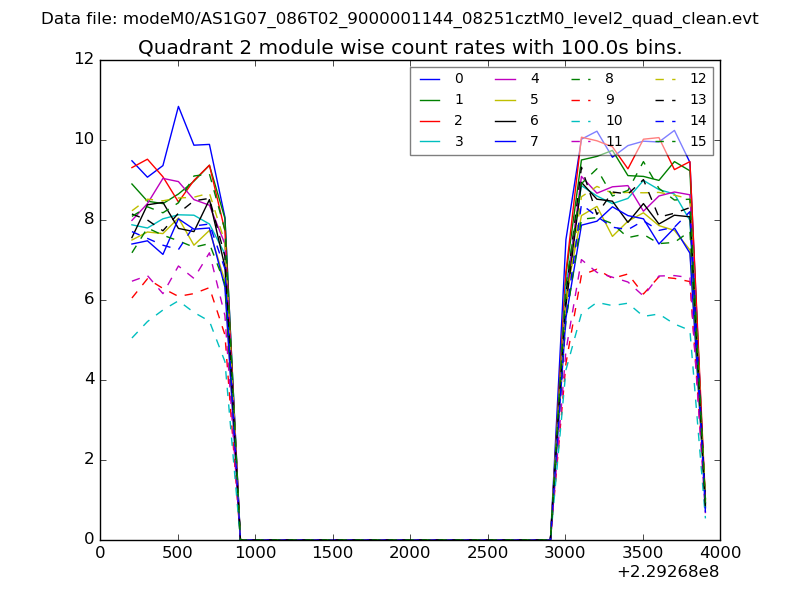
| Module-wise count rates for Quadrant B Data is divided into 100 sec bins |
 |
 |
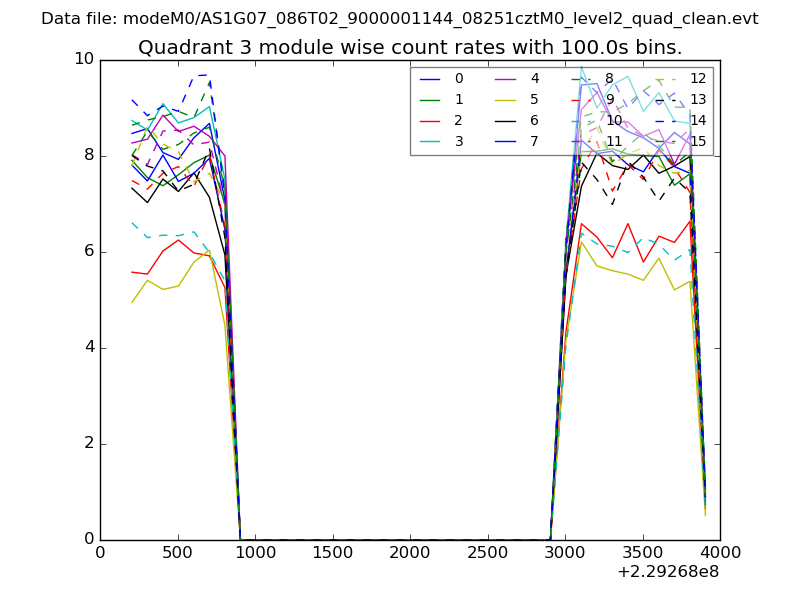
| Module-wise count rates for Quadrant C Data is divided into 100 sec bins |
 |
 |
| Module-wise count rates for Quadrant D Data is divided into 100 sec bins |
 |
 |
| Parameter | Plot |
|---|---|
| CZT HV Monitor | 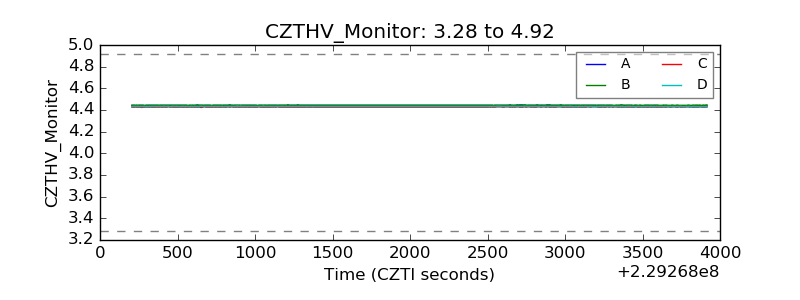 |
| D_VDD | 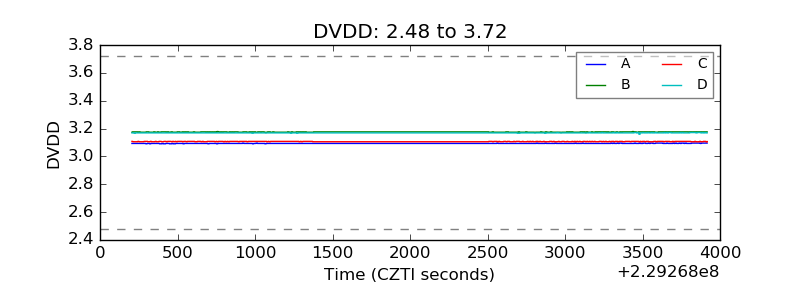 |
| Temperature 1 | 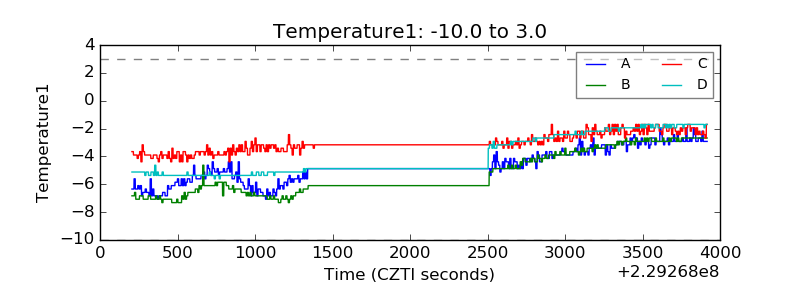 |
| Veto HV Monitor | 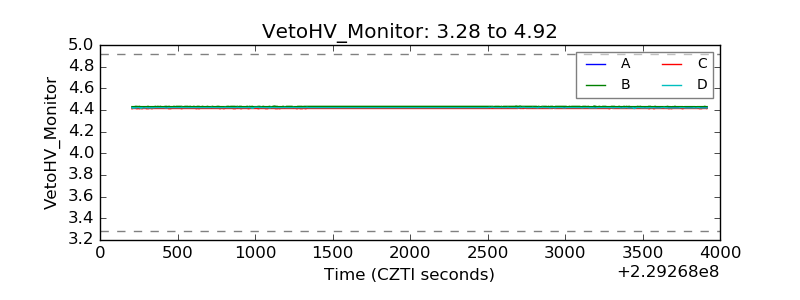 |
| Veto LLD | 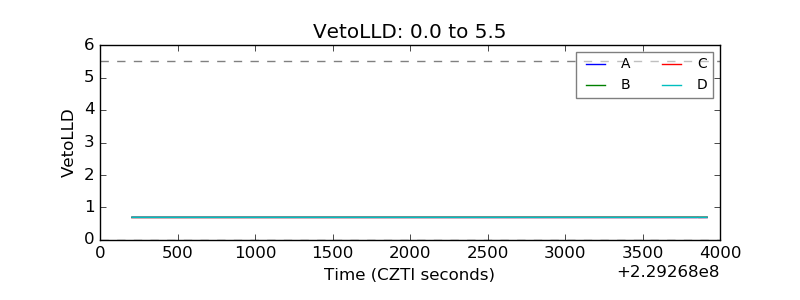 |
| Alpha Counter | 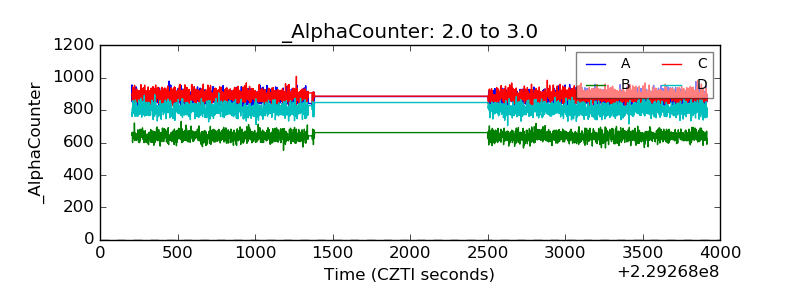 |
| _CPM_Rate | 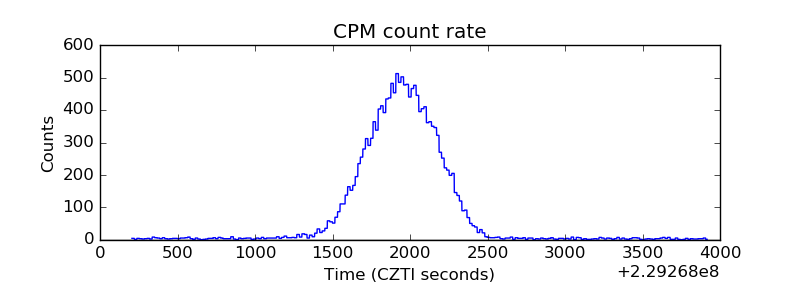 |
| CZT Counter | 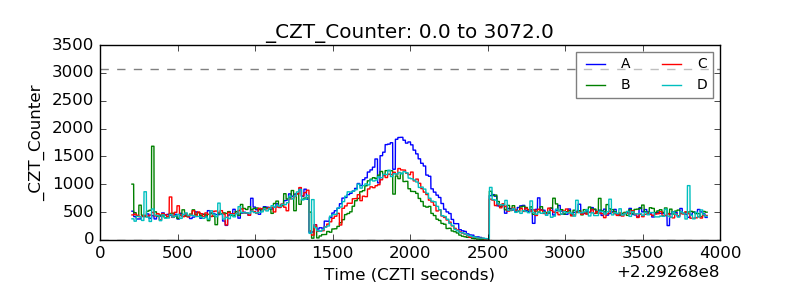 |
| +2.5 Volts monitor |  |
| +5 Volts monitor | 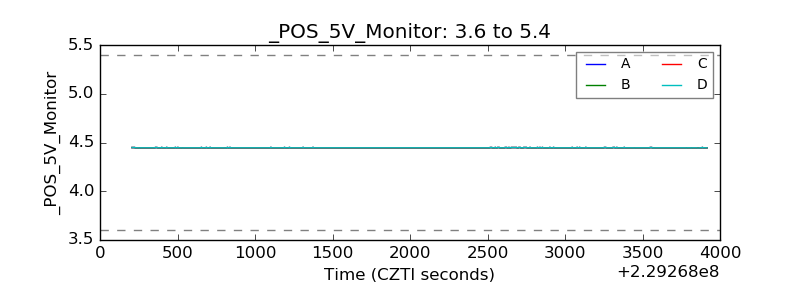 |
| _ROLL_ROT | 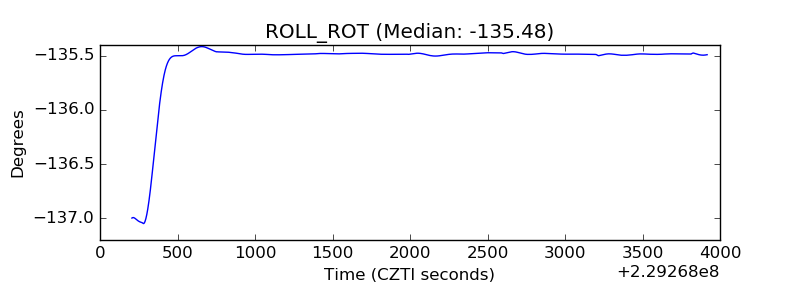 |
| _Roll_DEC | 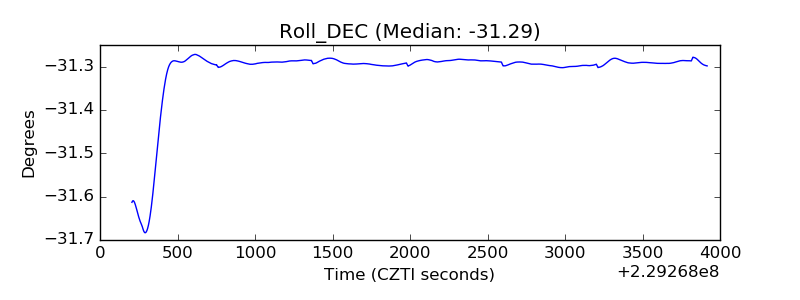 |
| _Roll_RA | 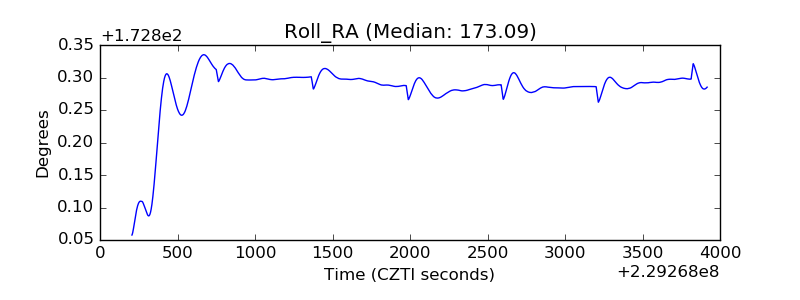 |
| Veto Counter | 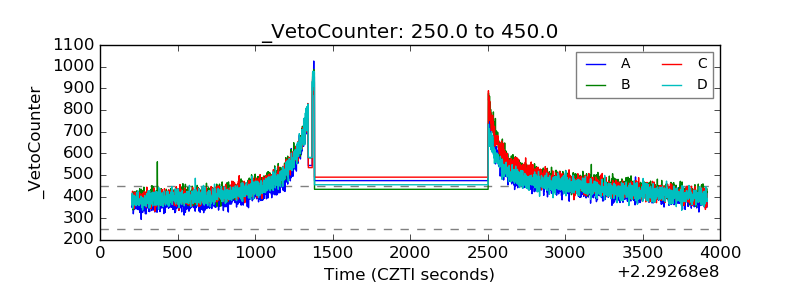 |