| Param | Original file | Final file |
|---|---|---|
| Filename | modeM0/AS1G07_086T02_9000001144_08258cztM0_level2.evt | modeM0/AS1G07_086T02_9000001144_08258cztM0_level2_quad_clean.evt |
| Size (bytes) | 33,658,560 | 3,988,800 |
| Size | 32.1 MB | 3.8 MB |
| Events in quadrant A | 522,832 | 4,321 |
| Events in quadrant B | 163,269 | 30,880 |
| Events in quadrant C | 158,414 | 31,605 |
| Events in quadrant D | 156,593 | 29,914 |
| Mode SS | |||
|---|---|---|---|
| Quadrant | BADHDUFLAG | Total packets | Discarded packets |
| A | 0 | 6 | 0 |
| B | 0 | 6 | 0 |
| C | 0 | 6 | 0 |
| D | 0 | 6 | 0 |
| Mode M0 | |||
|---|---|---|---|
| Quadrant | BADHDUFLAG | Total packets | Discarded packets |
| A | 0 | 1703 | 1 |
| B | 0 | 647 | 0 |
| C | 0 | 631 | 0 |
| D | 0 | 621 | 0 |
| Mode M9 | |||
|---|---|---|---|
| Quadrant | BADHDUFLAG | Total packets | Discarded packets |
| A | 0 | 2 | 0 |
| B | 0 | 2 | 0 |
| C | 0 | 2 | 0 |
| D | 0 | 2 | 0 |
| Quadrant | Total seconds | Saturated seconds | Saturation percentage |
|---|---|---|---|
| A | 216 | 215 | 99.537037% |
| B | 216 | 58 | 26.851852% |
| C | 216 | 15 | 6.944444% |
| D | 216 | 15 | 6.944444% |
Noise dominated data is calculated using 1-second bins in cleaned event files. If a bin has >2000 counts, and if more than 50% of those come from <1% of pixels, then it is considered to be noise-dominated and hence unusable.
| Quadrant | # 1 sec bins | Bins with >0 counts | Bins with >2000 counts | High rate bins dominated by noise | Noise dominated (total time) | Noise dominated (detector-on time) | Marked lightcurve |
|---|---|---|---|---|---|---|---|
| A | 410 | 215 | 198 | 198 | 48.29% | 92.09% | 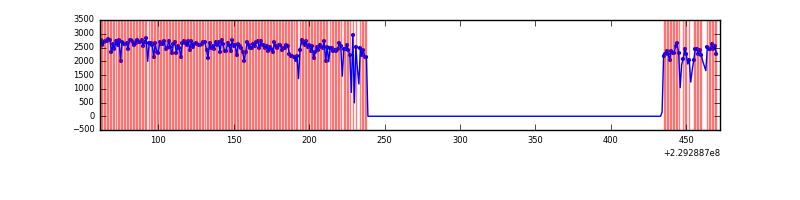 |
| B | 411 | 217 | 0 | 0 | 0.00% | 0.00% | 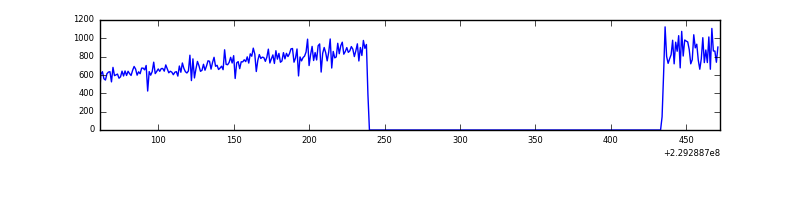 |
| C | 411 | 217 | 0 | 0 | 0.00% | 0.00% | 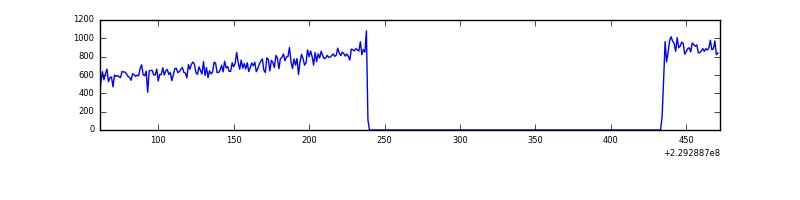 |
| D | 411 | 217 | 1 | 1 | 0.24% | 0.46% | 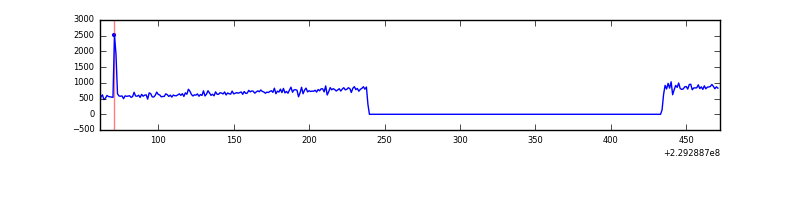 |
Top three noisy pixels from each quadrant. If the there are fewer than three noisy pixels in the level2.evt file, extra rows are filled as -1
| Pixel properties | Quadrant properties | ||||||
|---|---|---|---|---|---|---|---|
| Quadrant | DetID | PixID | Counts | Sigma | Mean | Median | Sigma |
| A | 0 | 128 | 486142 | 136515.27 | 8 | 8 | 3.6 |
| A | 12 | 194 | 80 | 20.22 | 8 | 8 | 3.6 |
| A | 0 | 226 | 79 | 19.94 | 8 | 8 | 3.6 |
| B | 0 | 214 | 1601 | 139.58 | 41 | 39 | 11.2 |
| B | 12 | 111 | 1054 | 90.7 | 41 | 39 | 11.2 |
| B | 11 | 111 | 783 | 66.49 | 41 | 39 | 11.2 |
| C | 7 | 159 | 452 | 35.06 | 40 | 40 | 11.8 |
| C | 13 | 61 | 296 | 21.78 | 40 | 40 | 11.8 |
| C | 8 | 112 | 112 | 6.13 | 40 | 40 | 11.8 |
| D | 7 | 55 | 3649 | 293.74 | 40 | 38 | 12.3 |
| D | 2 | 234 | 619 | 47.26 | 40 | 38 | 12.3 |
| D | 1 | 52 | 449 | 33.43 | 40 | 38 | 12.3 |
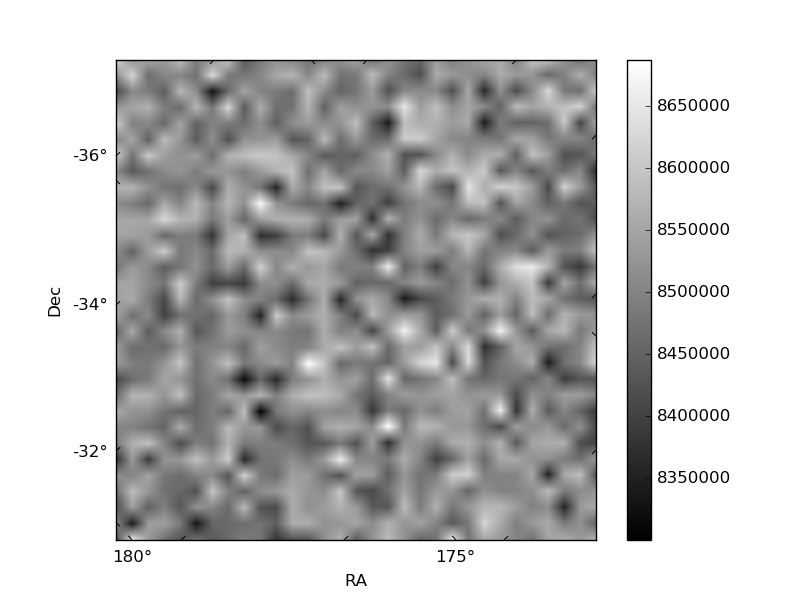
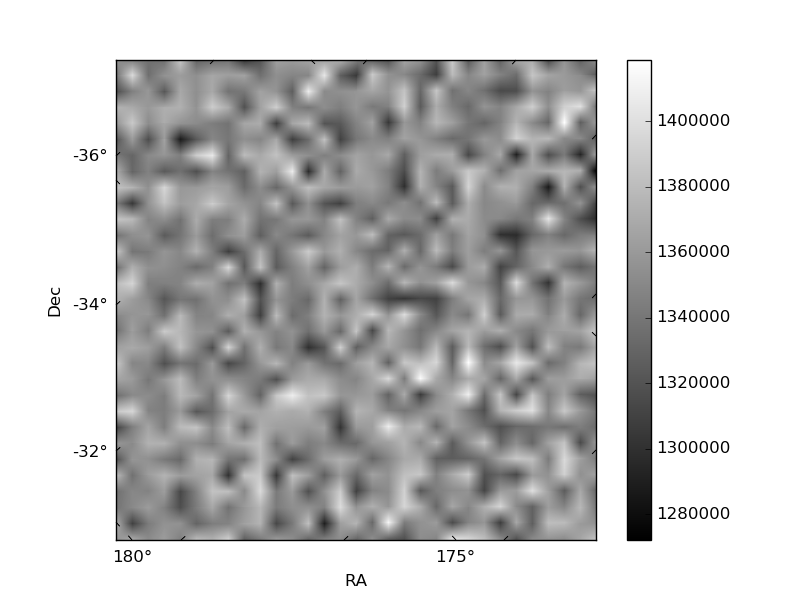
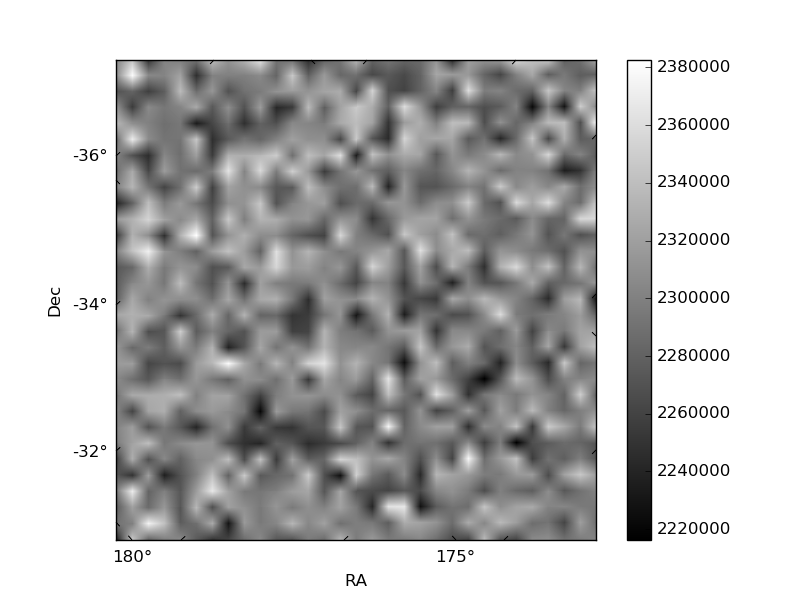
Histogram calculated using DETX and DETY for each event in the final _common_clean file
| Quadrant A | 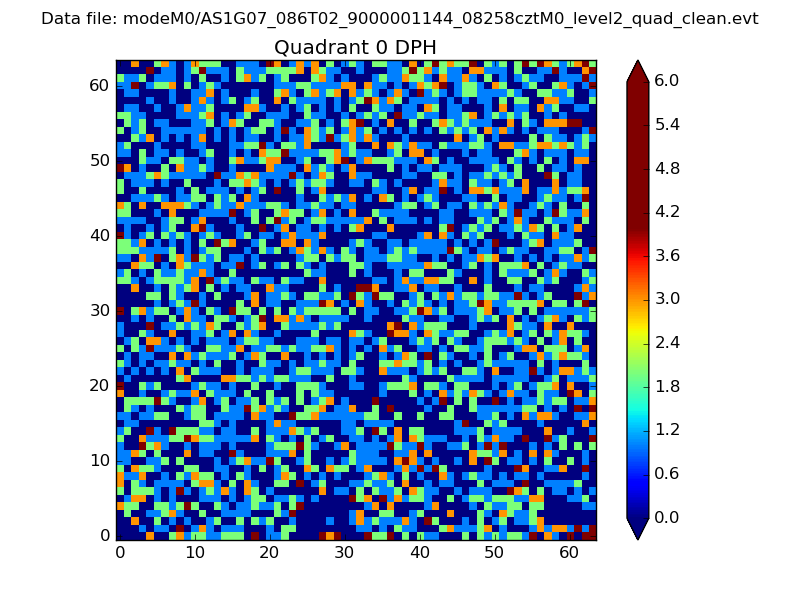 |
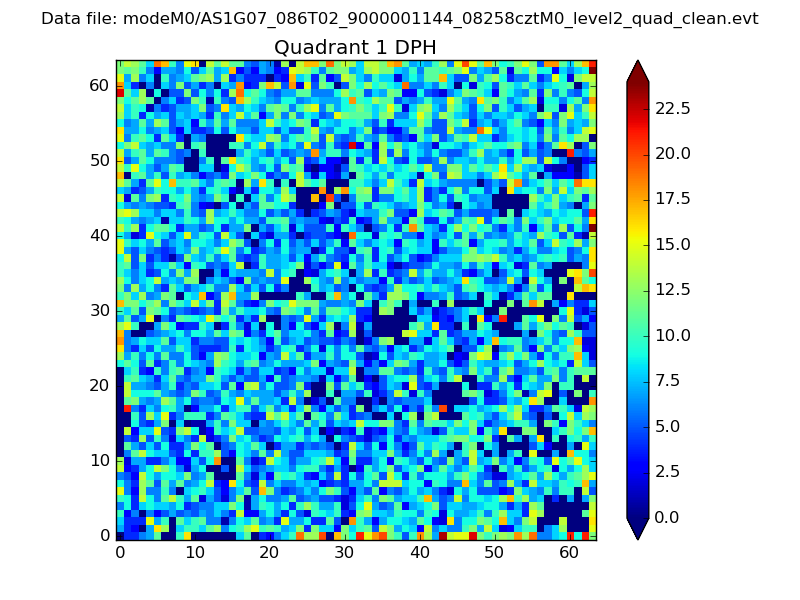 |
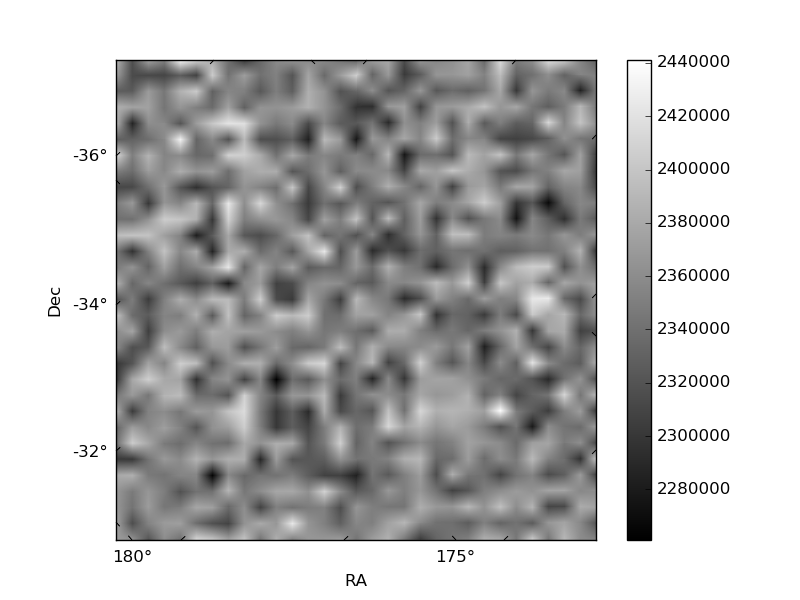
Quadrant B |
|---|---|---|---|
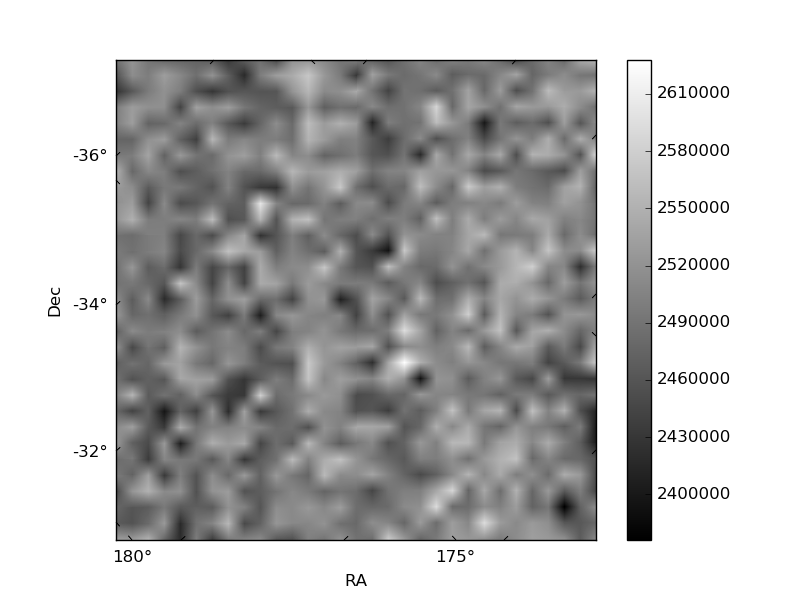
| Quadrant D | 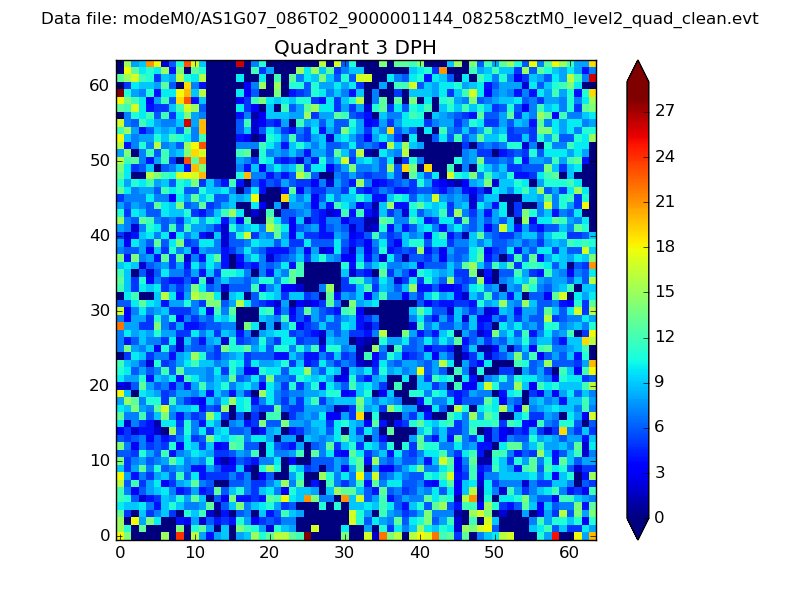 |
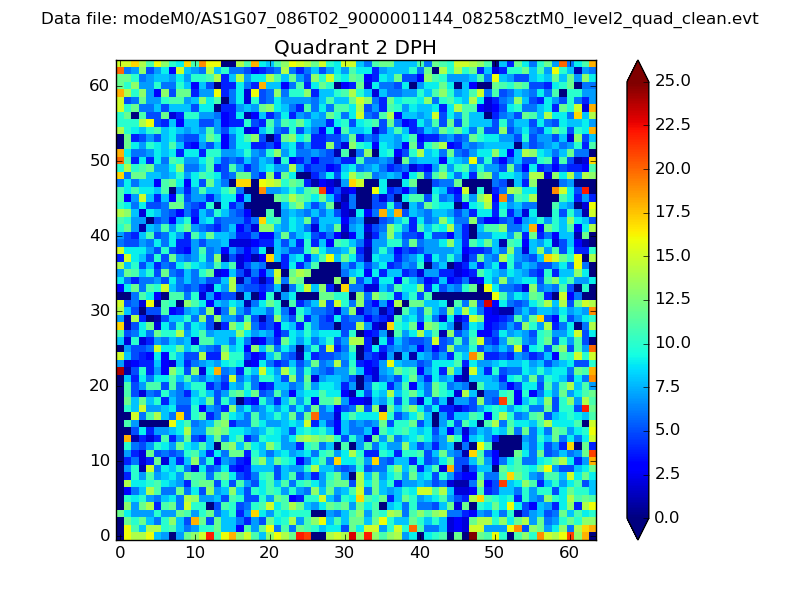 |
Quadrant C |
| Plot type | Count rate plots | Images |
|---|---|---|
| Comparison with Poisson distribution Blue bars denote a histogram of data divided into 1 sec bins. Red curve is a Poisson curve with rate = median count rate of data. |
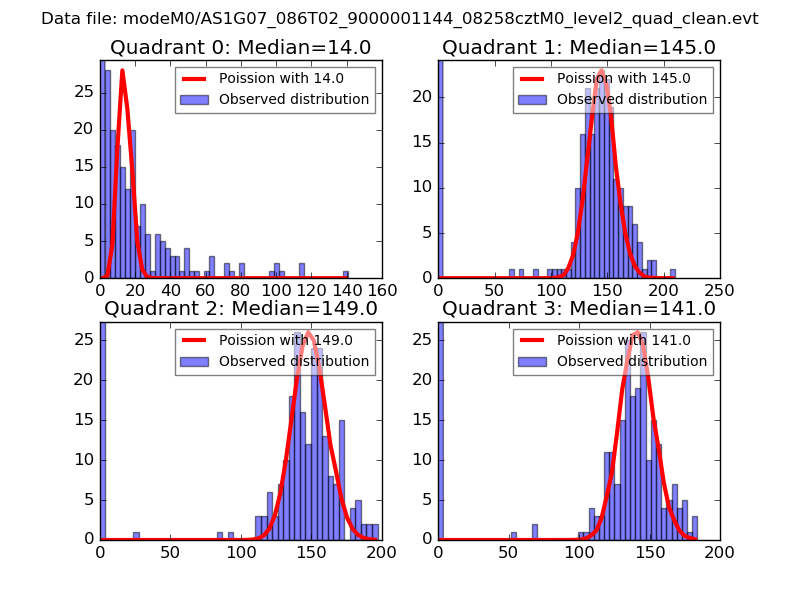 |
 |
| Quadrant-wise count rates Data is divided into 100 sec bins |
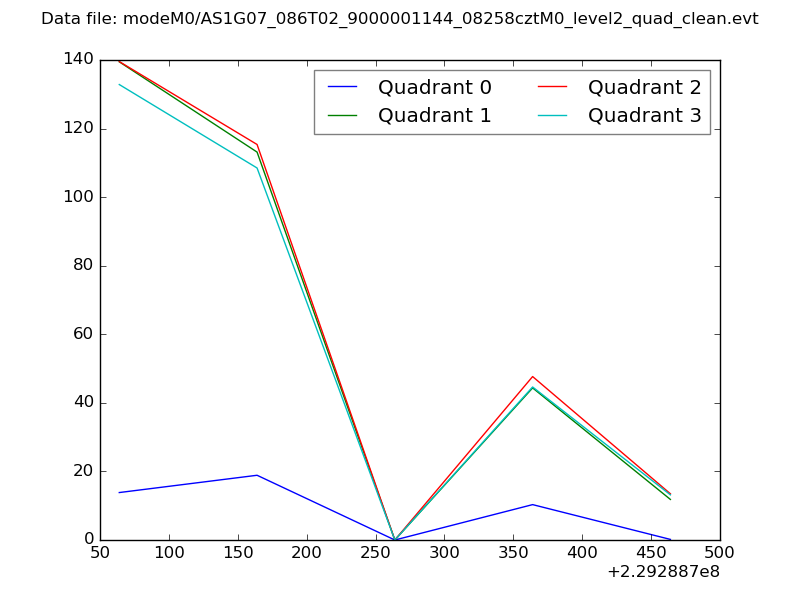 |
|
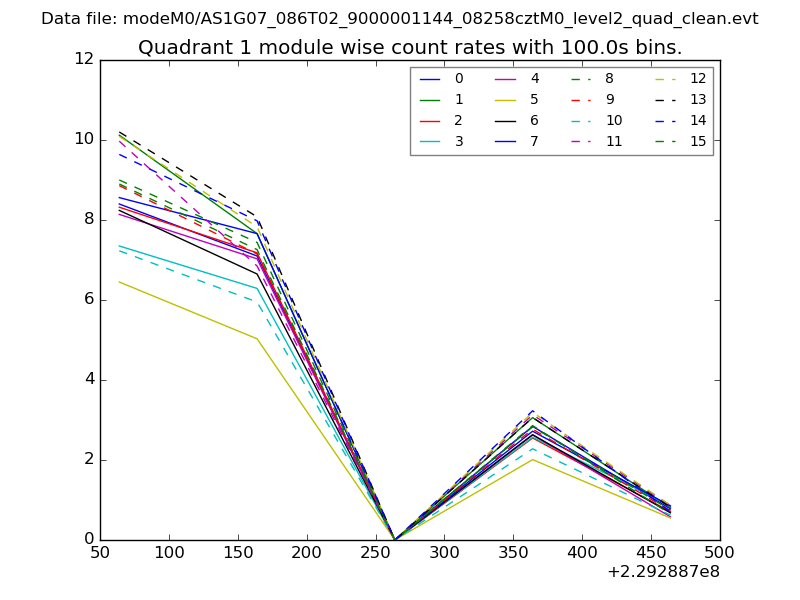
| Module-wise count rates for Quadrant A Data is divided into 100 sec bins |
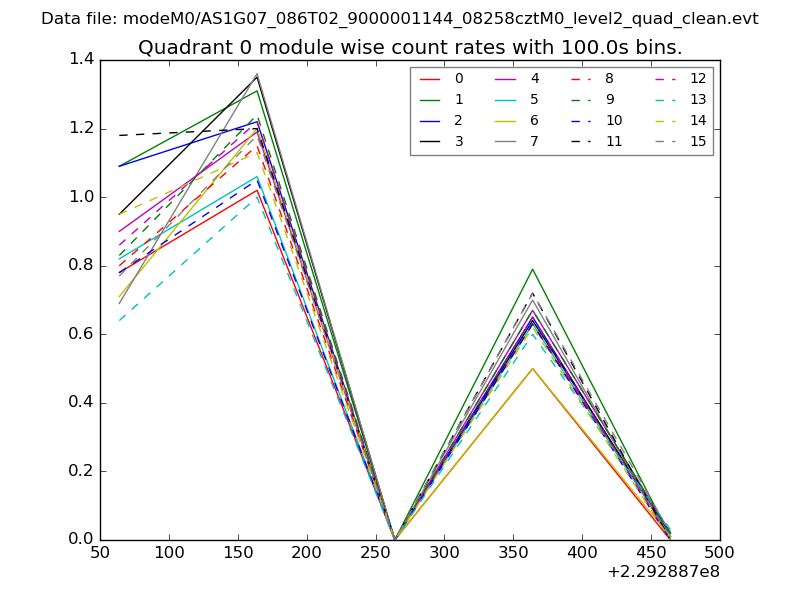 |
 |
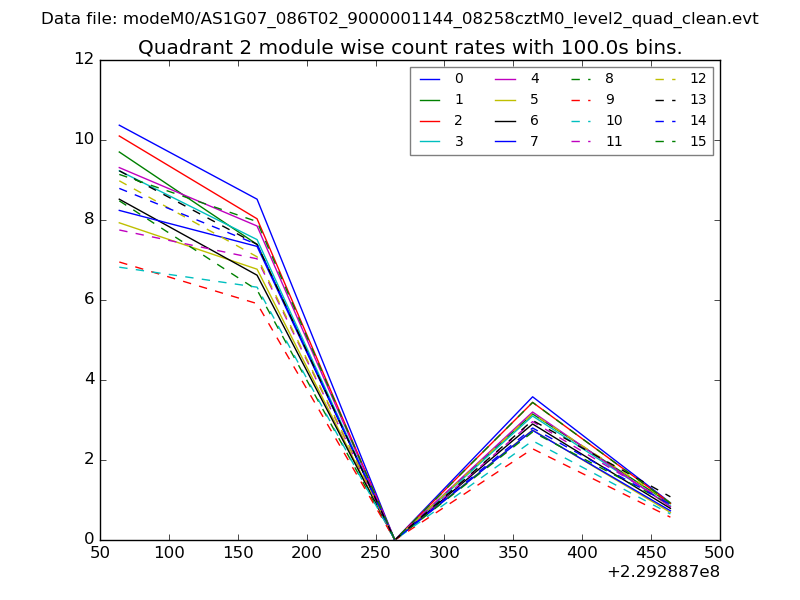
| Module-wise count rates for Quadrant B Data is divided into 100 sec bins |
 |
 |
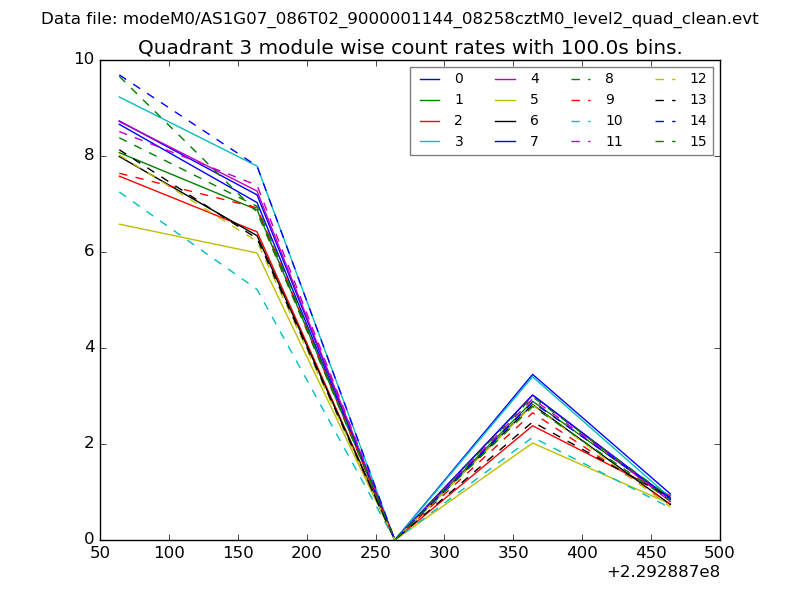
| Module-wise count rates for Quadrant C Data is divided into 100 sec bins |
 |
 |
| Module-wise count rates for Quadrant D Data is divided into 100 sec bins |
 |
 |
| Parameter | Plot |
|---|---|
| CZT HV Monitor | 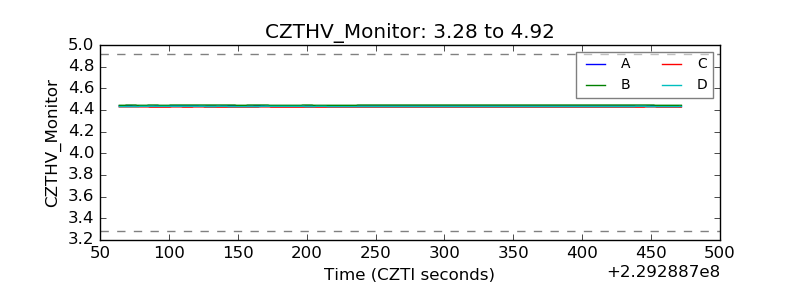 |
| D_VDD | 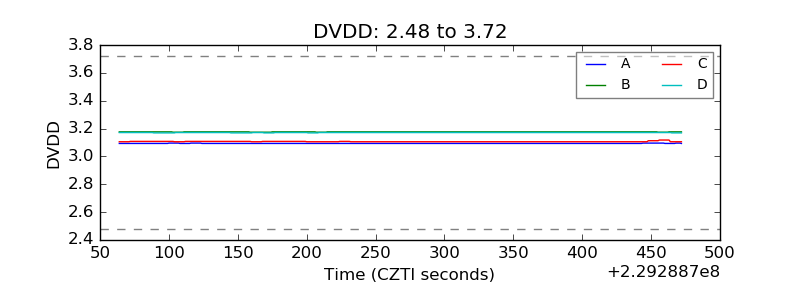 |
| Temperature 1 | 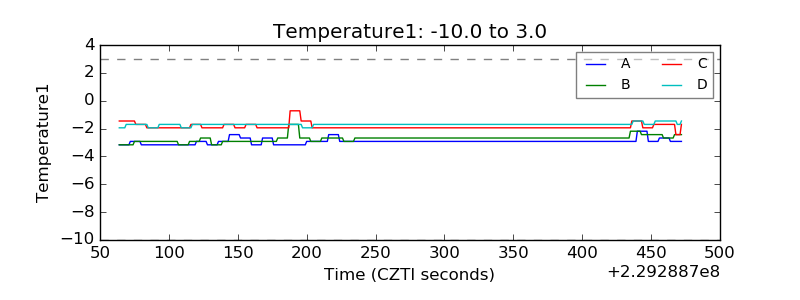 |
| Veto HV Monitor | 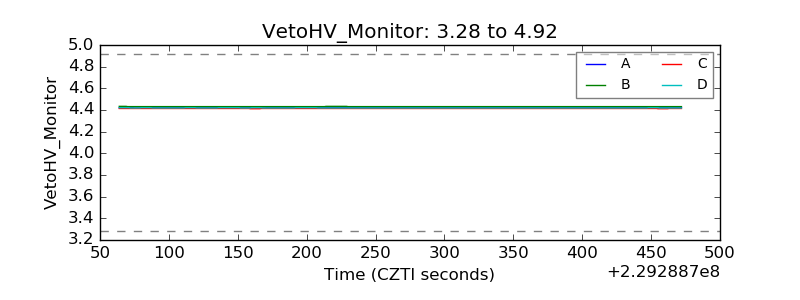 |
| Veto LLD | 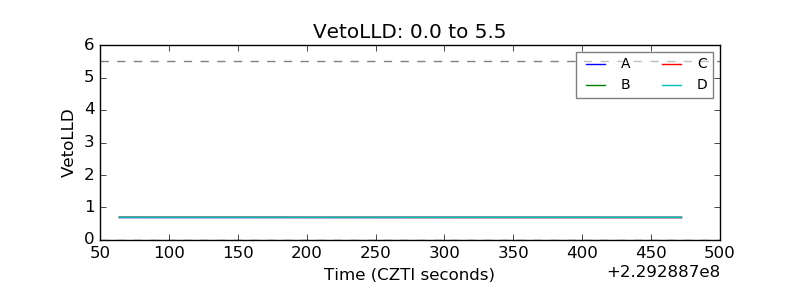 |
| Alpha Counter | 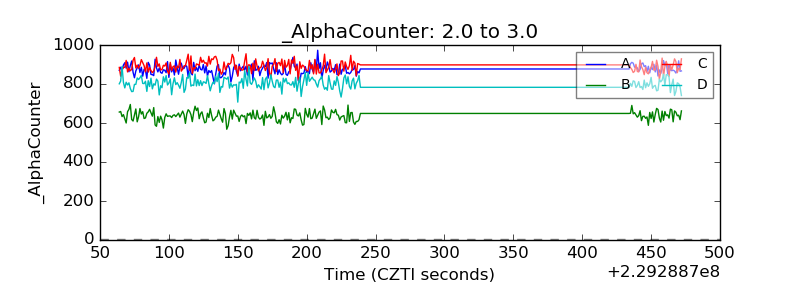 |
| _CPM_Rate | 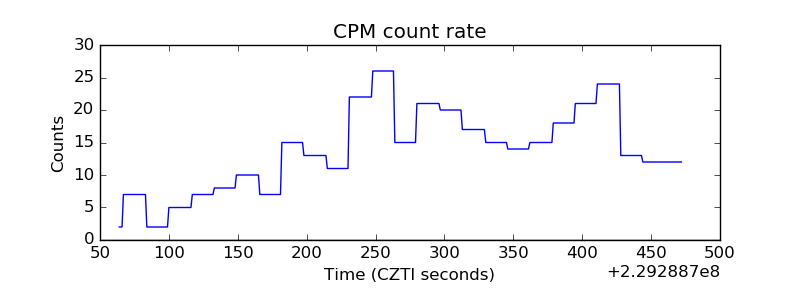 |
| CZT Counter | 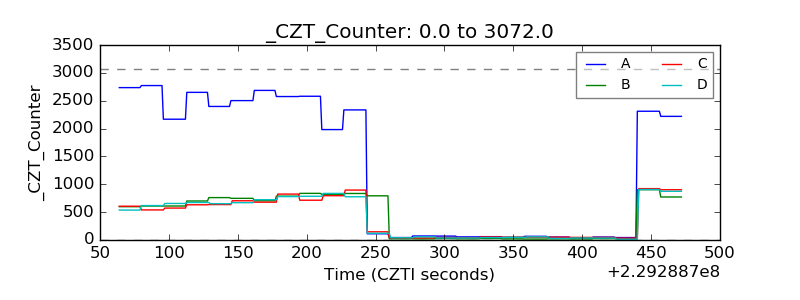 |
| +2.5 Volts monitor | 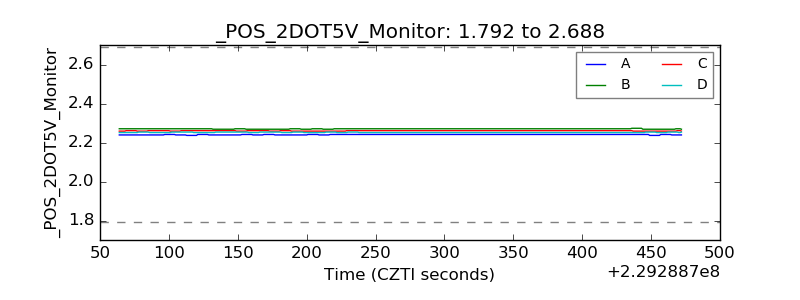 |
| +5 Volts monitor | 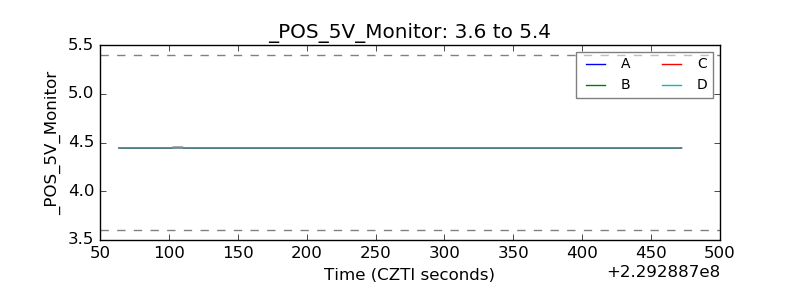 |
| _ROLL_ROT | 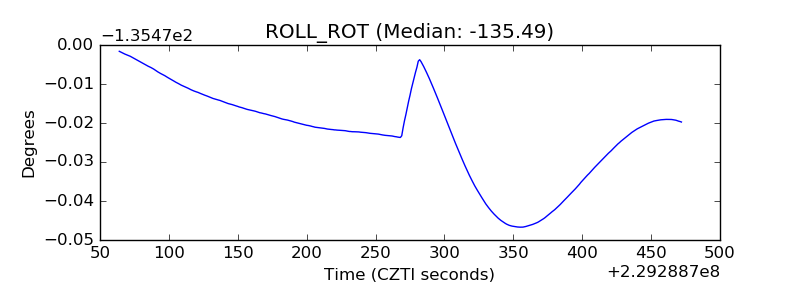 |
| _Roll_DEC | 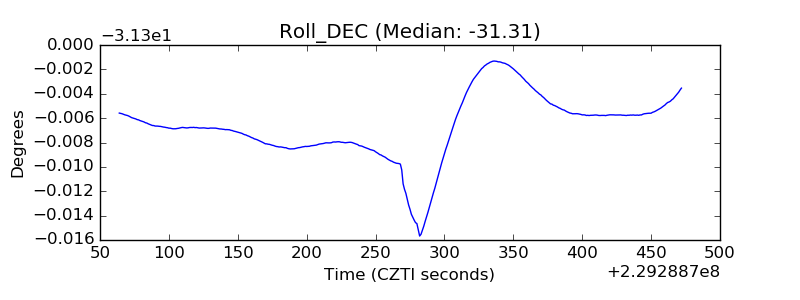 |
| _Roll_RA | 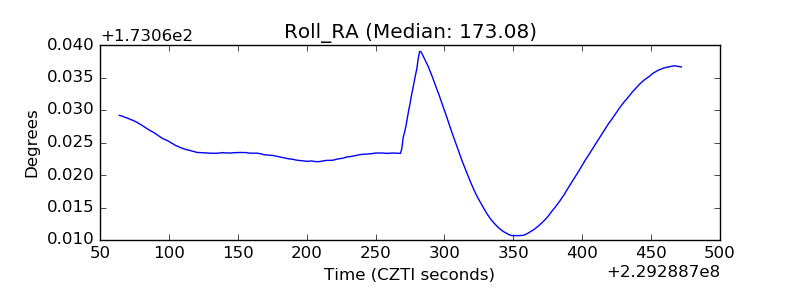 |
| Veto Counter | 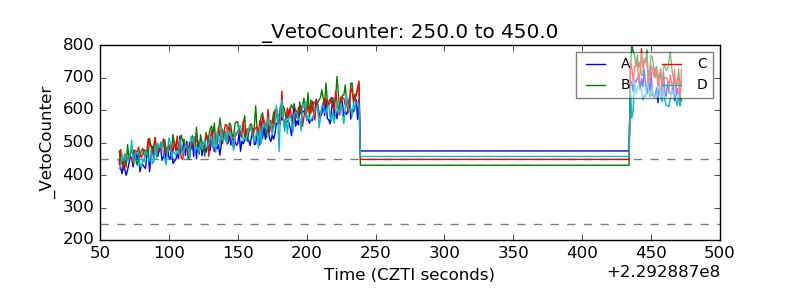 |