| Param | Original file | Final file |
|---|---|---|
| Filename | modeM0/AS1G07_086T02_9000001144_08259cztM0_level2.evt | modeM0/AS1G07_086T02_9000001144_08259cztM0_level2_quad_clean.evt |
| Size (bytes) | 873,823,680 | 90,976,320 |
| Size | 833.3 MB | 86.8 MB |
| Events in quadrant A | 15,291,664 | 320,773 |
| Events in quadrant B | 3,840,201 | 654,089 |
| Events in quadrant C | 3,398,380 | 639,852 |
| Events in quadrant D | 3,427,235 | 618,023 |
| Mode SS | |||
|---|---|---|---|
| Quadrant | BADHDUFLAG | Total packets | Discarded packets |
| A | 0 | 154 | 0 |
| B | 0 | 154 | 0 |
| C | 0 | 154 | 0 |
| D | 0 | 154 | 0 |
| Mode M0 | |||
|---|---|---|---|
| Quadrant | BADHDUFLAG | Total packets | Discarded packets |
| A | 0 | 50653 | 2 |
| B | 0 | 16432 | 2 |
| C | 0 | 15579 | 4 |
| D | 0 | 15844 | 2 |
| Mode M9 | |||
|---|---|---|---|
| Quadrant | BADHDUFLAG | Total packets | Discarded packets |
| A | 0 | 6 | 0 |
| B | 0 | 6 | 0 |
| C | 0 | 6 | 0 |
| D | 0 | 6 | 0 |
| Quadrant | Total seconds | Saturated seconds | Saturation percentage |
|---|---|---|---|
| A | 7487 | 5173 | 69.093095% |
| B | 7487 | 166 | 2.217176% |
| C | 7486 | 32 | 0.427465% |
| D | 7487 | 35 | 0.467477% |
Noise dominated data is calculated using 1-second bins in cleaned event files. If a bin has >2000 counts, and if more than 50% of those come from <1% of pixels, then it is considered to be noise-dominated and hence unusable.
| Quadrant | # 1 sec bins | Bins with >0 counts | Bins with >2000 counts | High rate bins dominated by noise | Noise dominated (total time) | Noise dominated (detector-on time) | Marked lightcurve |
|---|---|---|---|---|---|---|---|
| A | 7967 | 7488 | 4702 | 4702 | 59.02% | 62.79% | 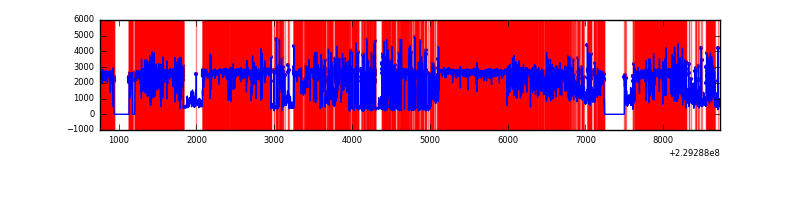 |
| B | 7967 | 7490 | 21 | 21 | 0.26% | 0.28% | 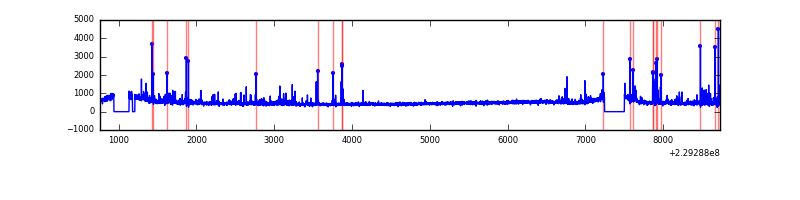 |
| C | 7967 | 7490 | 3 | 3 | 0.04% | 0.04% | 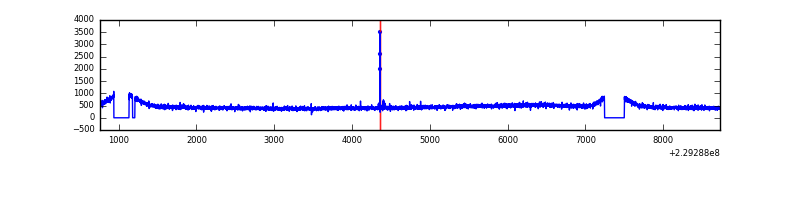 |
| D | 7967 | 7490 | 7 | 7 | 0.09% | 0.09% | 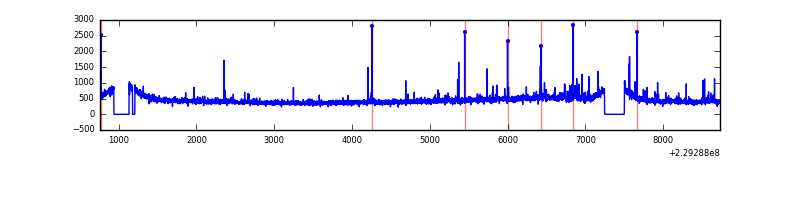 |
Top three noisy pixels from each quadrant. If the there are fewer than three noisy pixels in the level2.evt file, extra rows are filled as -1
| Pixel properties | Quadrant properties | ||||||
|---|---|---|---|---|---|---|---|
| Quadrant | DetID | PixID | Counts | Sigma | Mean | Median | Sigma |
| A | 0 | 128 | 13454066 | 138823.52 | 466 | 454 | 96.9 |
| A | 15 | 234 | 43418 | 443.33 | 466 | 454 | 96.9 |
| A | 0 | 226 | 4200 | 38.65 | 466 | 454 | 96.9 |
| B | 10 | 16 | 203608 | 1147.07 | 904 | 879 | 176.7 |
| B | 11 | 51 | 75597 | 422.76 | 904 | 879 | 176.7 |
| B | 0 | 214 | 38787 | 214.49 | 904 | 879 | 176.7 |
| C | 9 | 54 | 11817 | 54.1 | 866 | 868 | 202.4 |
| C | 13 | 61 | 6559 | 28.12 | 866 | 868 | 202.4 |
| C | 8 | 128 | 4304 | 16.98 | 866 | 868 | 202.4 |
| D | 1 | 52 | 80165 | 376.1 | 865 | 837 | 210.9 |
| D | 11 | 144 | 44585 | 207.41 | 865 | 837 | 210.9 |
| D | 2 | 234 | 27443 | 126.14 | 865 | 837 | 210.9 |
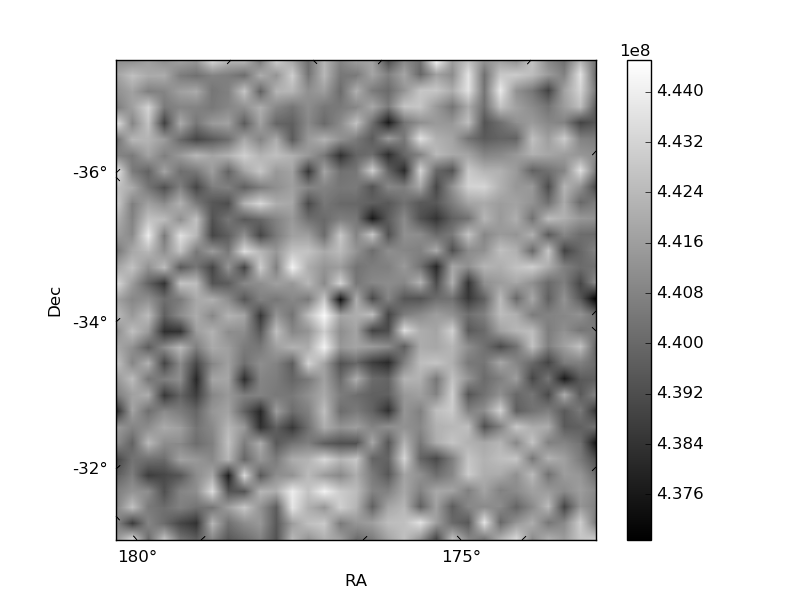
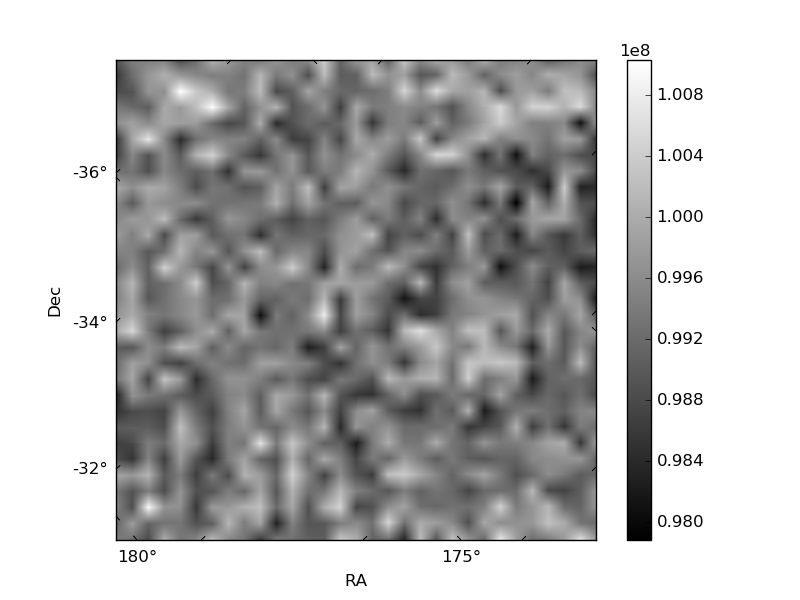
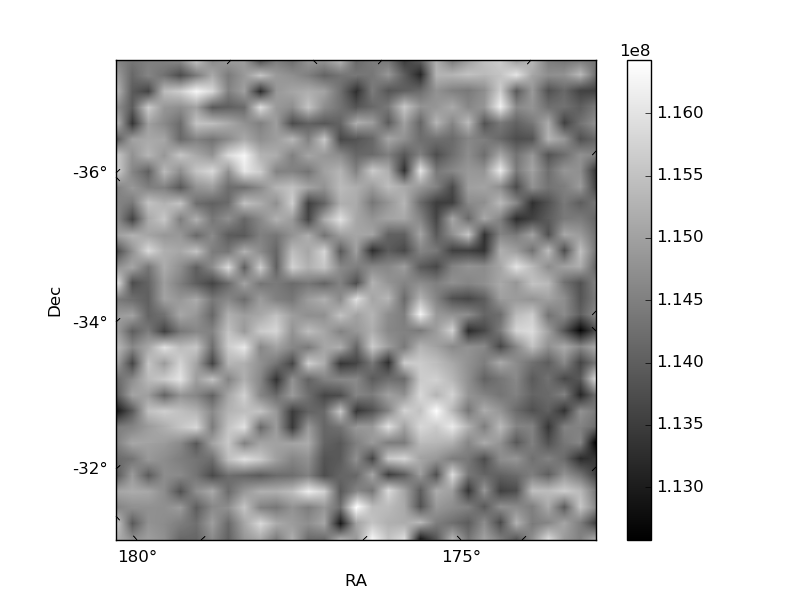
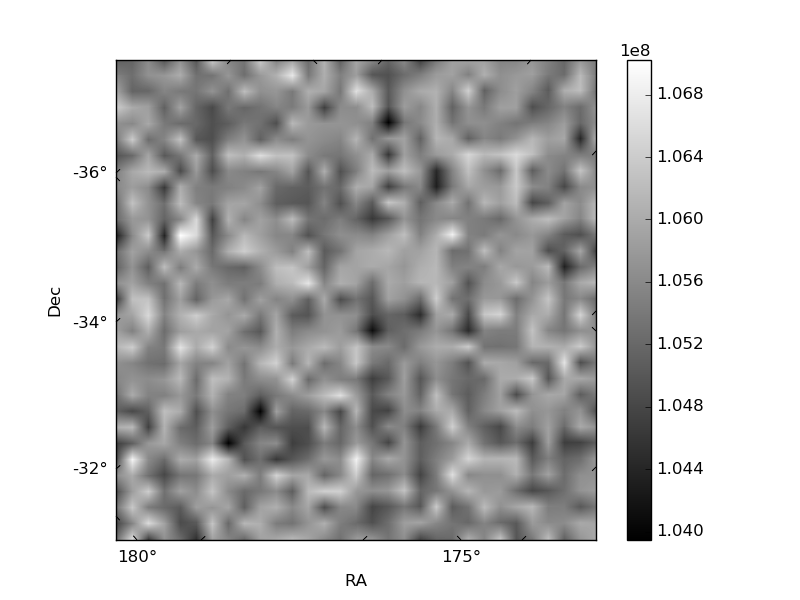
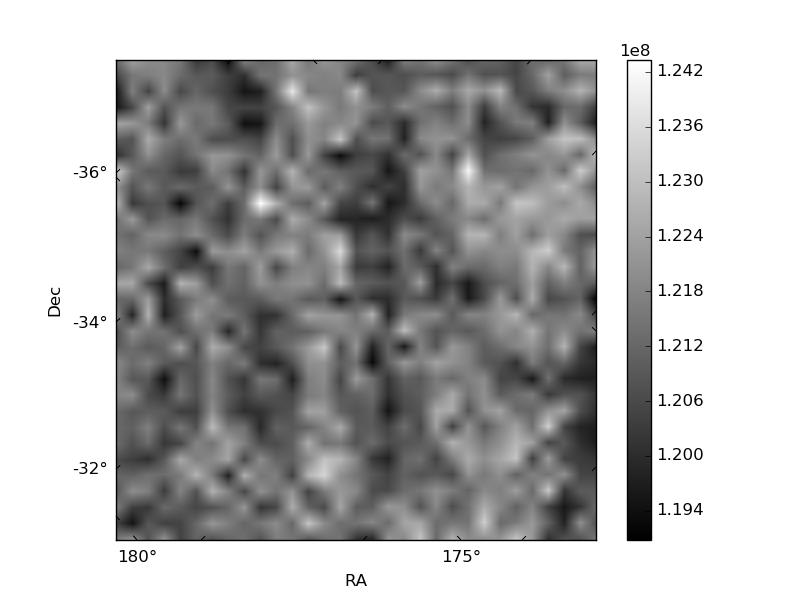
Histogram calculated using DETX and DETY for each event in the final _common_clean file
| Quadrant A | 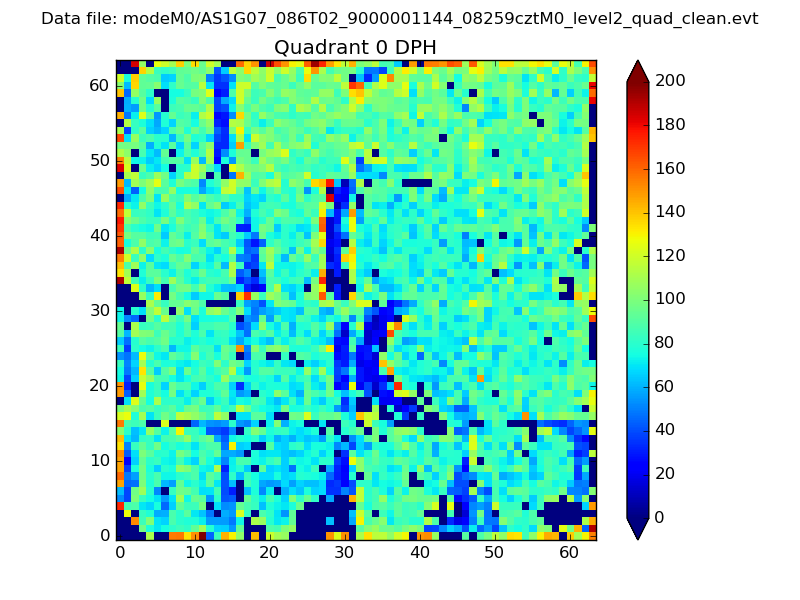 |
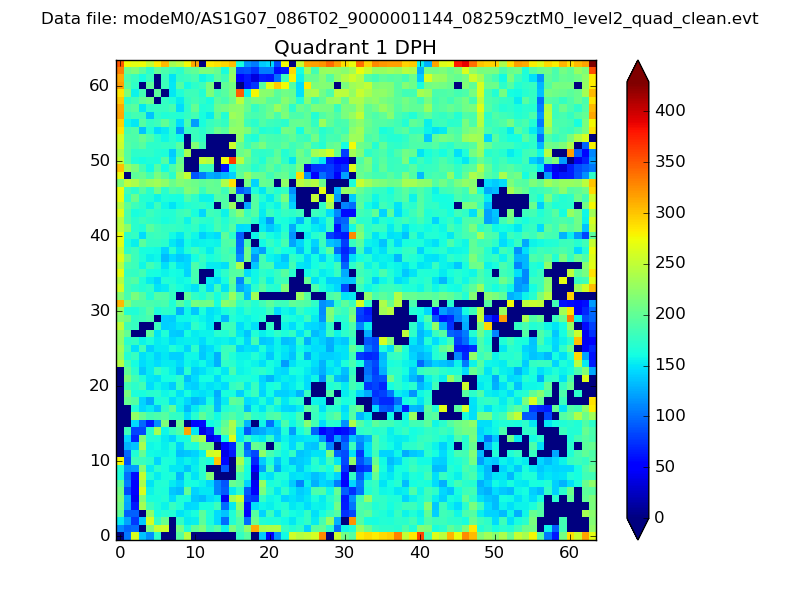 |
Quadrant B |
|---|---|---|---|
| Quadrant D | 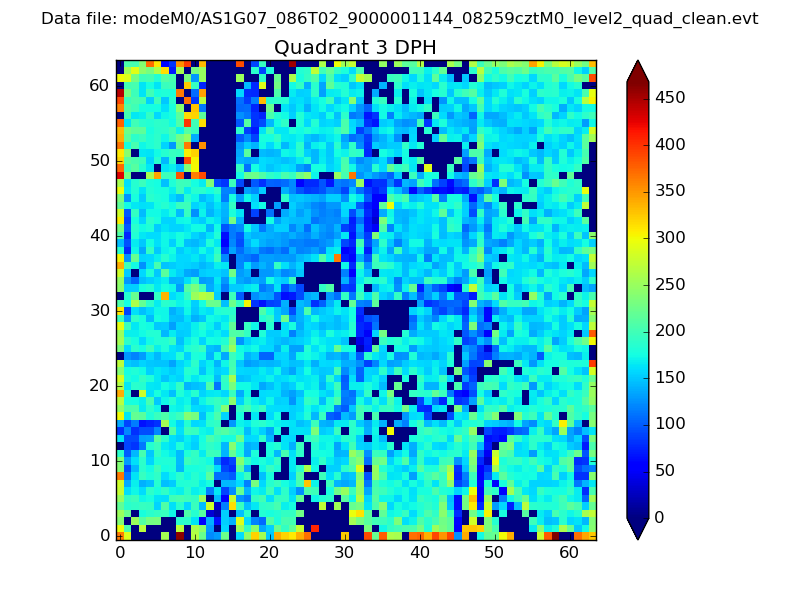 |
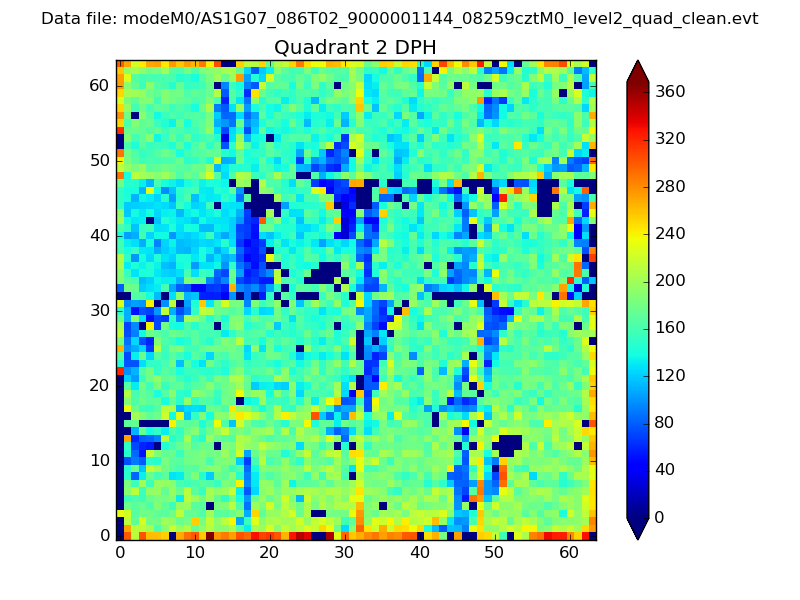 |
Quadrant C |
| Plot type | Count rate plots | Images |
|---|---|---|
| Comparison with Poisson distribution Blue bars denote a histogram of data divided into 1 sec bins. Red curve is a Poisson curve with rate = median count rate of data. |
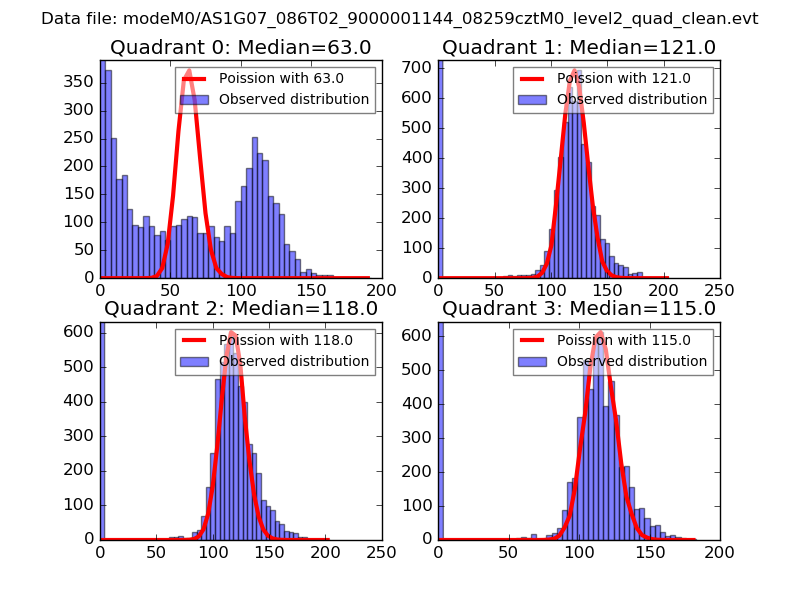 |
 |
| Quadrant-wise count rates Data is divided into 100 sec bins |
 |
|
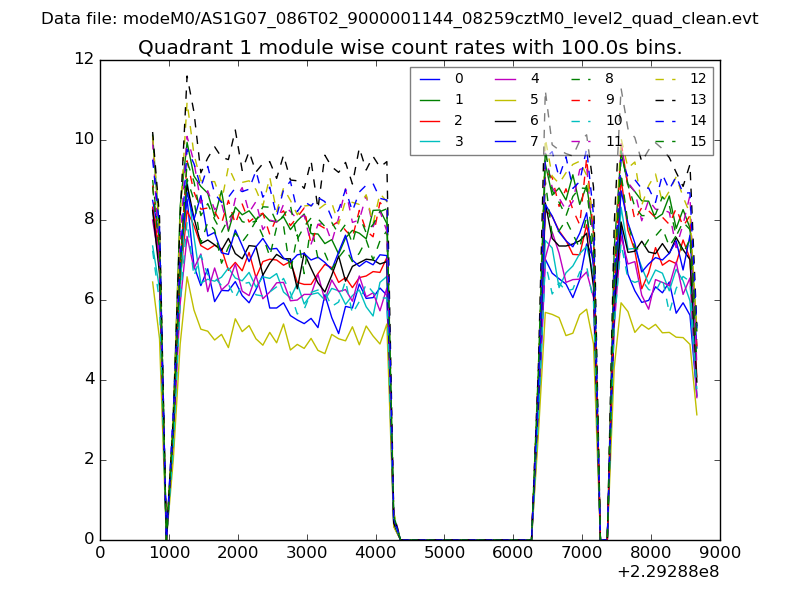
| Module-wise count rates for Quadrant A Data is divided into 100 sec bins |
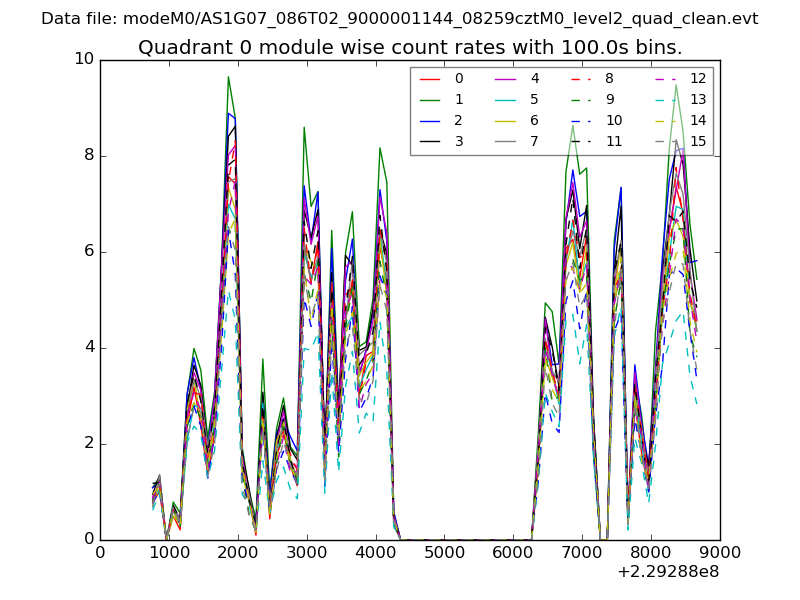 |
 |
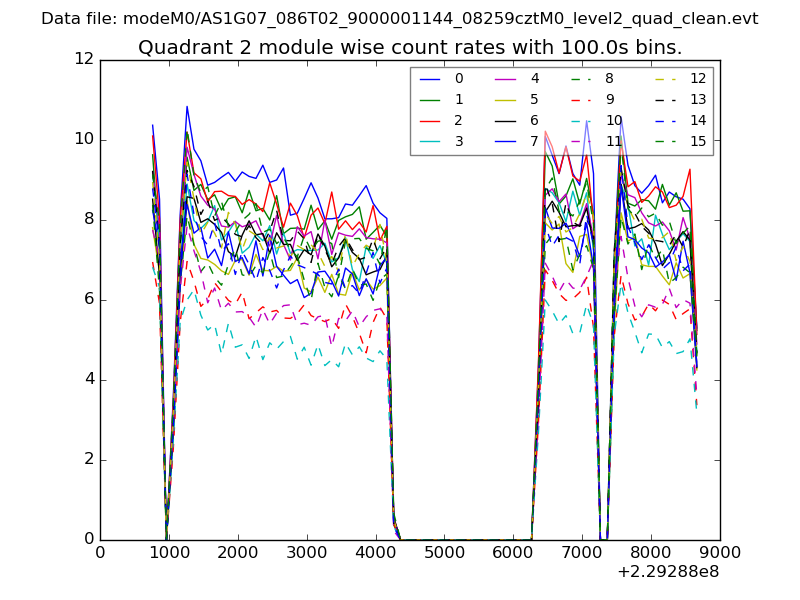
| Module-wise count rates for Quadrant B Data is divided into 100 sec bins |
 |
 |
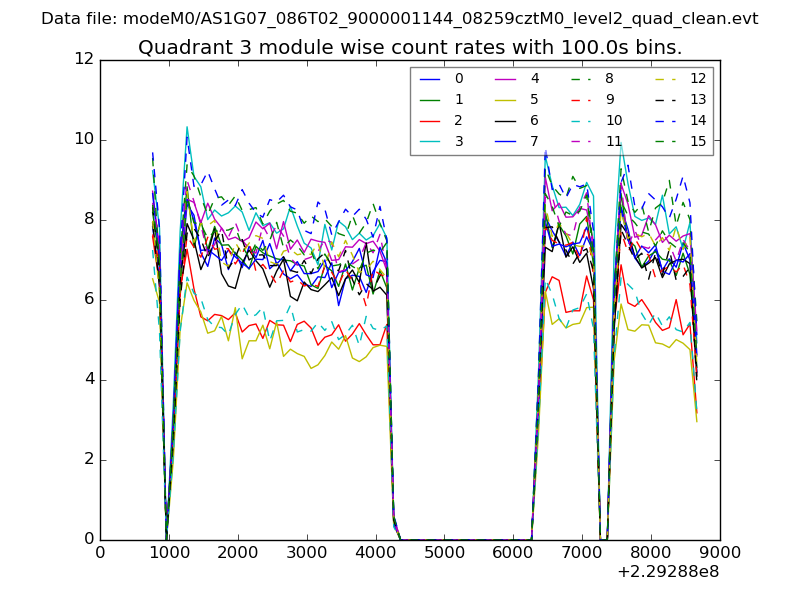
| Module-wise count rates for Quadrant C Data is divided into 100 sec bins |
 |
 |
| Module-wise count rates for Quadrant D Data is divided into 100 sec bins |
 |
 |
| Parameter | Plot |
|---|---|
| CZT HV Monitor | 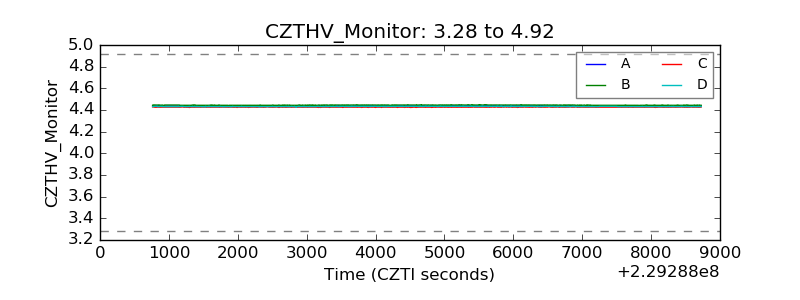 |
| D_VDD | 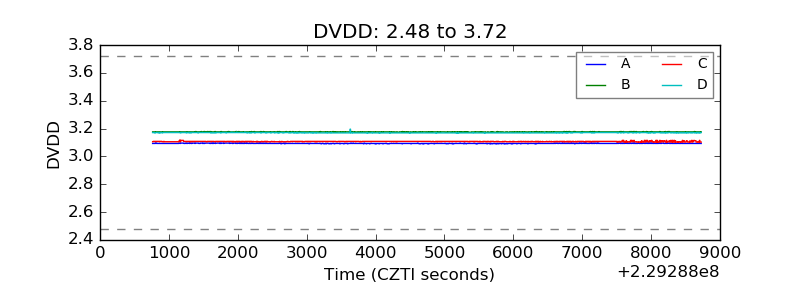 |
| Temperature 1 | 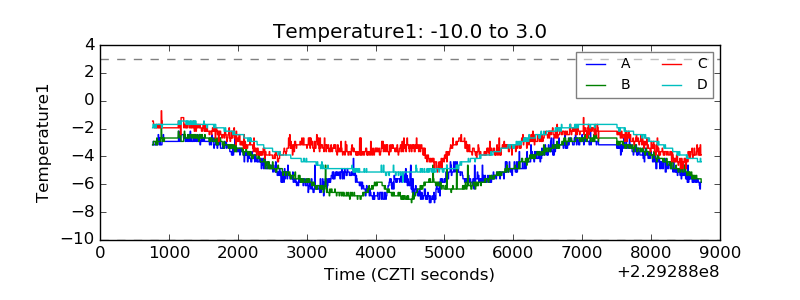 |
| Veto HV Monitor | 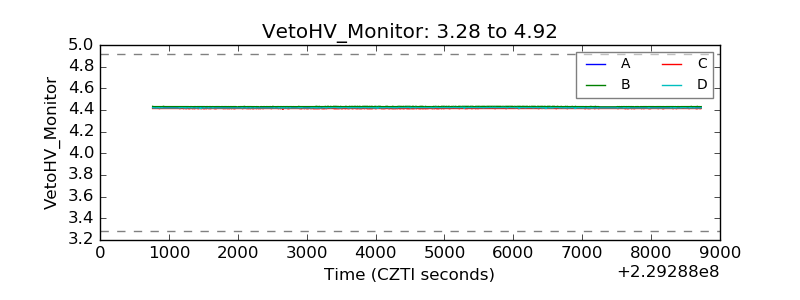 |
| Veto LLD | 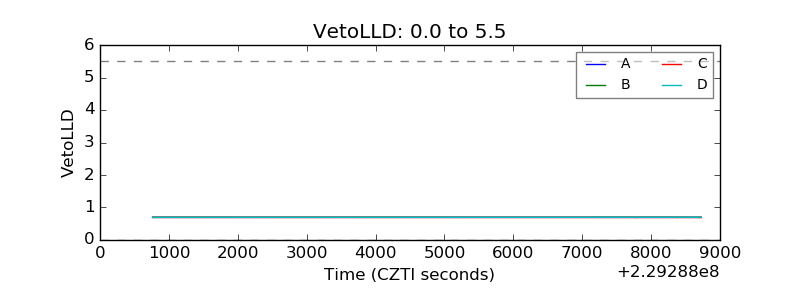 |
| Alpha Counter |  |
| _CPM_Rate | 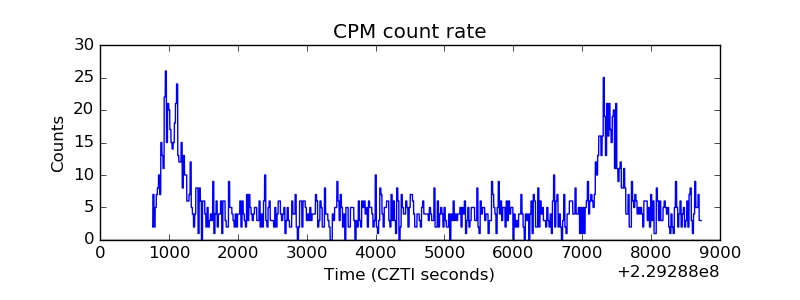 |
| CZT Counter | 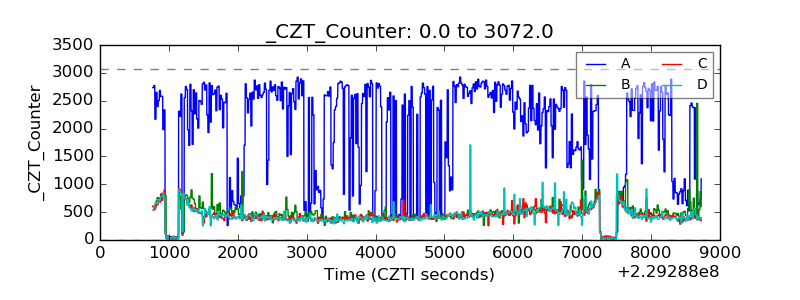 |
| +2.5 Volts monitor |  |
| +5 Volts monitor |  |
| _ROLL_ROT | 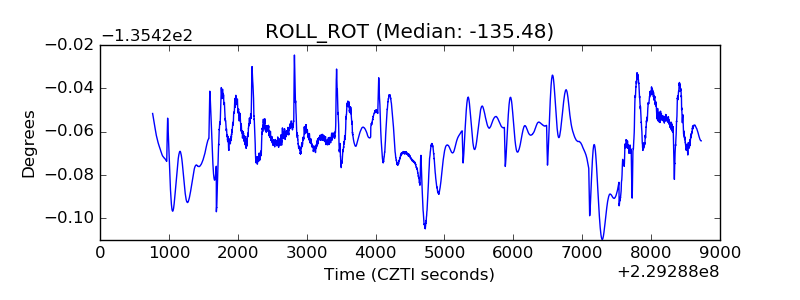 |
| _Roll_DEC | 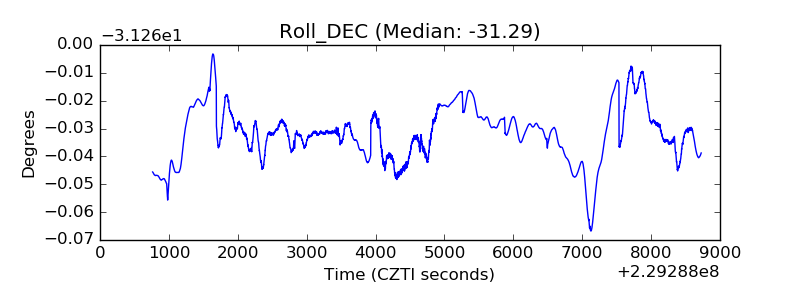 |
| _Roll_RA | 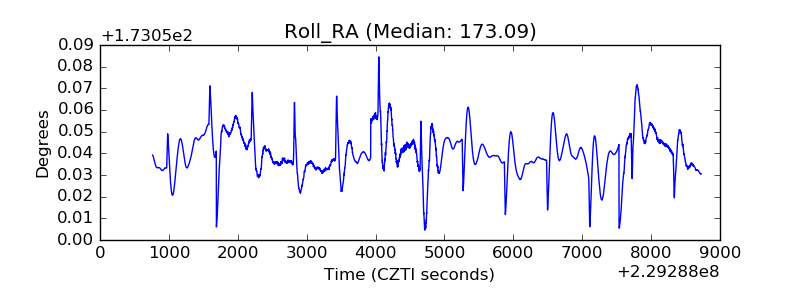 |
| Veto Counter | 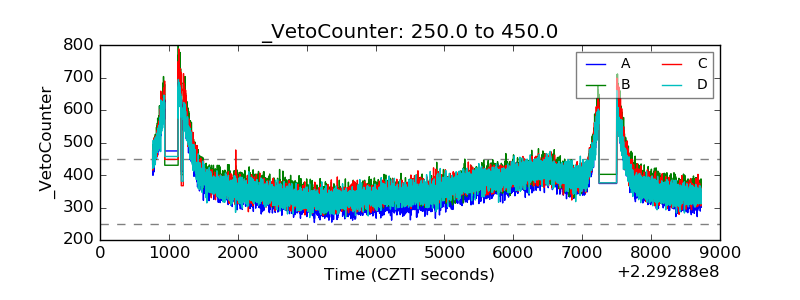 |