| Param | Original file | Final file |
|---|---|---|
| Filename | modeM0/AS1G06_136T01_9000001148_08259cztM0_level2.evt | modeM0/AS1G06_136T01_9000001148_08259cztM0_level2_quad_clean.evt |
| Size (bytes) | 165,355,200 | 25,257,600 |
| Size | 157.7 MB | 24.1 MB |
| Events in quadrant A | 2,291,947 | 126,413 |
| Events in quadrant B | 678,698 | 181,163 |
| Events in quadrant C | 734,279 | 181,516 |
| Events in quadrant D | 1,202,189 | 167,611 |
| Mode SS | |||
|---|---|---|---|
| Quadrant | BADHDUFLAG | Total packets | Discarded packets |
| A | 0 | 30 | 0 |
| B | 0 | 30 | 0 |
| C | 0 | 30 | 0 |
| D | 0 | 30 | 0 |
| Mode M9 | |||
|---|---|---|---|
| Quadrant | BADHDUFLAG | Total packets | Discarded packets |
| A | 0 | 4 | 0 |
| B | 0 | 4 | 0 |
| C | 0 | 4 | 0 |
| D | 0 | 4 | 0 |
| Mode M0 | |||
|---|---|---|---|
| Quadrant | BADHDUFLAG | Total packets | Discarded packets |
| A | 0 | 7777 | 2 |
| B | 0 | 2957 | 1 |
| C | 0 | 3157 | 1 |
| D | 0 | 4580 | 1 |
| Quadrant | Total seconds | Saturated seconds | Saturation percentage |
|---|---|---|---|
| A | 1442 | 672 | 46.601942% |
| B | 1442 | 9 | 0.624133% |
| C | 1442 | 24 | 1.664355% |
| D | 1442 | 142 | 9.847434% |
Noise dominated data is calculated using 1-second bins in cleaned event files. If a bin has >2000 counts, and if more than 50% of those come from <1% of pixels, then it is considered to be noise-dominated and hence unusable.
| Quadrant | # 1 sec bins | Bins with >0 counts | Bins with >2000 counts | High rate bins dominated by noise | Noise dominated (total time) | Noise dominated (detector-on time) | Marked lightcurve |
|---|---|---|---|---|---|---|---|
| A | 1442 | 1442 | 583 | 583 | 40.43% | 40.43% | 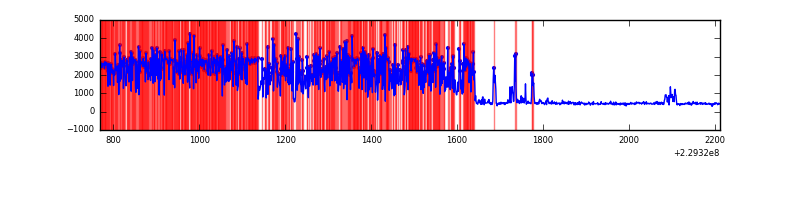 |
| B | 1442 | 1442 | 0 | 0 | 0.00% | 0.00% | 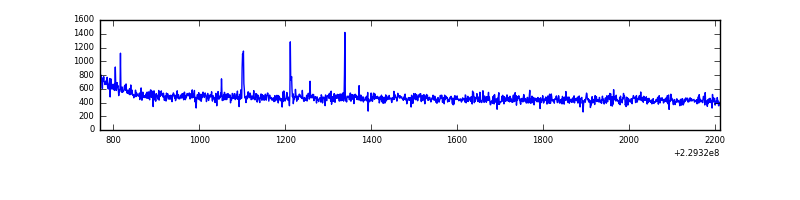 |
| C | 1442 | 1442 | 20 | 20 | 1.39% | 1.39% | 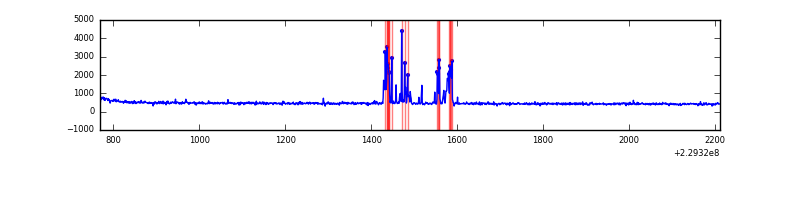 |
| D | 1442 | 1442 | 125 | 125 | 8.67% | 8.67% | 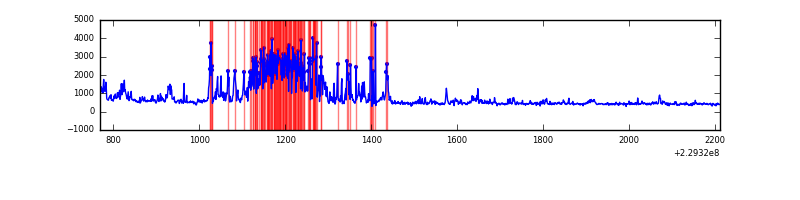 |
Top three noisy pixels from each quadrant. If the there are fewer than three noisy pixels in the level2.evt file, extra rows are filled as -1
| Pixel properties | Quadrant properties | ||||||
|---|---|---|---|---|---|---|---|
| Quadrant | DetID | PixID | Counts | Sigma | Mean | Median | Sigma |
| A | 0 | 128 | 1772262 | 62087.15 | 132 | 129 | 28.5 |
| A | 13 | 248 | 9094 | 314.09 | 132 | 129 | 28.5 |
| A | 0 | 226 | 1201 | 37.56 | 132 | 129 | 28.5 |
| B | 0 | 214 | 5159 | 140.59 | 172 | 168 | 35.5 |
| B | 12 | 111 | 3699 | 99.46 | 172 | 168 | 35.5 |
| B | 10 | 252 | 3531 | 94.73 | 172 | 168 | 35.5 |
| C | 9 | 54 | 85998 | 2156.65 | 165 | 167 | 39.8 |
| C | 13 | 61 | 1247 | 27.14 | 165 | 167 | 39.8 |
| C | 12 | 4 | 1162 | 25.0 | 165 | 167 | 39.8 |
| D | 1 | 52 | 387055 | 9751.95 | 160 | 156 | 39.7 |
| D | 12 | 233 | 202499 | 5100.14 | 160 | 156 | 39.7 |
| D | 2 | 234 | 4686 | 114.18 | 160 | 156 | 39.7 |
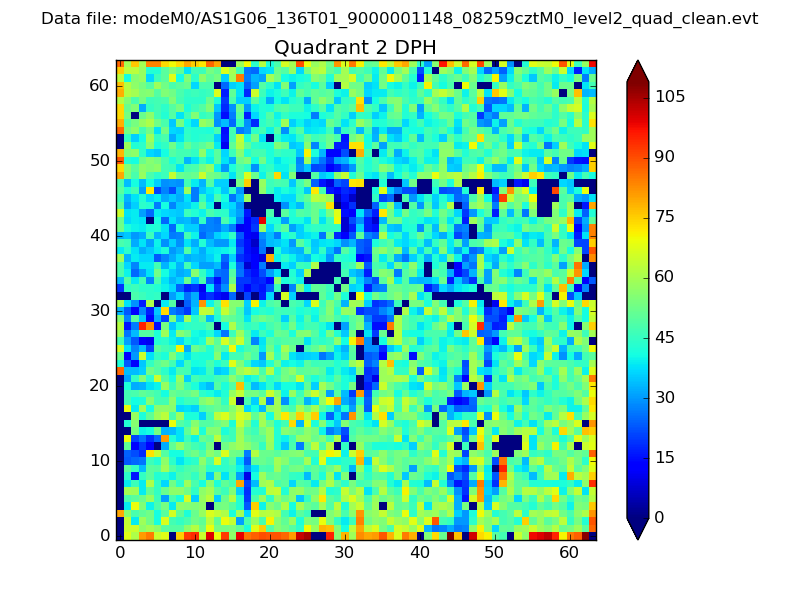
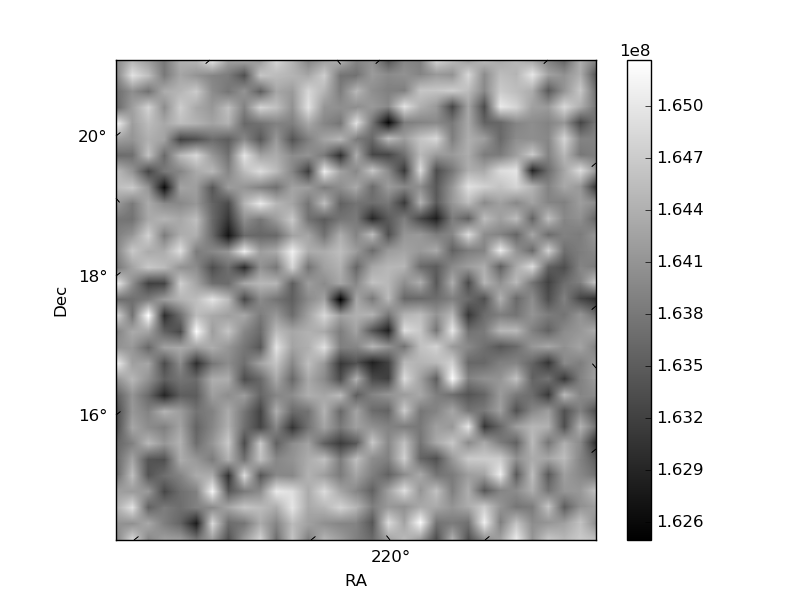
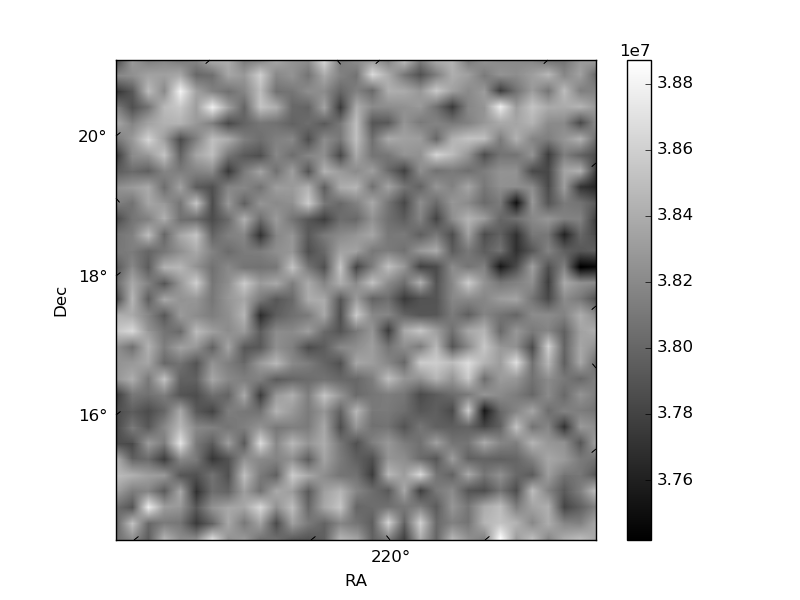
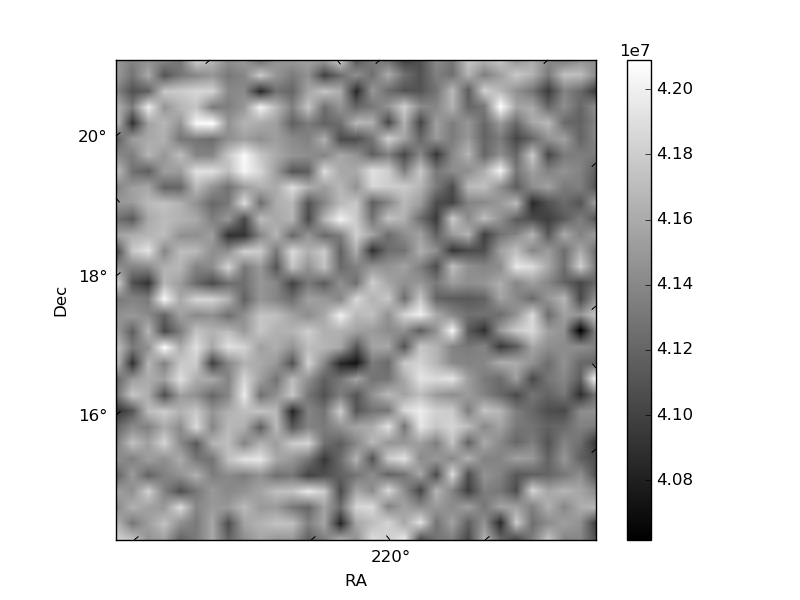
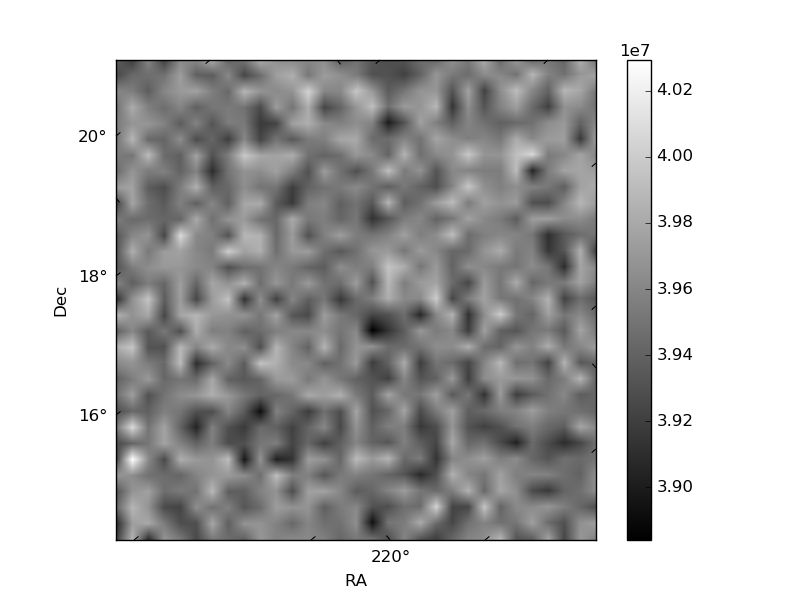
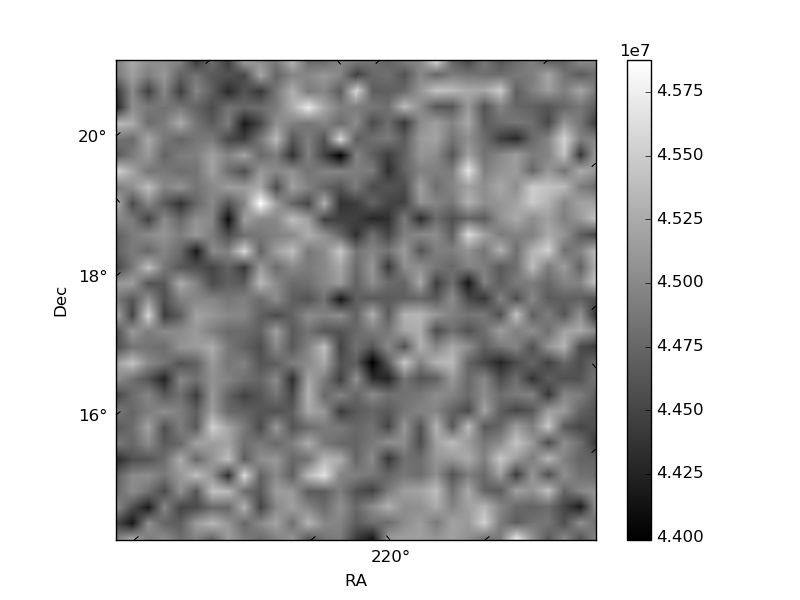
Histogram calculated using DETX and DETY for each event in the final _common_clean file
| Quadrant A | 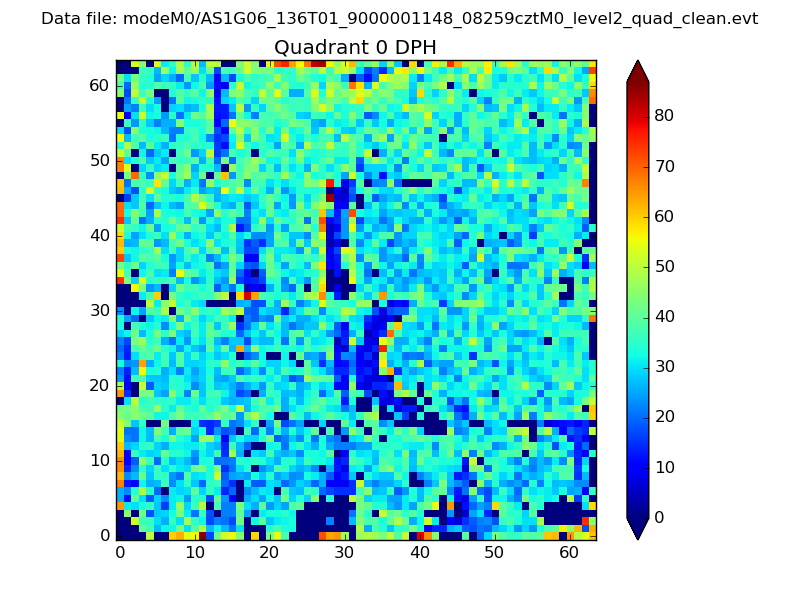 |
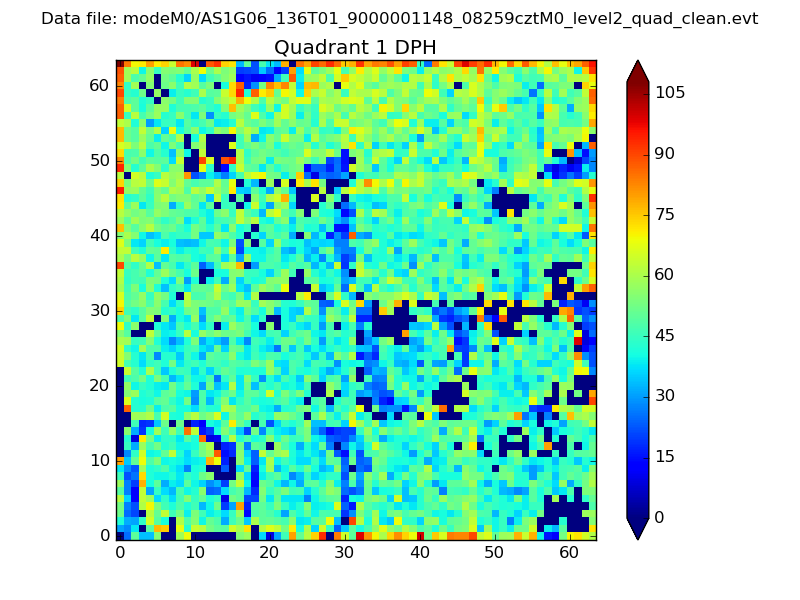 |
Quadrant B |
|---|---|---|---|
| Quadrant D | 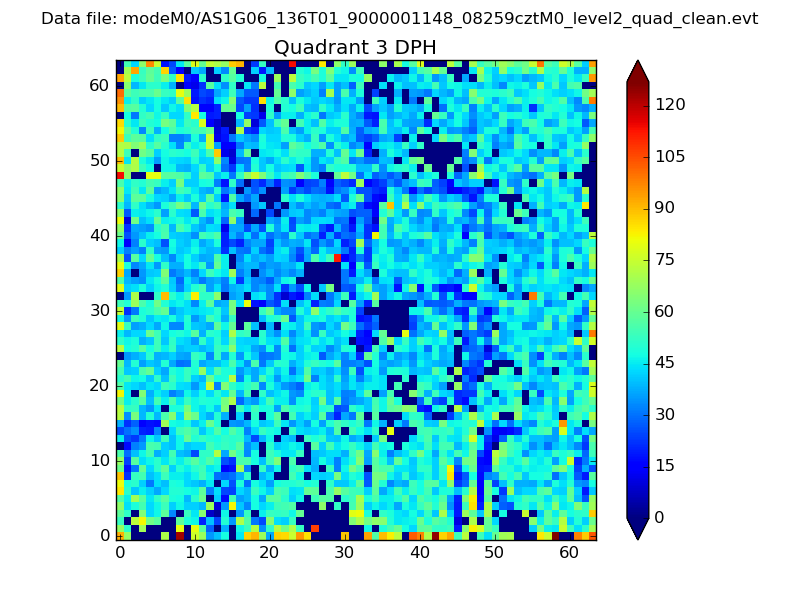 |
 |
Quadrant C |
| Plot type | Count rate plots | Images |
|---|---|---|
| Comparison with Poisson distribution Blue bars denote a histogram of data divided into 1 sec bins. Red curve is a Poisson curve with rate = median count rate of data. |
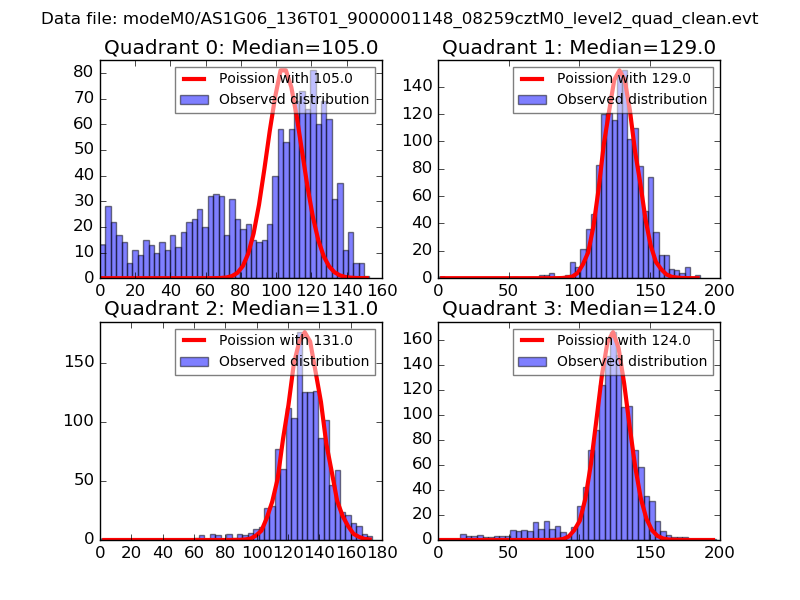 |
 |
| Quadrant-wise count rates Data is divided into 100 sec bins |
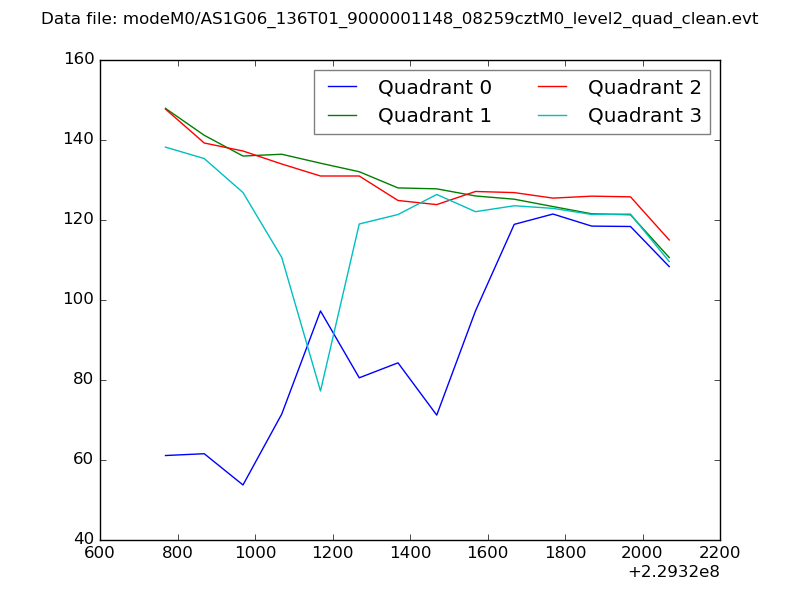 |
|
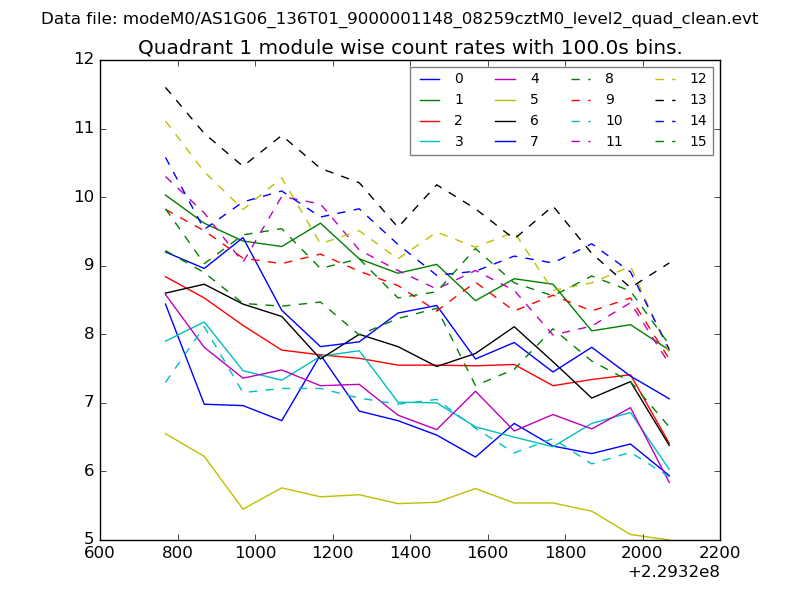
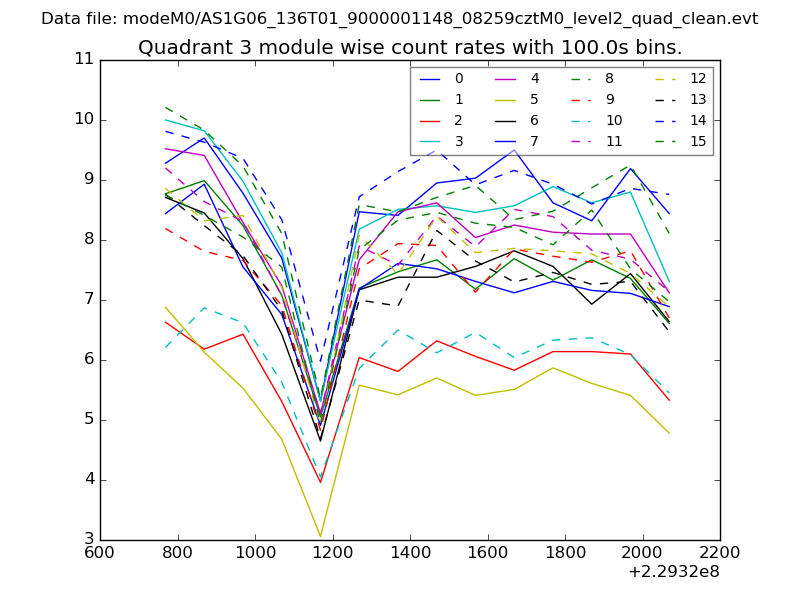
| Module-wise count rates for Quadrant A Data is divided into 100 sec bins |
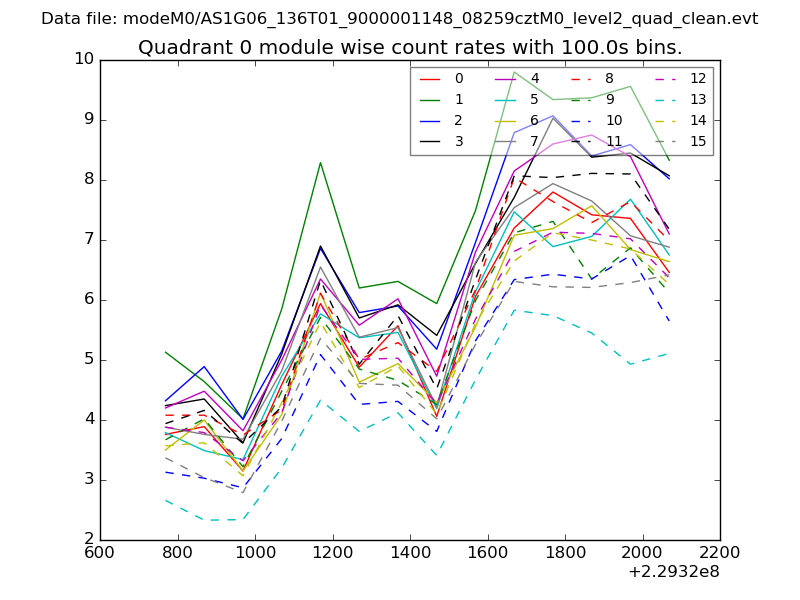 |
 |
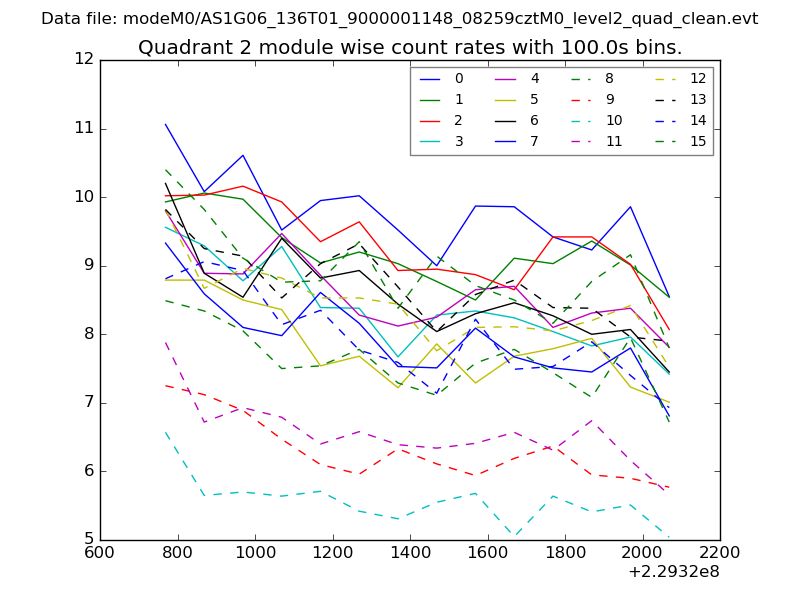
| Module-wise count rates for Quadrant B Data is divided into 100 sec bins |
 |
 |
| Module-wise count rates for Quadrant C Data is divided into 100 sec bins |
 |
 |
| Module-wise count rates for Quadrant D Data is divided into 100 sec bins |
 |
 |
| Parameter | Plot |
|---|---|
| CZT HV Monitor | 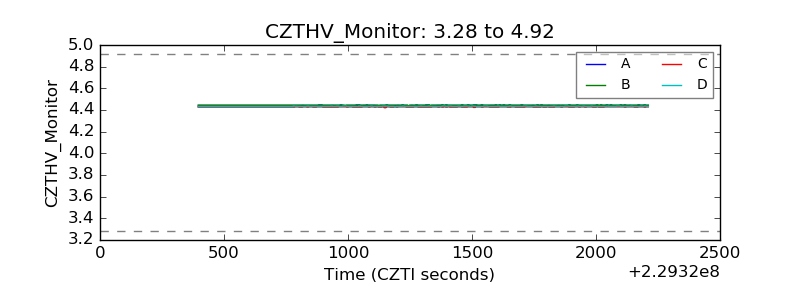 |
| D_VDD | 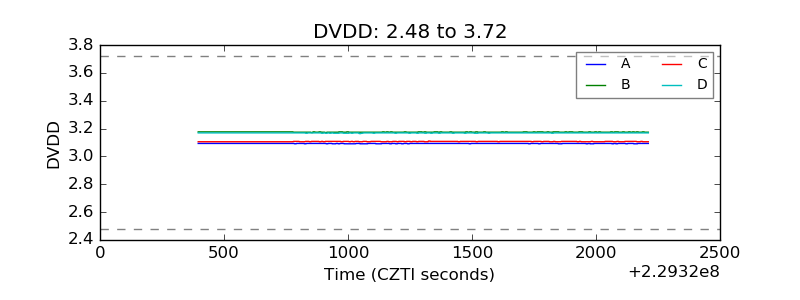 |
| Temperature 1 | 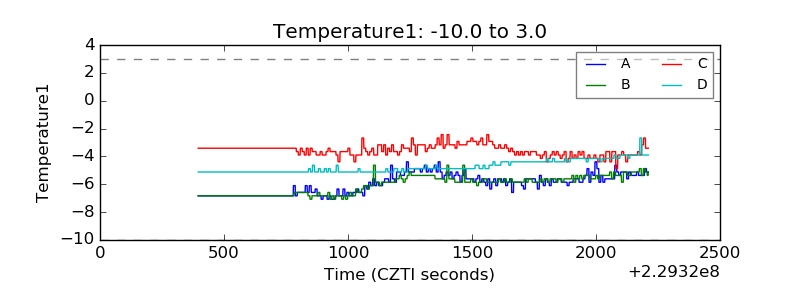 |
| Veto HV Monitor | 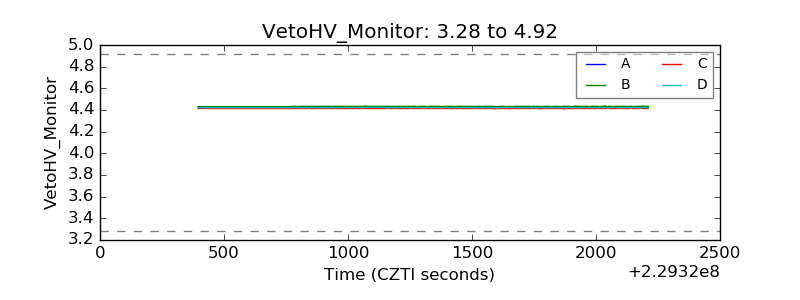 |
| Veto LLD | 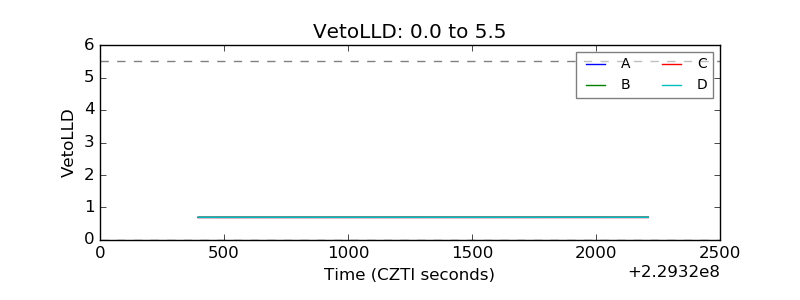 |
| Alpha Counter | 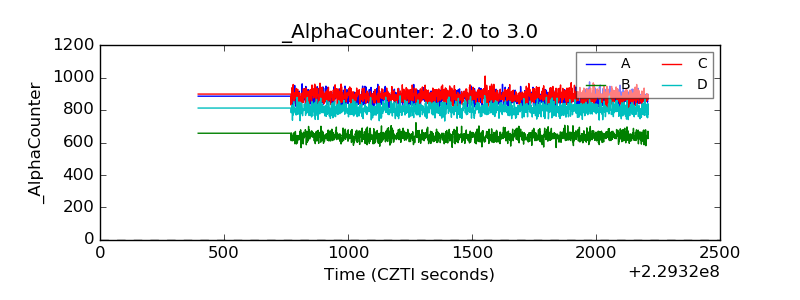 |
| _CPM_Rate | 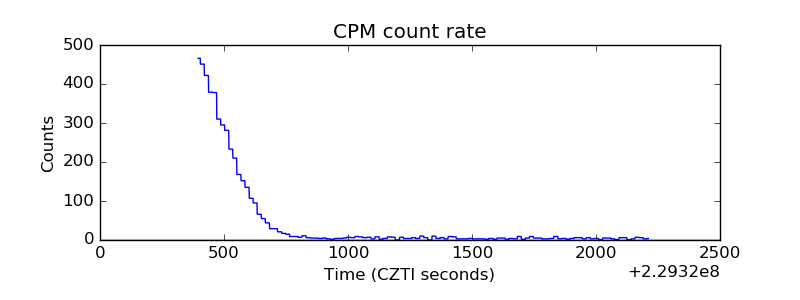 |
| CZT Counter |  |
| +2.5 Volts monitor |  |
| +5 Volts monitor | 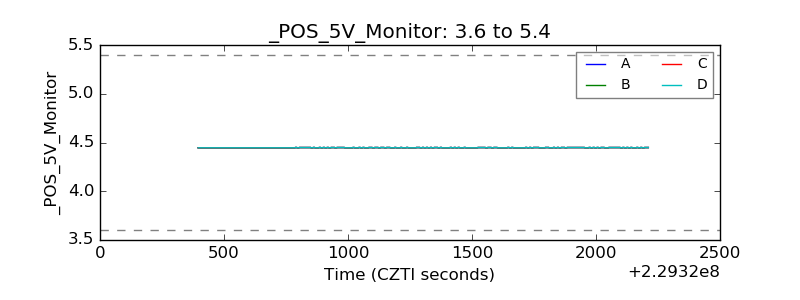 |
| _ROLL_ROT | 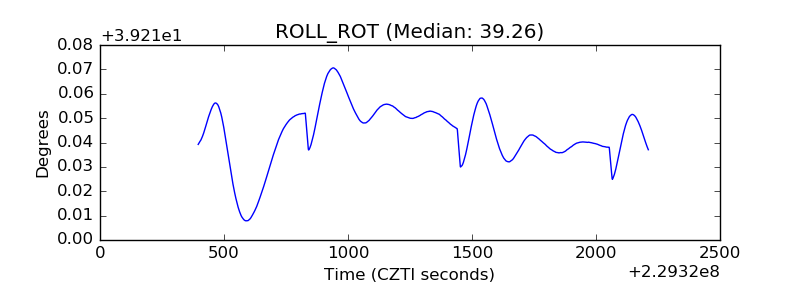 |
| _Roll_DEC | 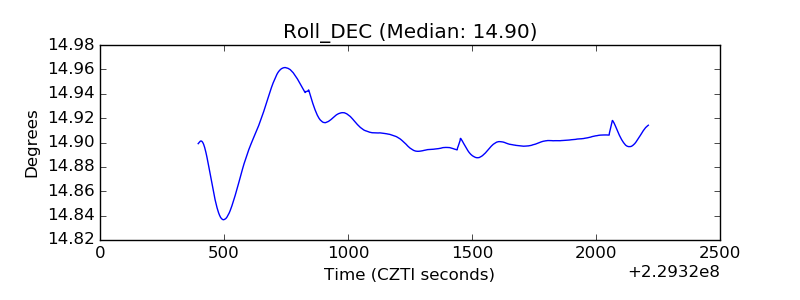 |
| _Roll_RA | 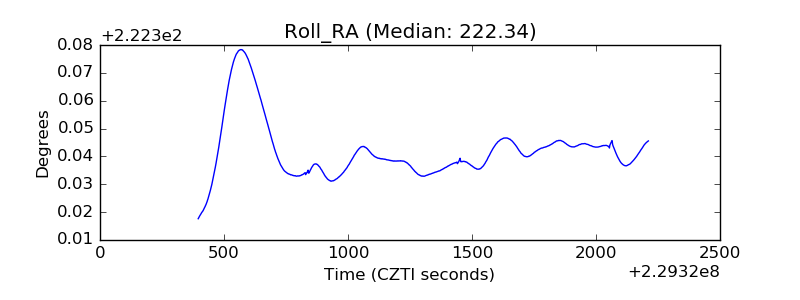 |
| Veto Counter | 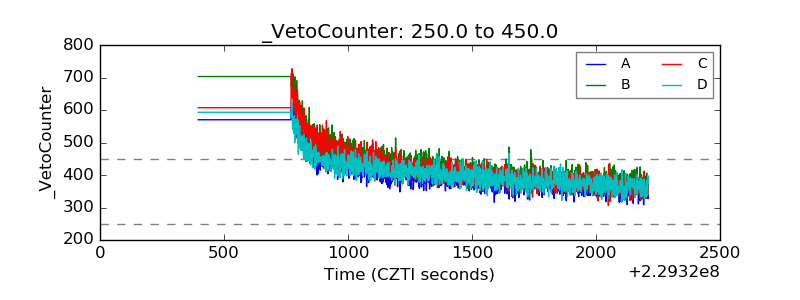 |