| Param | Original file | Final file |
|---|---|---|
| Filename | modeM0/AS1G06_136T01_9000001148_08260cztM0_level2.evt | modeM0/AS1G06_136T01_9000001148_08260cztM0_level2_quad_clean.evt |
| Size (bytes) | 703,160,640 | 74,943,360 |
| Size | 670.6 MB | 71.5 MB |
| Events in quadrant A | 10,908,459 | 311,901 |
| Events in quadrant B | 3,163,619 | 511,068 |
| Events in quadrant C | 2,997,721 | 511,643 |
| Events in quadrant D | 3,790,297 | 485,415 |
| Mode SS | |||
|---|---|---|---|
| Quadrant | BADHDUFLAG | Total packets | Discarded packets |
| A | 0 | 132 | 0 |
| B | 0 | 132 | 0 |
| C | 0 | 132 | 0 |
| D | 0 | 132 | 0 |
| Mode M9 | |||
|---|---|---|---|
| Quadrant | BADHDUFLAG | Total packets | Discarded packets |
| A | 0 | 10 | 0 |
| B | 0 | 10 | 0 |
| C | 0 | 10 | 0 |
| D | 0 | 10 | 0 |
| Mode M0 | |||
|---|---|---|---|
| Quadrant | BADHDUFLAG | Total packets | Discarded packets |
| A | 0 | 36777 | 18 |
| B | 0 | 13442 | 3 |
| C | 0 | 13227 | 3 |
| D | 0 | 15595 | 1 |
| Quadrant | Total seconds | Saturated seconds | Saturation percentage |
|---|---|---|---|
| A | 6419 | 3325 | 51.799346% |
| B | 6420 | 63 | 0.981308% |
| C | 6420 | 41 | 0.638629% |
| D | 6421 | 189 | 2.943467% |
Noise dominated data is calculated using 1-second bins in cleaned event files. If a bin has >2000 counts, and if more than 50% of those come from <1% of pixels, then it is considered to be noise-dominated and hence unusable.
| Quadrant | # 1 sec bins | Bins with >0 counts | Bins with >2000 counts | High rate bins dominated by noise | Noise dominated (total time) | Noise dominated (detector-on time) | Marked lightcurve |
|---|---|---|---|---|---|---|---|
| A | 7476 | 6420 | 2903 | 2903 | 38.83% | 45.22% | 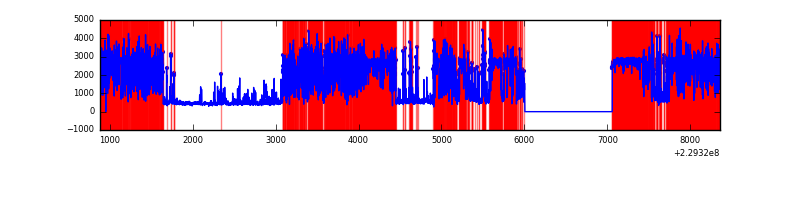 |
| B | 7476 | 6421 | 18 | 18 | 0.24% | 0.28% | 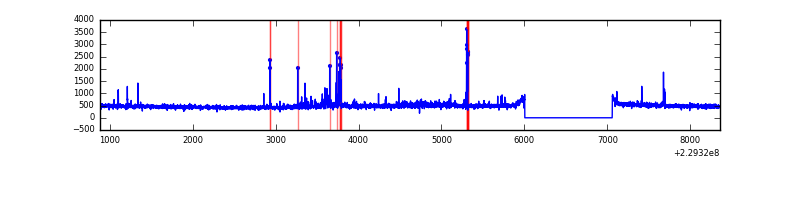 |
| C | 7476 | 6422 | 20 | 20 | 0.27% | 0.31% | 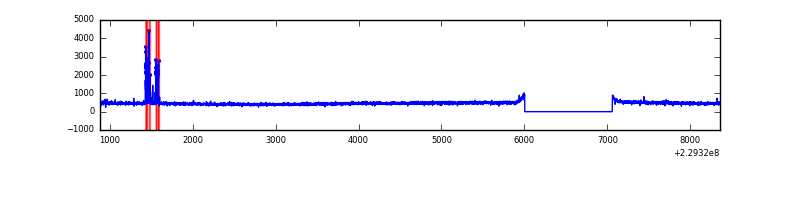 |
| D | 7476 | 6422 | 143 | 143 | 1.91% | 2.23% | 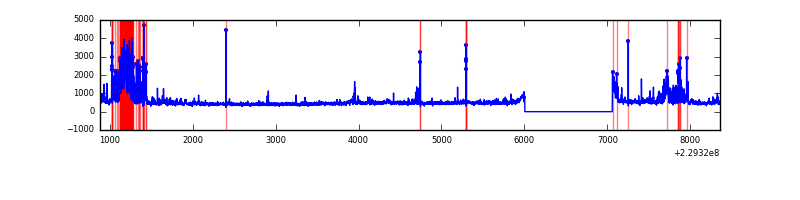 |
Top three noisy pixels from each quadrant. If the there are fewer than three noisy pixels in the level2.evt file, extra rows are filled as -1
| Pixel properties | Quadrant properties | ||||||
|---|---|---|---|---|---|---|---|
| Quadrant | DetID | PixID | Counts | Sigma | Mean | Median | Sigma |
| A | 0 | 128 | 8804046 | 79181.74 | 544 | 532 | 111.2 |
| A | 13 | 248 | 10785 | 92.22 | 544 | 532 | 111.2 |
| A | 0 | 226 | 4914 | 39.41 | 544 | 532 | 111.2 |
| B | 11 | 51 | 61550 | 407.21 | 770 | 752 | 149.3 |
| B | 0 | 214 | 49469 | 326.3 | 770 | 752 | 149.3 |
| B | 10 | 252 | 48630 | 320.68 | 770 | 752 | 149.3 |
| C | 9 | 54 | 87205 | 498.94 | 746 | 750 | 173.3 |
| C | 13 | 61 | 5639 | 28.21 | 746 | 750 | 173.3 |
| C | 12 | 4 | 3228 | 14.3 | 746 | 750 | 173.3 |
| D | 1 | 52 | 647385 | 3625.94 | 743 | 725 | 178.3 |
| D | 12 | 233 | 188800 | 1054.57 | 743 | 725 | 178.3 |
| D | 2 | 136 | 106824 | 594.92 | 743 | 725 | 178.3 |
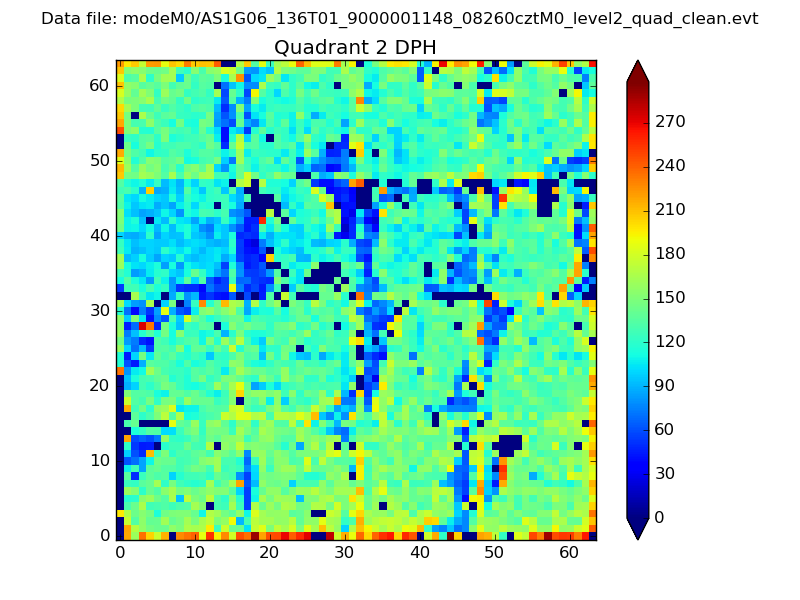
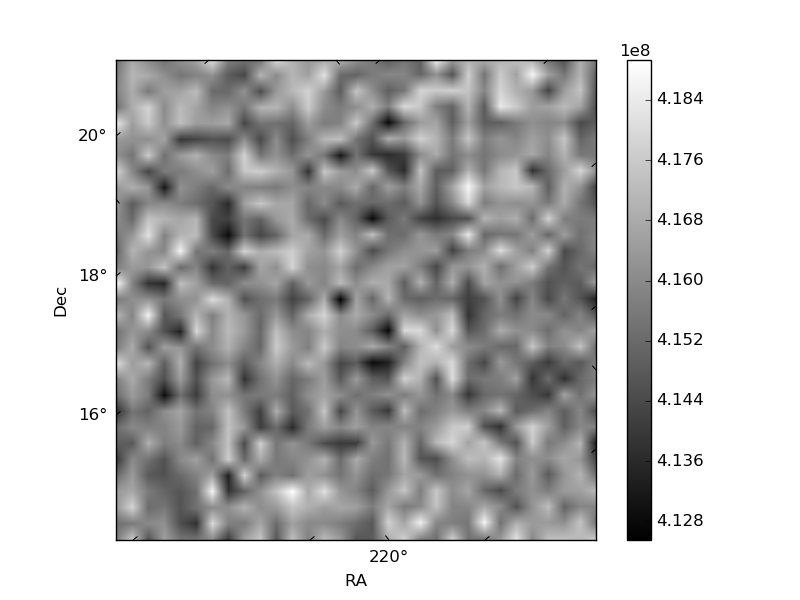
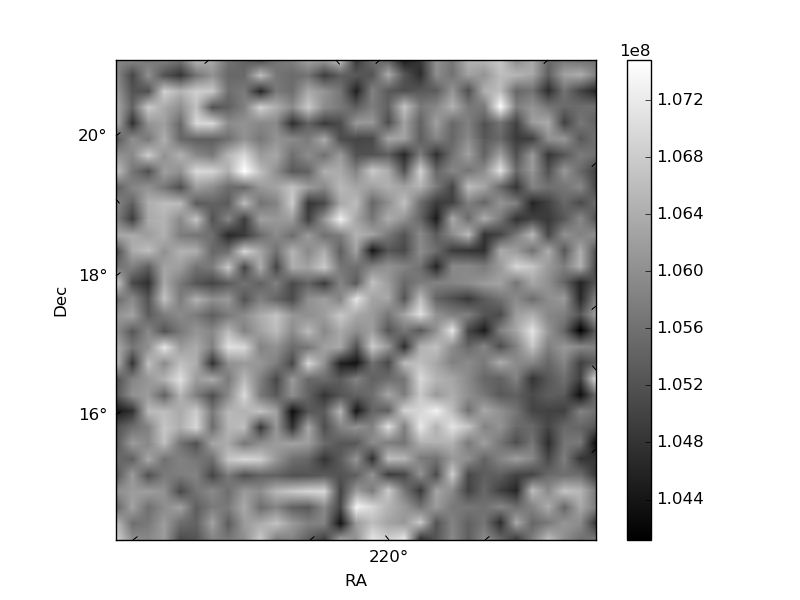
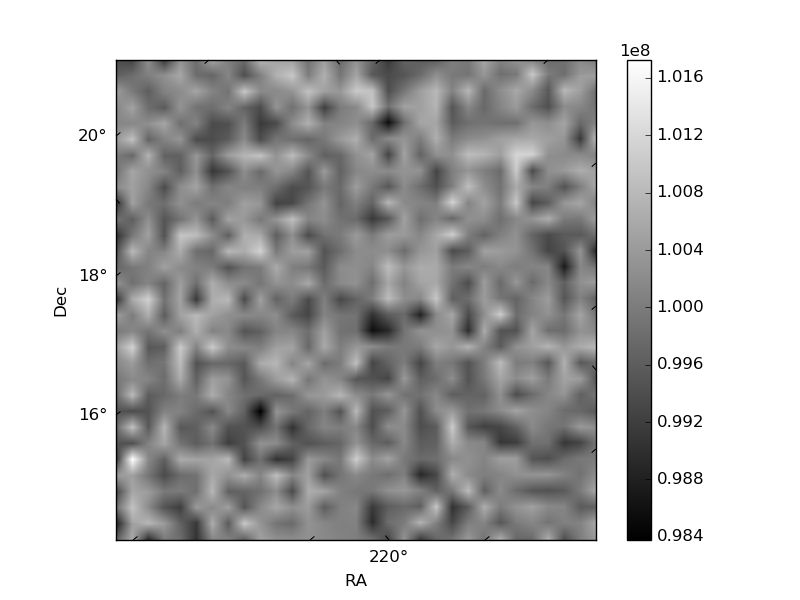
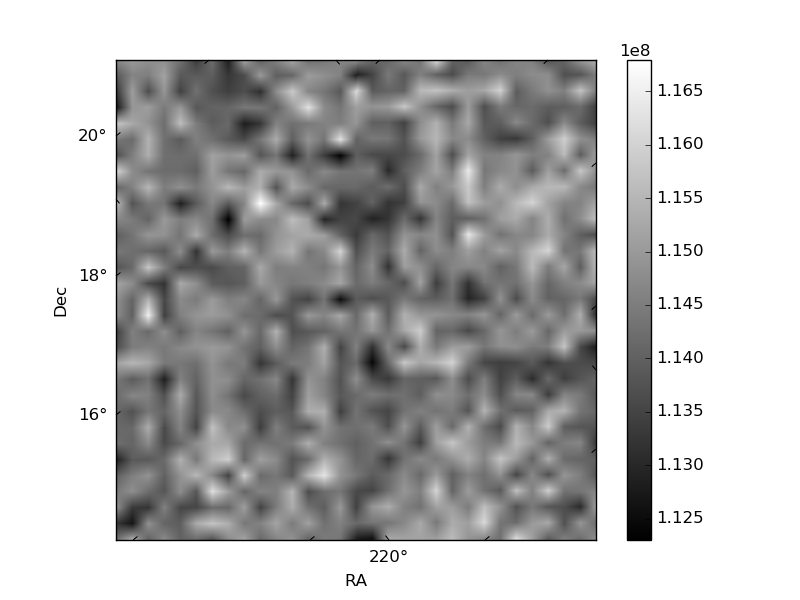
Histogram calculated using DETX and DETY for each event in the final _common_clean file
| Quadrant A | 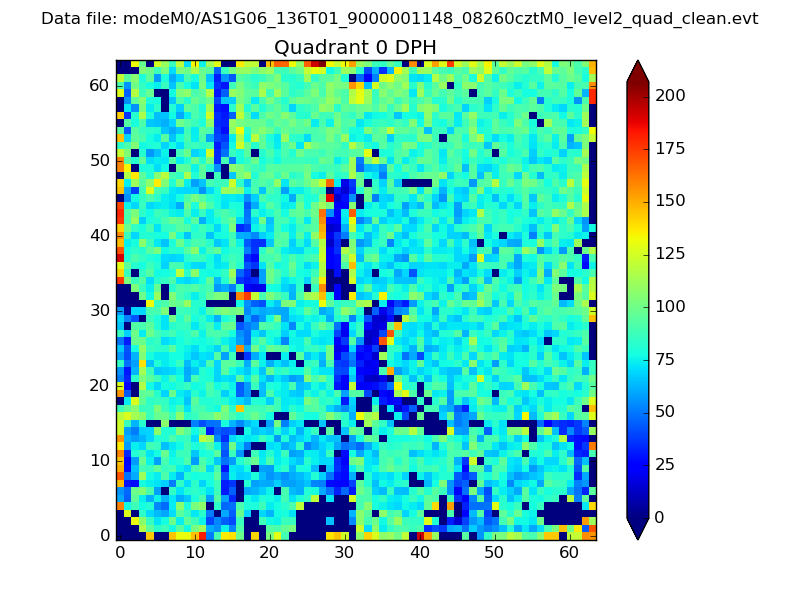 |
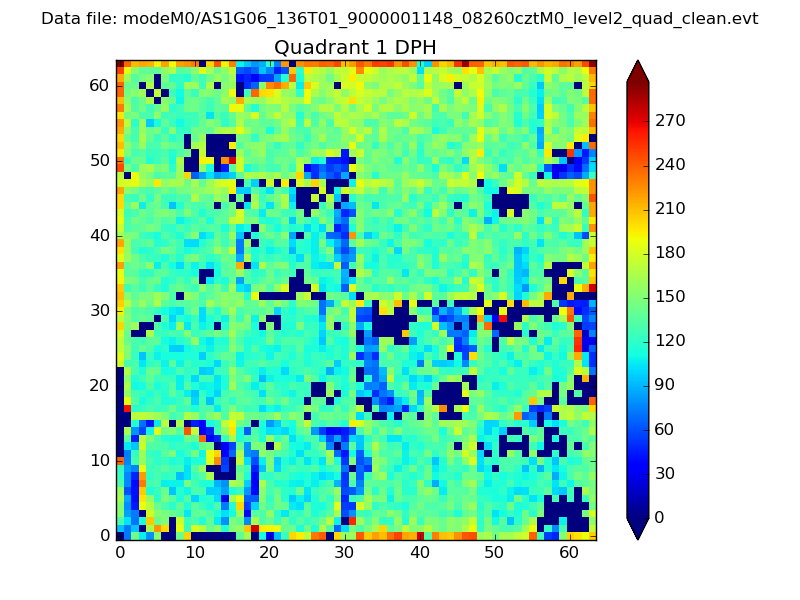 |
Quadrant B |
|---|---|---|---|
| Quadrant D | 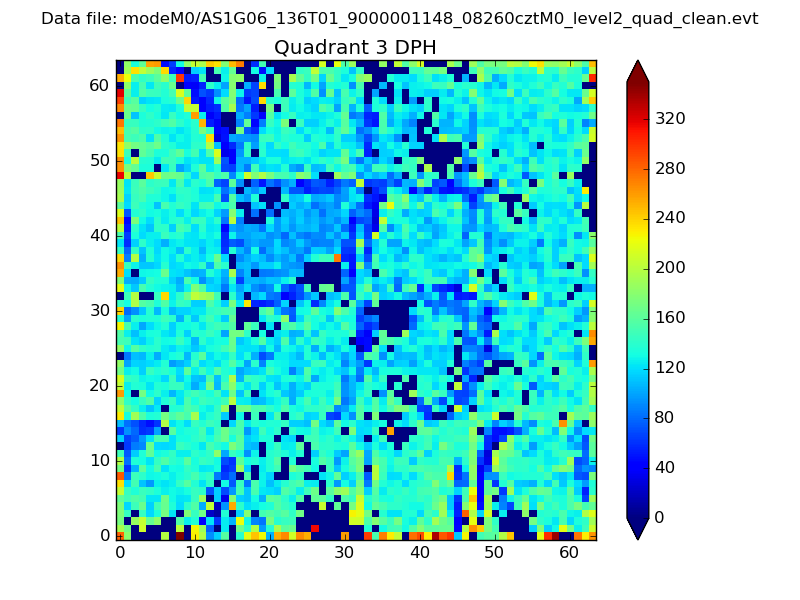 |
 |
Quadrant C |
| Plot type | Count rate plots | Images |
|---|---|---|
| Comparison with Poisson distribution Blue bars denote a histogram of data divided into 1 sec bins. Red curve is a Poisson curve with rate = median count rate of data. |
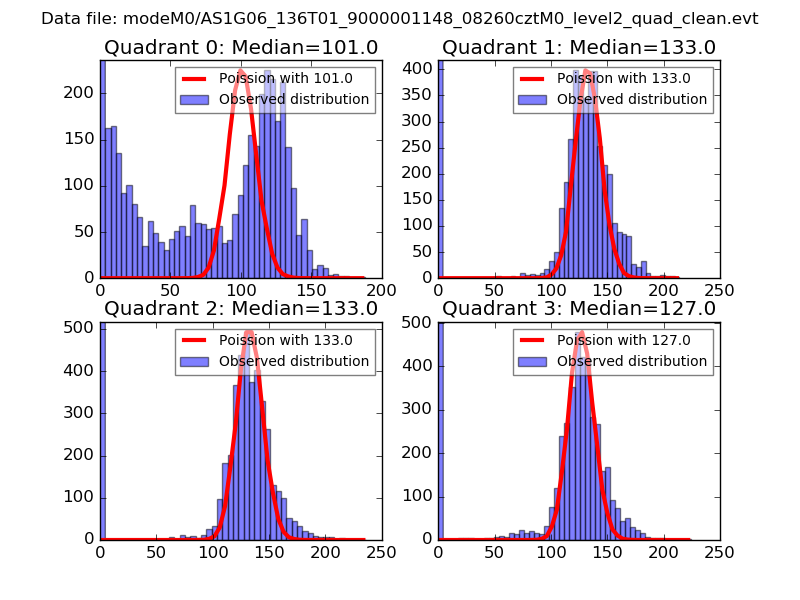 |
 |
| Quadrant-wise count rates Data is divided into 100 sec bins |
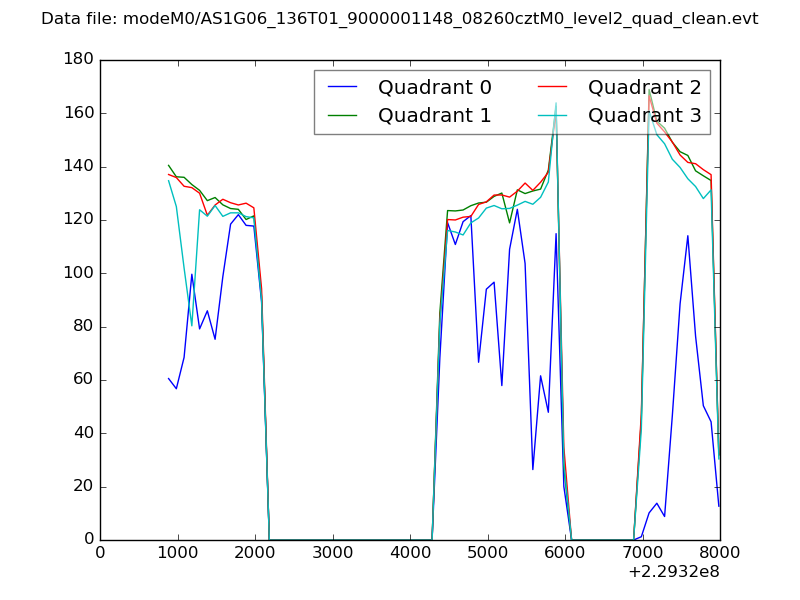 |
|
| Module-wise count rates for Quadrant A Data is divided into 100 sec bins |
 |
 |
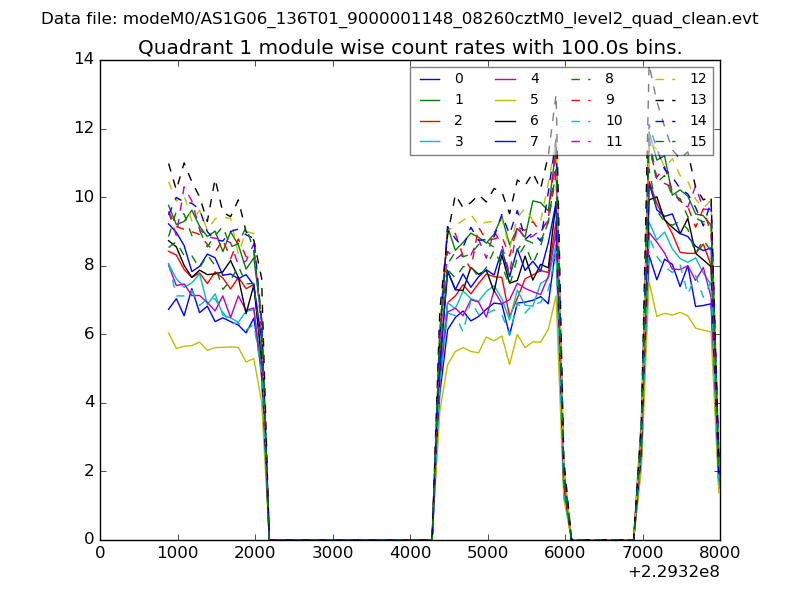
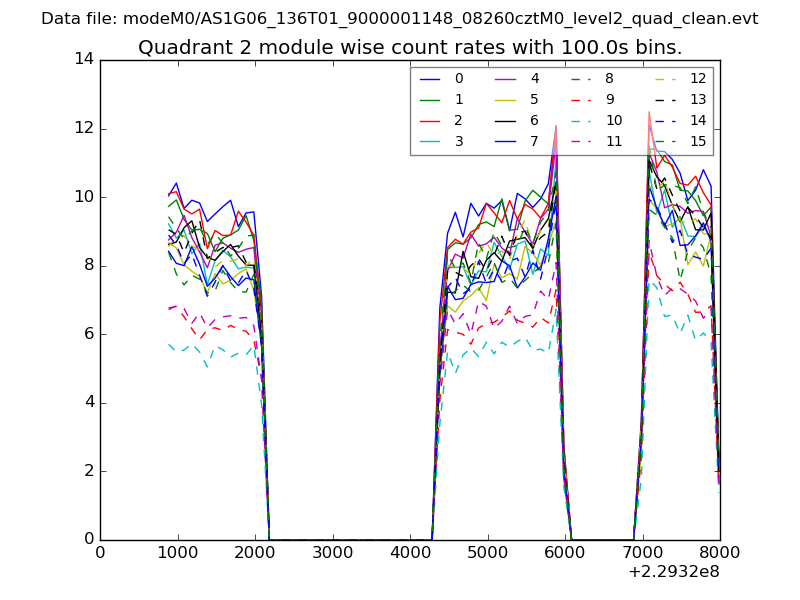
| Module-wise count rates for Quadrant B Data is divided into 100 sec bins |
 |
 |
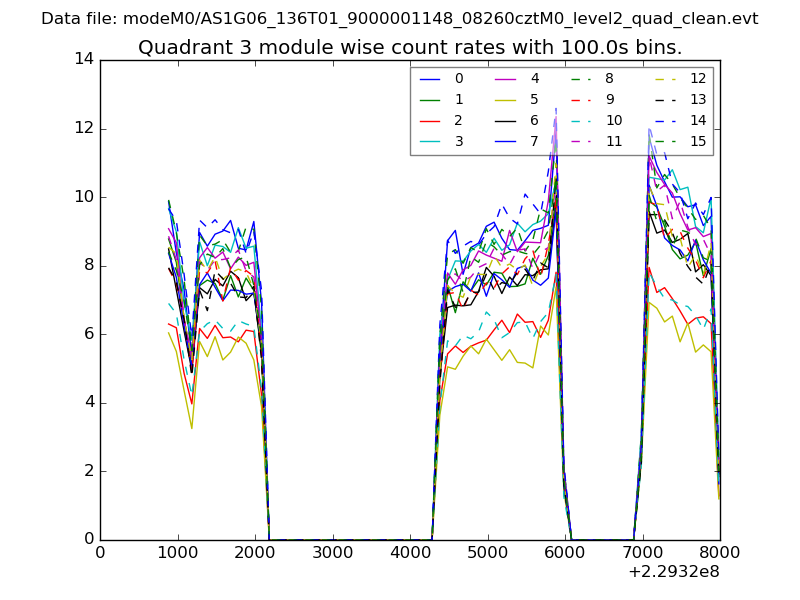
| Module-wise count rates for Quadrant C Data is divided into 100 sec bins |
 |
 |
| Module-wise count rates for Quadrant D Data is divided into 100 sec bins |
 |
 |
| Parameter | Plot |
|---|---|
| CZT HV Monitor | 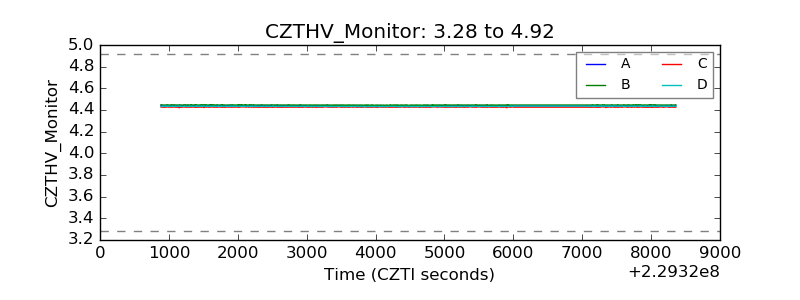 |
| D_VDD |  |
| Temperature 1 |  |
| Veto HV Monitor | 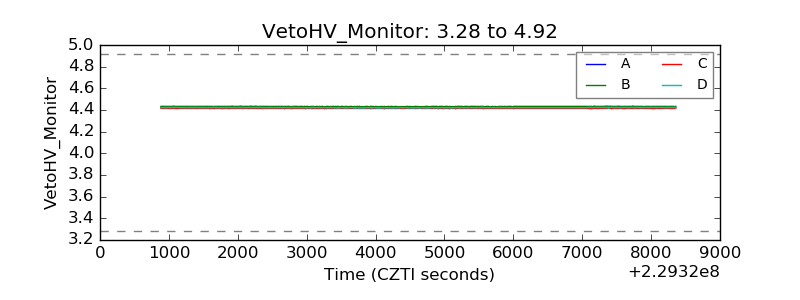 |
| Veto LLD | 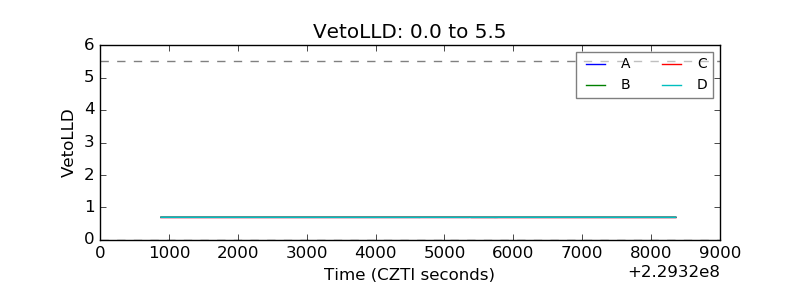 |
| Alpha Counter | 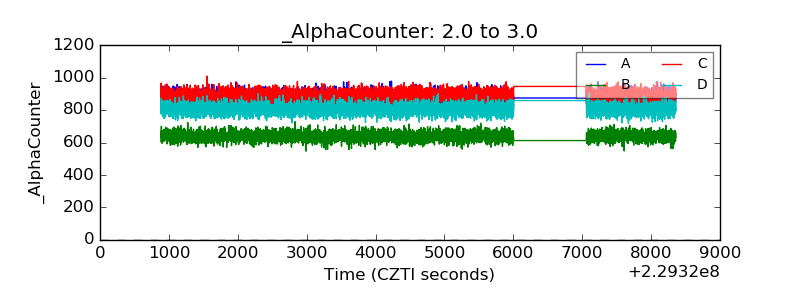 |
| _CPM_Rate | 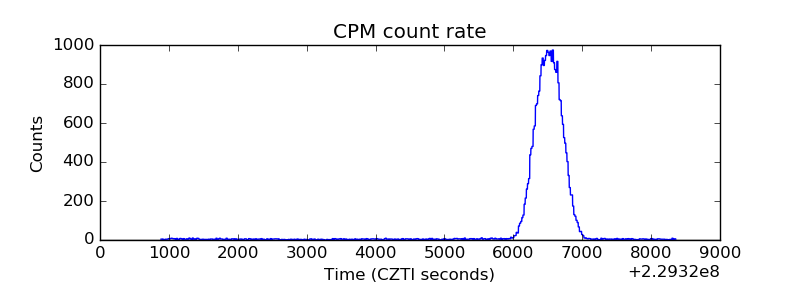 |
| CZT Counter | 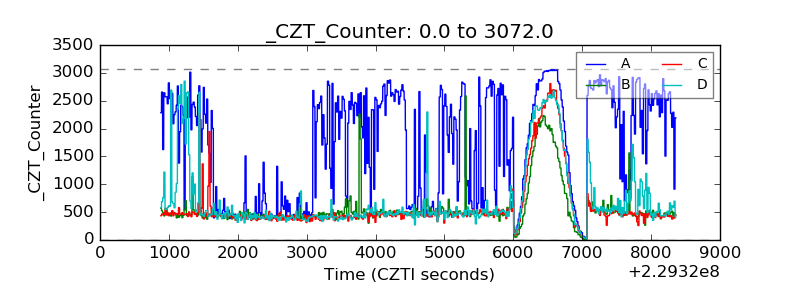 |
| +2.5 Volts monitor |  |
| +5 Volts monitor |  |
| _ROLL_ROT | 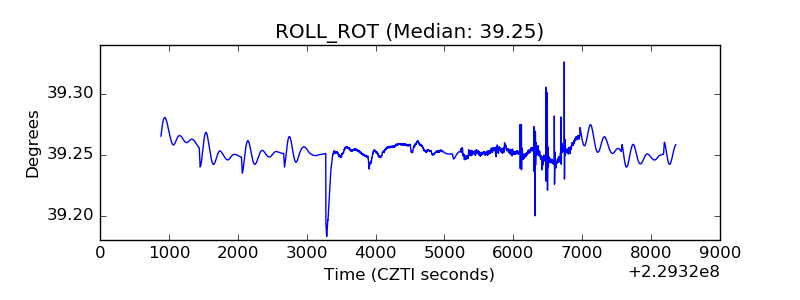 |
| _Roll_DEC |  |
| _Roll_RA | 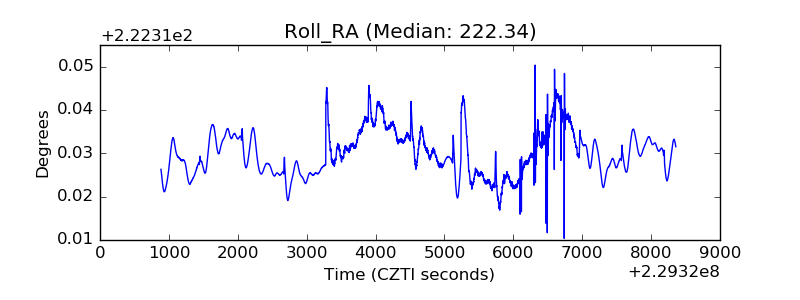 |
| Veto Counter | 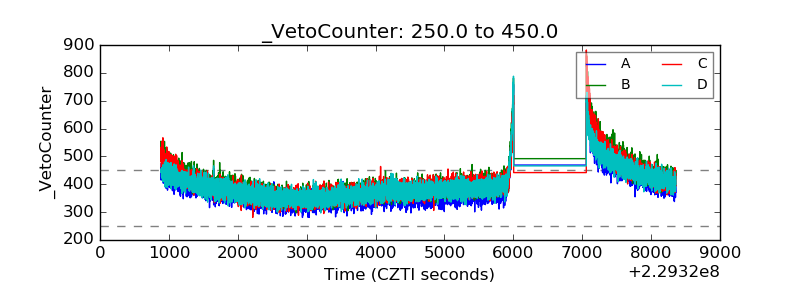 |