| Param | Original file | Final file |
|---|---|---|
| Filename | modeM0/AS1G06_136T01_9000001148_08262cztM0_level2.evt | modeM0/AS1G06_136T01_9000001148_08262cztM0_level2_quad_clean.evt |
| Size (bytes) | 623,321,280 | 74,822,400 |
| Size | 594.4 MB | 71.4 MB |
| Events in quadrant A | 7,799,506 | 382,040 |
| Events in quadrant B | 3,315,923 | 482,305 |
| Events in quadrant C | 3,141,274 | 481,325 |
| Events in quadrant D | 4,172,089 | 457,955 |
| Mode SS | |||
|---|---|---|---|
| Quadrant | BADHDUFLAG | Total packets | Discarded packets |
| A | 0 | 134 | 0 |
| B | 0 | 134 | 0 |
| C | 0 | 134 | 0 |
| D | 0 | 134 | 0 |
| Mode M9 | |||
|---|---|---|---|
| Quadrant | BADHDUFLAG | Total packets | Discarded packets |
| A | 0 | 12 | 0 |
| B | 0 | 12 | 0 |
| C | 0 | 12 | 0 |
| D | 0 | 12 | 0 |
| Mode M0 | |||
|---|---|---|---|
| Quadrant | BADHDUFLAG | Total packets | Discarded packets |
| A | 0 | 27535 | 3 |
| B | 0 | 13828 | 2 |
| C | 0 | 13594 | 2 |
| D | 0 | 16681 | 2 |
| Quadrant | Total seconds | Saturated seconds | Saturation percentage |
|---|---|---|---|
| A | 6620 | 1828 | 27.613293% |
| B | 6620 | 80 | 1.208459% |
| C | 6620 | 42 | 0.634441% |
| D | 6620 | 215 | 3.247734% |
Noise dominated data is calculated using 1-second bins in cleaned event files. If a bin has >2000 counts, and if more than 50% of those come from <1% of pixels, then it is considered to be noise-dominated and hence unusable.
| Quadrant | # 1 sec bins | Bins with >0 counts | Bins with >2000 counts | High rate bins dominated by noise | Noise dominated (total time) | Noise dominated (detector-on time) | Marked lightcurve |
|---|---|---|---|---|---|---|---|
| A | 7745 | 6620 | 1522 | 1522 | 19.65% | 22.99% | 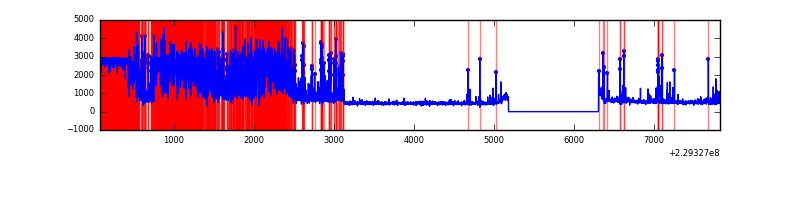 |
| B | 7745 | 6620 | 1 | 1 | 0.01% | 0.02% | 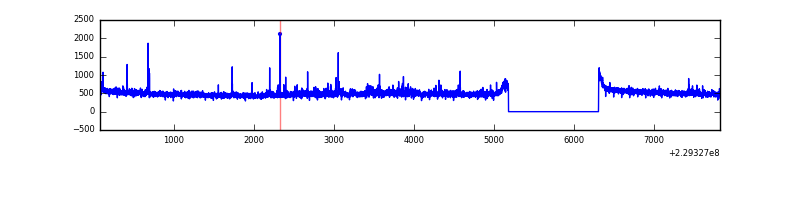 |
| C | 7745 | 6620 | 0 | 0 | 0.00% | 0.00% | 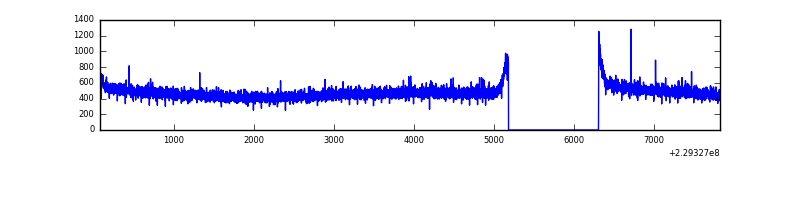 |
| D | 7745 | 6620 | 133 | 133 | 1.72% | 2.01% | 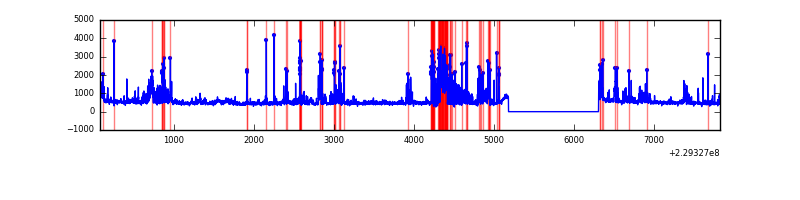 |
Top three noisy pixels from each quadrant. If the there are fewer than three noisy pixels in the level2.evt file, extra rows are filled as -1
| Pixel properties | Quadrant properties | ||||||
|---|---|---|---|---|---|---|---|
| Quadrant | DetID | PixID | Counts | Sigma | Mean | Median | Sigma |
| A | 0 | 128 | 5074837 | 35499.23 | 705 | 689 | 142.9 |
| A | 13 | 248 | 9152 | 59.21 | 705 | 689 | 142.9 |
| A | 0 | 226 | 6680 | 41.91 | 705 | 689 | 142.9 |
| B | 11 | 51 | 34326 | 209.79 | 832 | 814 | 159.7 |
| B | 12 | 111 | 17625 | 105.24 | 832 | 814 | 159.7 |
| B | 0 | 214 | 16886 | 100.61 | 832 | 814 | 159.7 |
| C | 13 | 61 | 6114 | 28.52 | 804 | 810 | 186.0 |
| C | 12 | 4 | 3189 | 12.79 | 804 | 810 | 186.0 |
| C | 3 | 202 | 2023 | 6.52 | 804 | 810 | 186.0 |
| D | 1 | 52 | 822748 | 4301.32 | 804 | 786 | 191.1 |
| D | 2 | 136 | 141648 | 737.13 | 804 | 786 | 191.1 |
| D | 7 | 71 | 70729 | 366.01 | 804 | 786 | 191.1 |
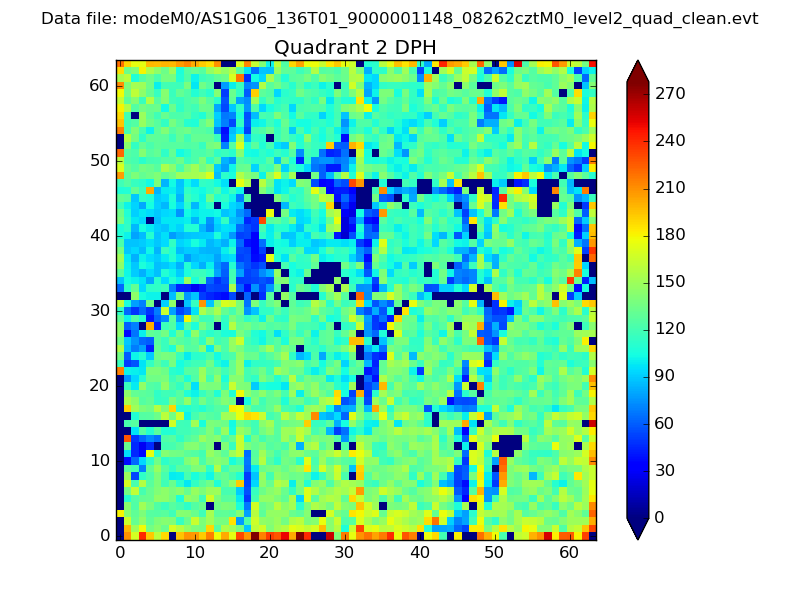
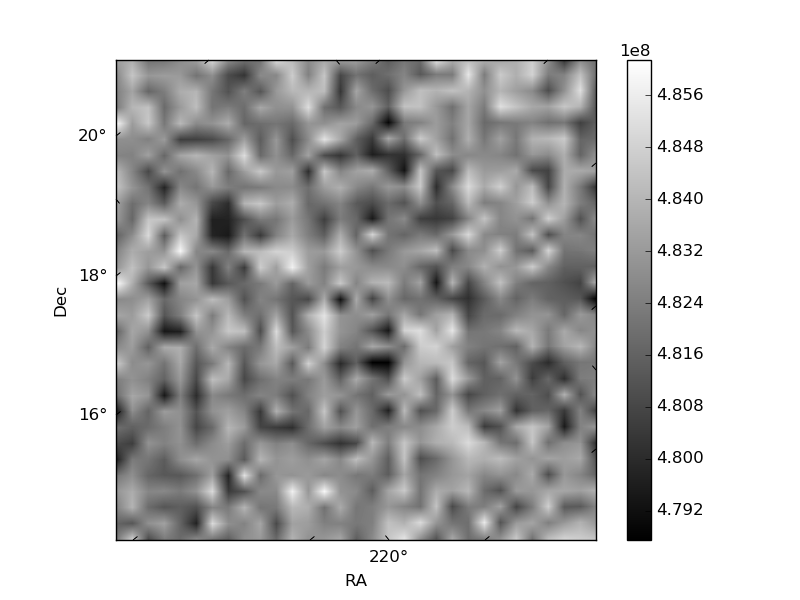
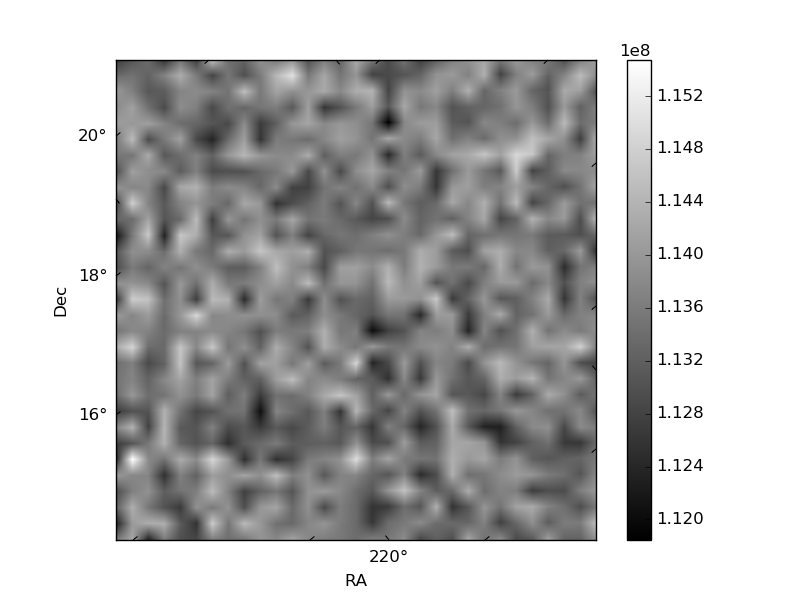
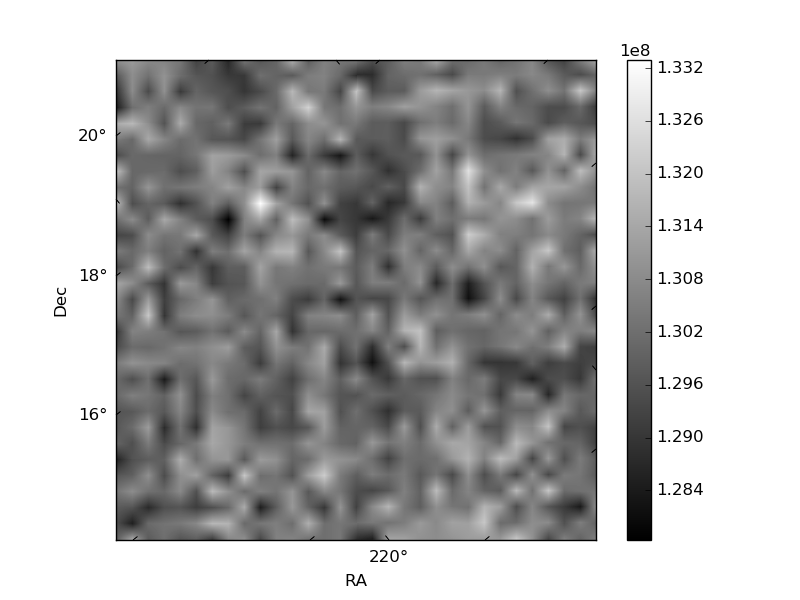
Histogram calculated using DETX and DETY for each event in the final _common_clean file
| Quadrant A | 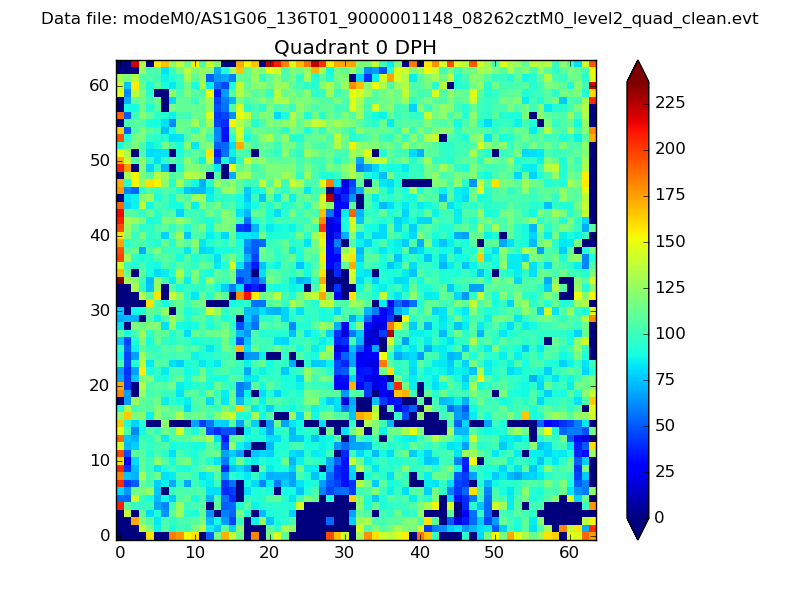 |
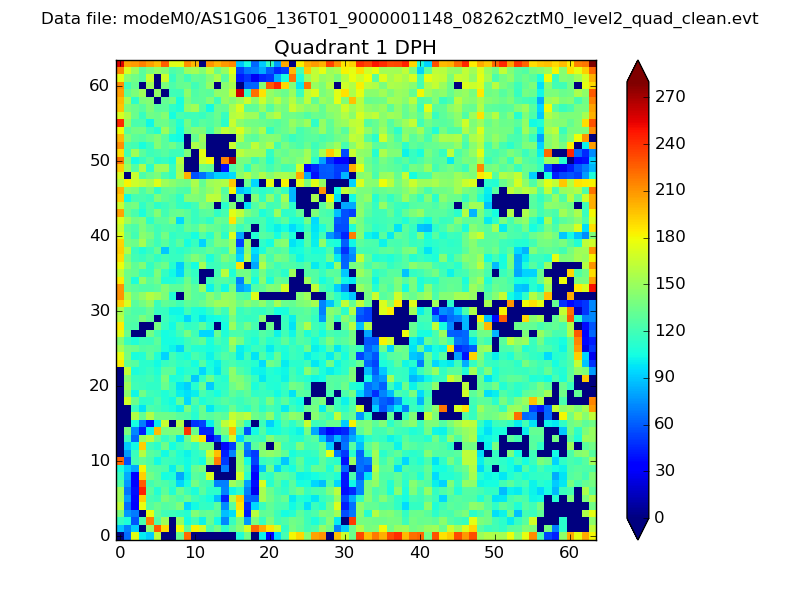 |
Quadrant B |
|---|---|---|---|
| Quadrant D | 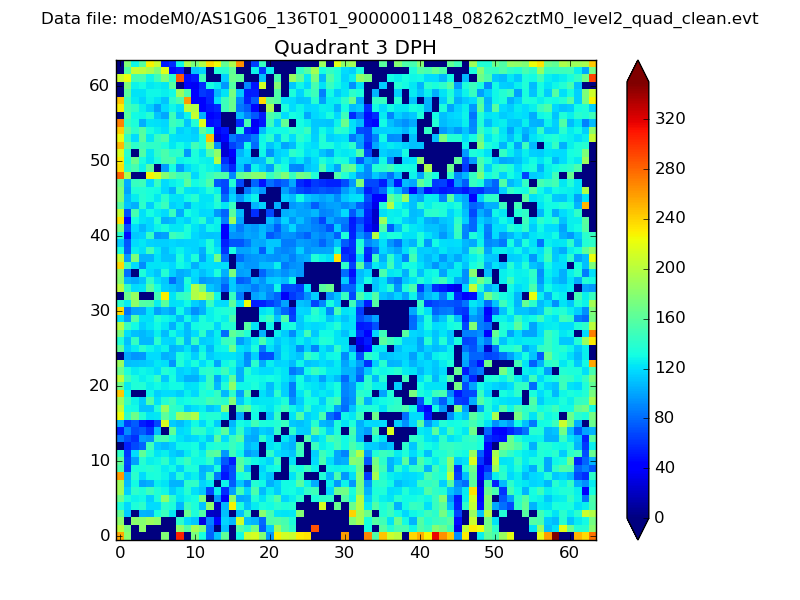 |
 |
Quadrant C |
| Plot type | Count rate plots | Images |
|---|---|---|
| Comparison with Poisson distribution Blue bars denote a histogram of data divided into 1 sec bins. Red curve is a Poisson curve with rate = median count rate of data. |
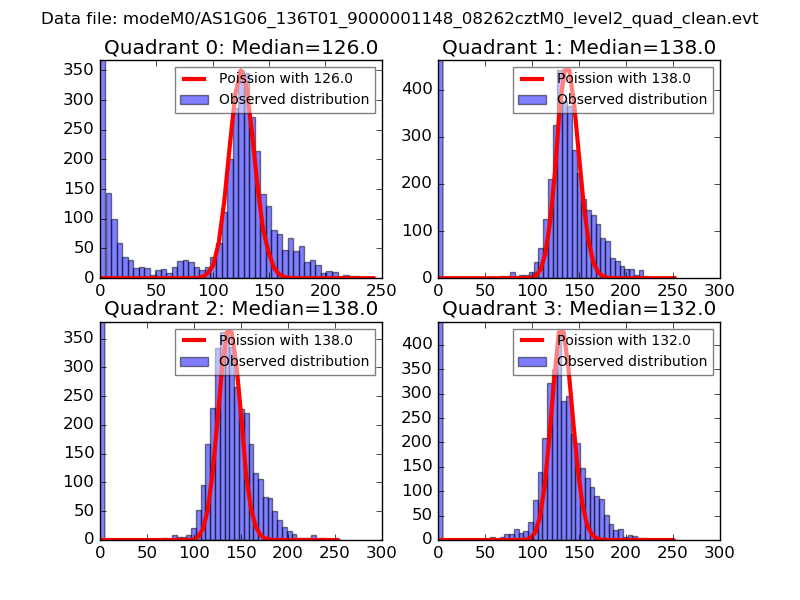 |
 |
| Quadrant-wise count rates Data is divided into 100 sec bins |
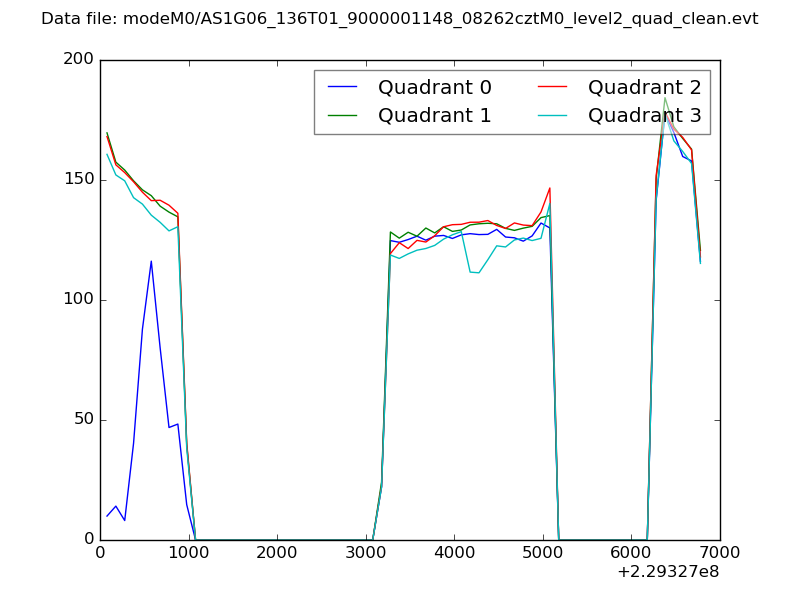 |
|
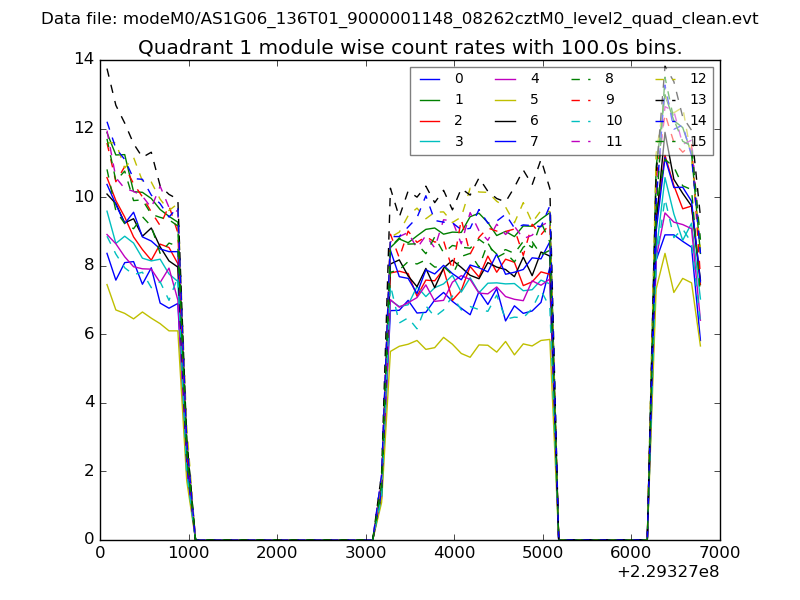
| Module-wise count rates for Quadrant A Data is divided into 100 sec bins |
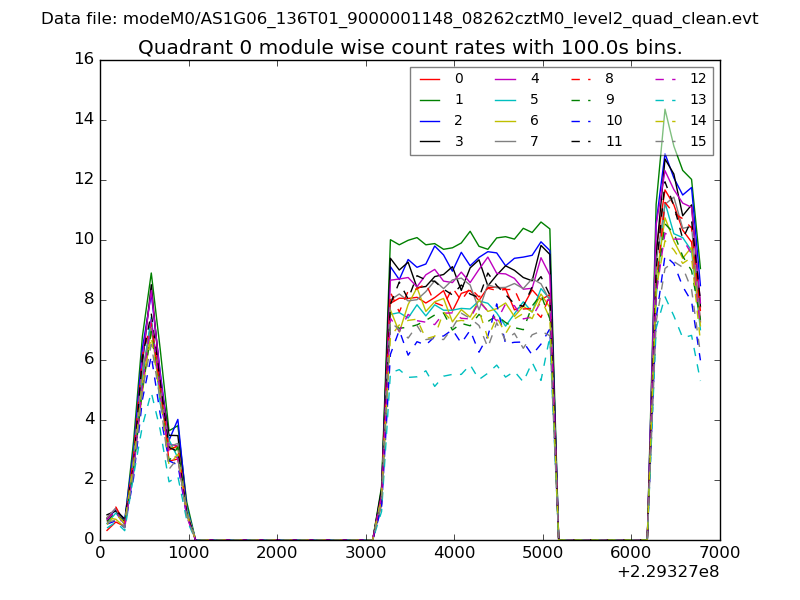 |
 |
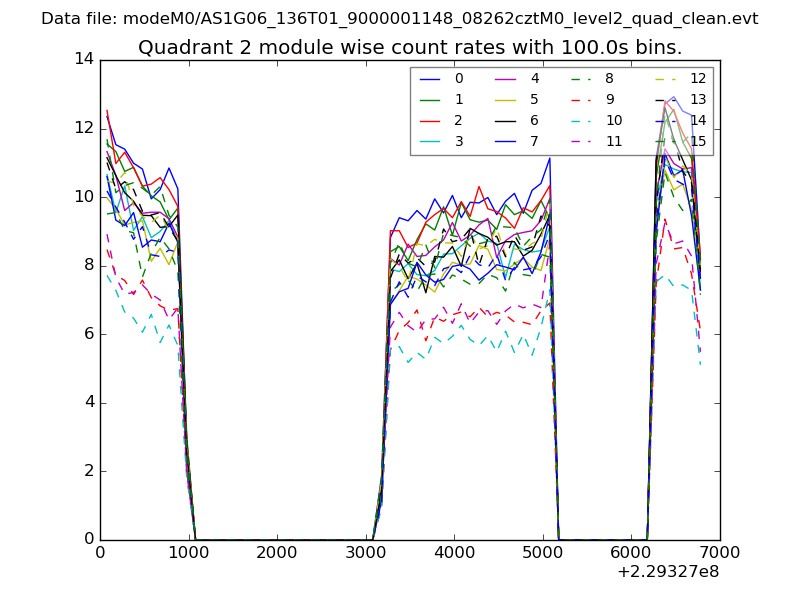
| Module-wise count rates for Quadrant B Data is divided into 100 sec bins |
 |
 |
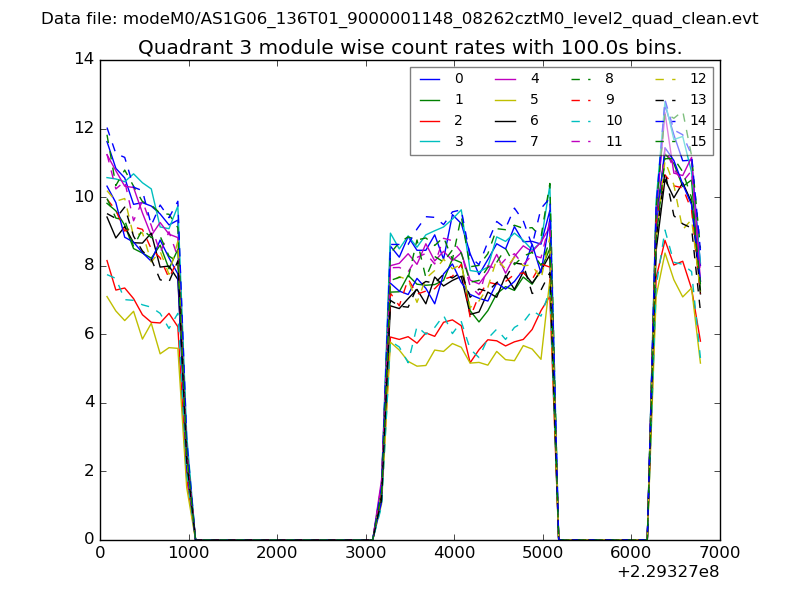
| Module-wise count rates for Quadrant C Data is divided into 100 sec bins |
 |
 |
| Module-wise count rates for Quadrant D Data is divided into 100 sec bins |
 |
 |
| Parameter | Plot |
|---|---|
| CZT HV Monitor | 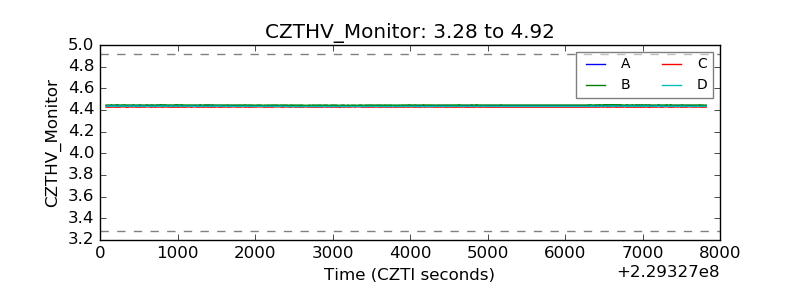 |
| D_VDD | 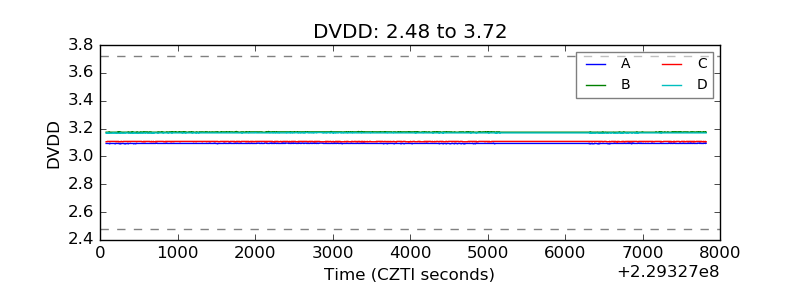 |
| Temperature 1 |  |
| Veto HV Monitor | 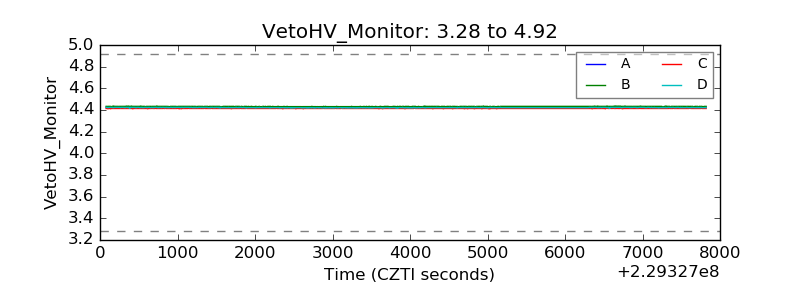 |
| Veto LLD | 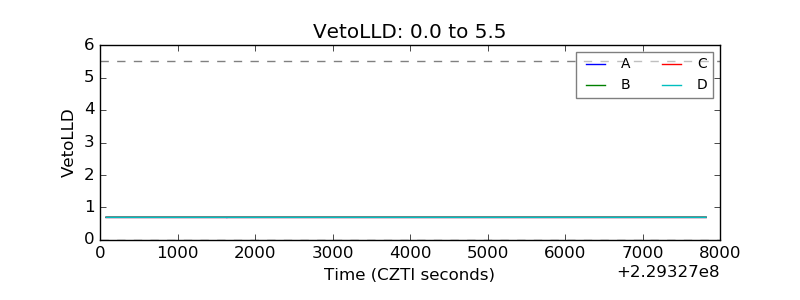 |
| Alpha Counter | 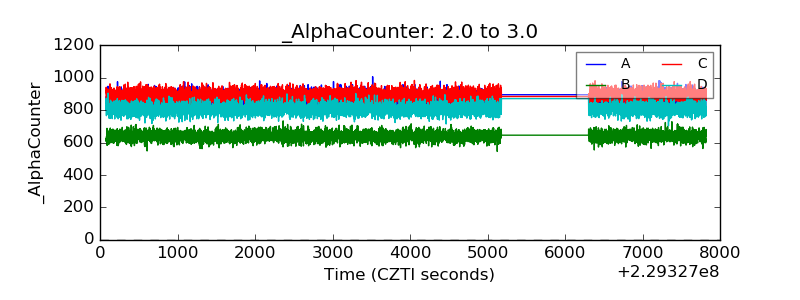 |
| _CPM_Rate | 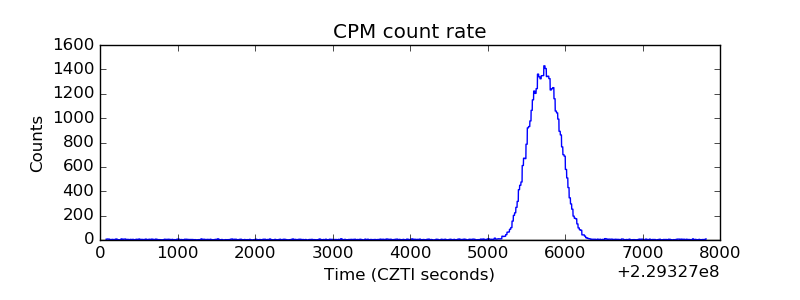 |
| CZT Counter | 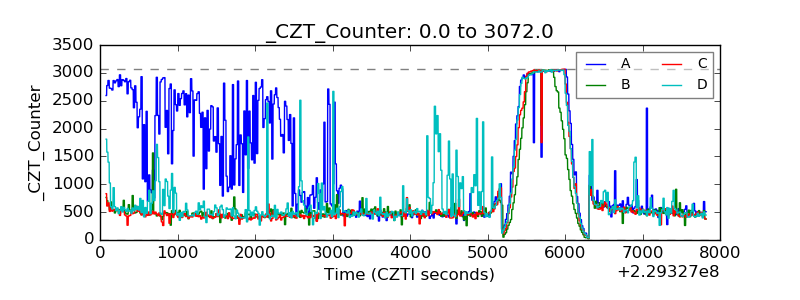 |
| +2.5 Volts monitor |  |
| +5 Volts monitor | 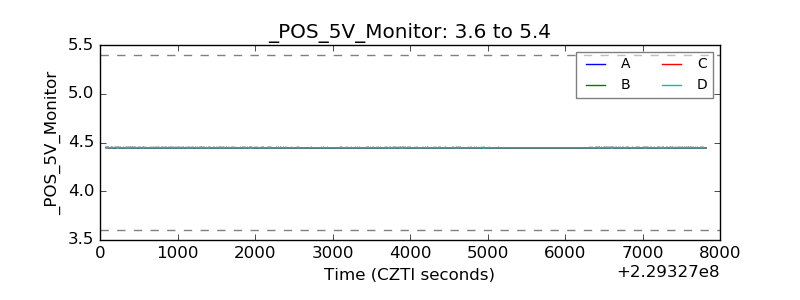 |
| _ROLL_ROT |  |
| _Roll_DEC | 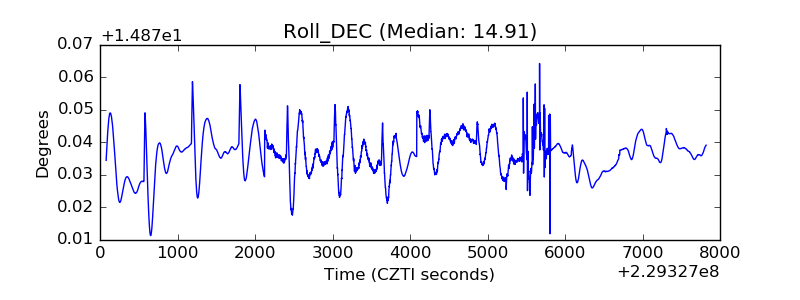 |
| _Roll_RA | 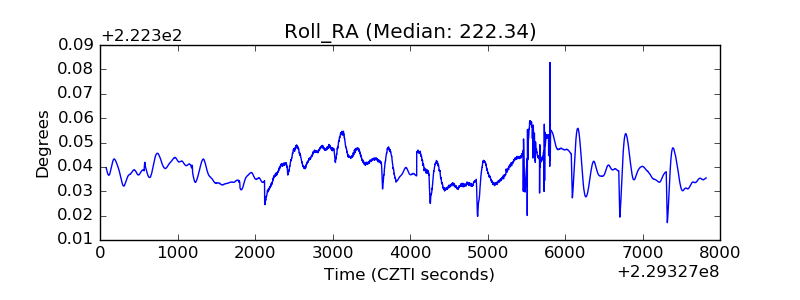 |
| Veto Counter | 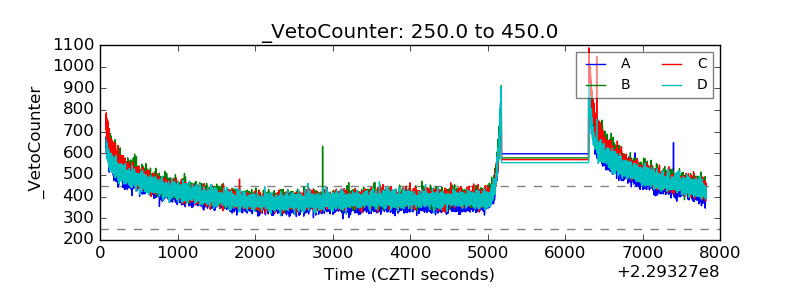 |