| Param | Original file | Final file |
|---|---|---|
| Filename | modeM0/AS1G06_136T01_9000001148_08265cztM0_level2.evt | modeM0/AS1G06_136T01_9000001148_08265cztM0_level2_quad_clean.evt |
| Size (bytes) | 466,021,440 | 68,400,000 |
| Size | 444.4 MB | 65.2 MB |
| Events in quadrant A | 3,270,914 | 403,054 |
| Events in quadrant B | 3,369,290 | 409,693 |
| Events in quadrant C | 3,233,508 | 411,181 |
| Events in quadrant D | 3,803,532 | 399,176 |
| Mode SS | |||
|---|---|---|---|
| Quadrant | BADHDUFLAG | Total packets | Discarded packets |
| A | 0 | 130 | 0 |
| B | 0 | 130 | 0 |
| C | 0 | 130 | 0 |
| D | 0 | 130 | 0 |
| Mode M9 | |||
|---|---|---|---|
| Quadrant | BADHDUFLAG | Total packets | Discarded packets |
| A | 0 | 23 | 0 |
| B | 0 | 23 | 0 |
| C | 0 | 23 | 0 |
| D | 0 | 24 | 0 |
| Mode M0 | |||
|---|---|---|---|
| Quadrant | BADHDUFLAG | Total packets | Discarded packets |
| A | 0 | 13656 | 3 |
| B | 0 | 13873 | 2 |
| C | 0 | 13543 | 2 |
| D | 0 | 15442 | 2 |
| Quadrant | Total seconds | Saturated seconds | Saturation percentage |
|---|---|---|---|
| A | 6421 | 122 | 1.900016% |
| B | 6421 | 140 | 2.180346% |
| C | 6421 | 88 | 1.370503% |
| D | 6421 | 148 | 2.304937% |
Noise dominated data is calculated using 1-second bins in cleaned event files. If a bin has >2000 counts, and if more than 50% of those come from <1% of pixels, then it is considered to be noise-dominated and hence unusable.
| Quadrant | # 1 sec bins | Bins with >0 counts | Bins with >2000 counts | High rate bins dominated by noise | Noise dominated (total time) | Noise dominated (detector-on time) | Marked lightcurve |
|---|---|---|---|---|---|---|---|
| A | 7646 | 6421 | 2 | 2 | 0.03% | 0.03% | 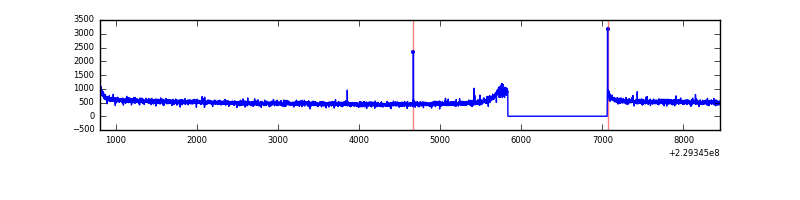 |
| B | 7646 | 6421 | 5 | 5 | 0.07% | 0.08% | 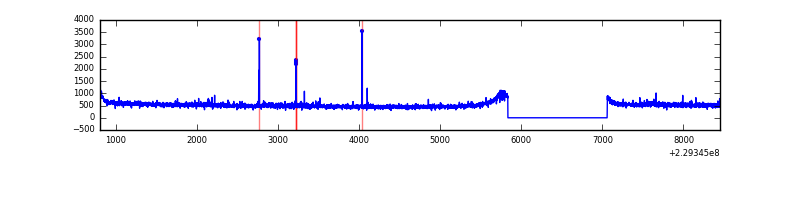 |
| C | 7646 | 6421 | 0 | 0 | 0.00% | 0.00% | 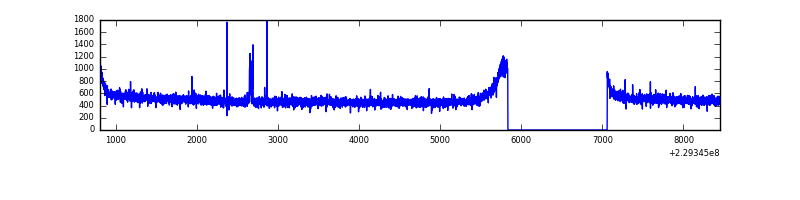 |
| D | 7646 | 6421 | 43 | 43 | 0.56% | 0.67% | 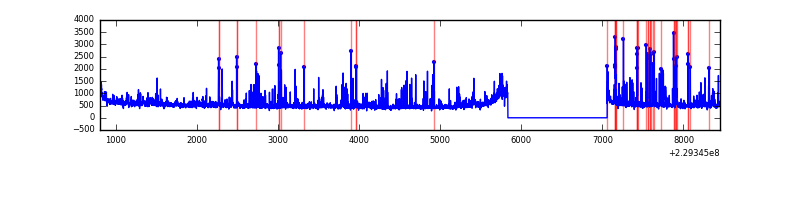 |
Top three noisy pixels from each quadrant. If the there are fewer than three noisy pixels in the level2.evt file, extra rows are filled as -1
| Pixel properties | Quadrant properties | ||||||
|---|---|---|---|---|---|---|---|
| Quadrant | DetID | PixID | Counts | Sigma | Mean | Median | Sigma |
| A | 0 | 254 | 13325 | 73.05 | 847 | 830 | 171.0 |
| A | 0 | 226 | 7777 | 40.62 | 847 | 830 | 171.0 |
| A | 12 | 194 | 7275 | 37.68 | 847 | 830 | 171.0 |
| B | 11 | 51 | 39874 | 240.03 | 846 | 828 | 162.7 |
| B | 0 | 214 | 32692 | 195.88 | 846 | 828 | 162.7 |
| B | 12 | 111 | 17747 | 104.01 | 846 | 828 | 162.7 |
| C | 9 | 54 | 18625 | 93.33 | 824 | 832 | 190.6 |
| C | 13 | 61 | 6241 | 28.37 | 824 | 832 | 190.6 |
| C | 3 | 202 | 2120 | 6.76 | 824 | 832 | 190.6 |
| D | 13 | 105 | 462873 | 2348.21 | 825 | 807 | 196.8 |
| D | 1 | 52 | 130068 | 656.9 | 825 | 807 | 196.8 |
| D | 2 | 152 | 52346 | 261.92 | 825 | 807 | 196.8 |
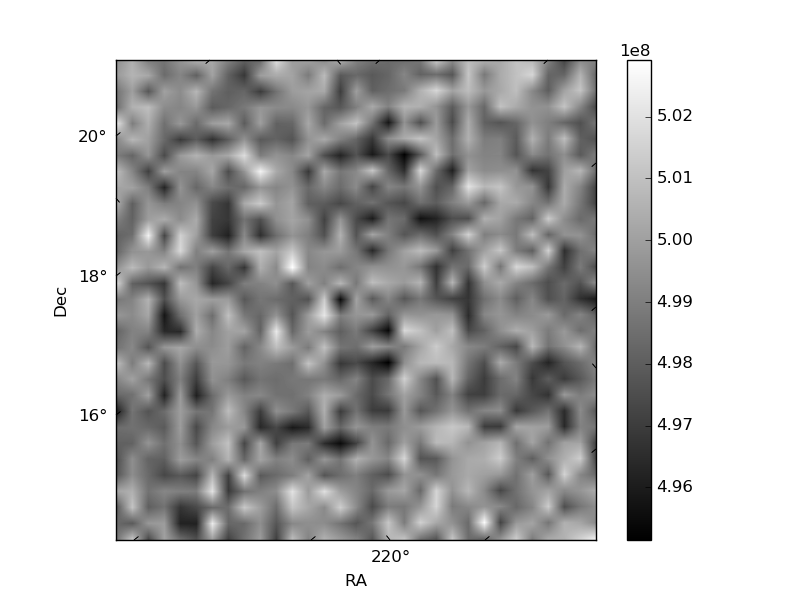
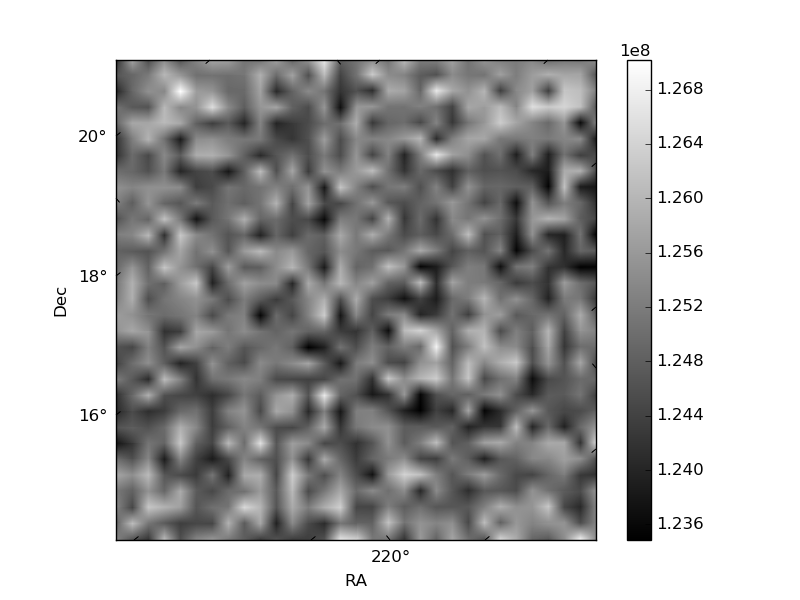
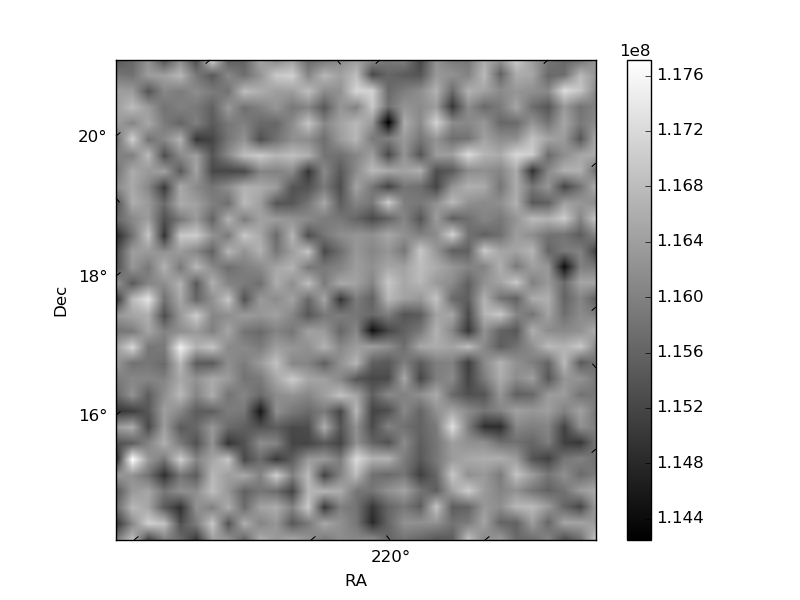
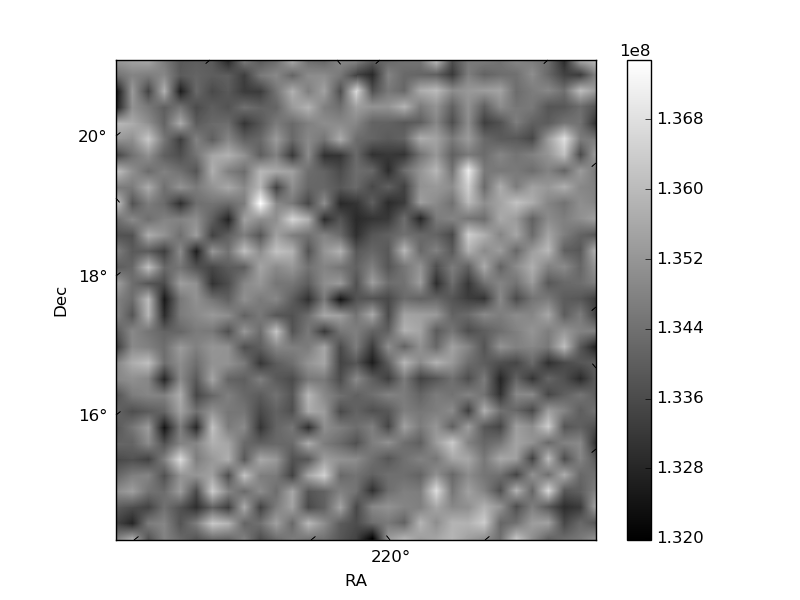
Histogram calculated using DETX and DETY for each event in the final _common_clean file
| Quadrant A | 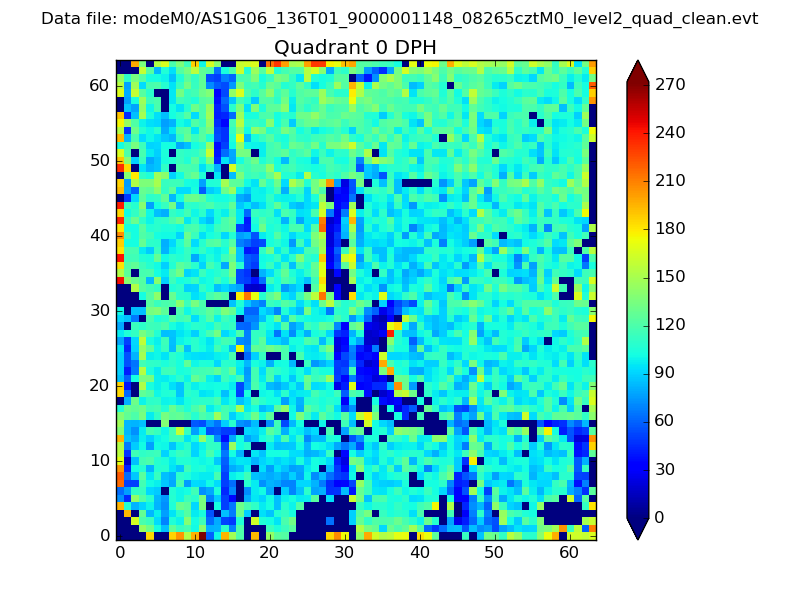 |
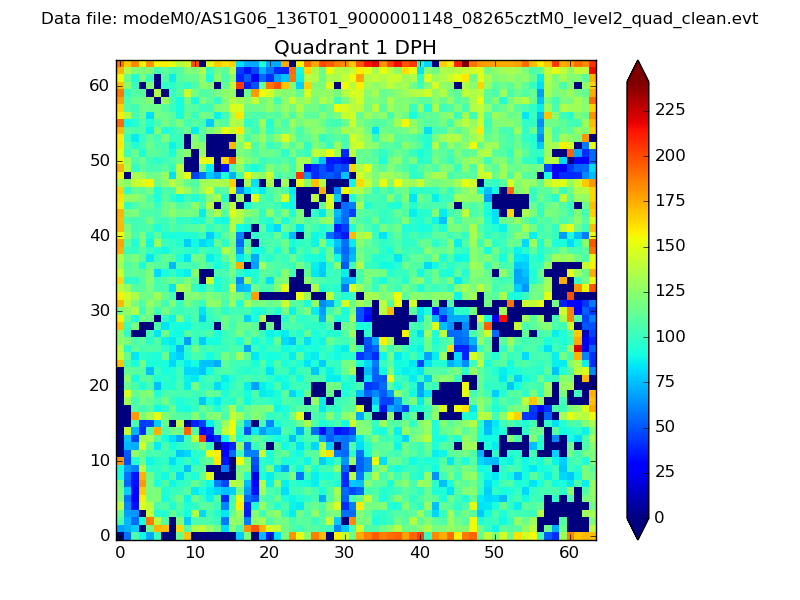 |
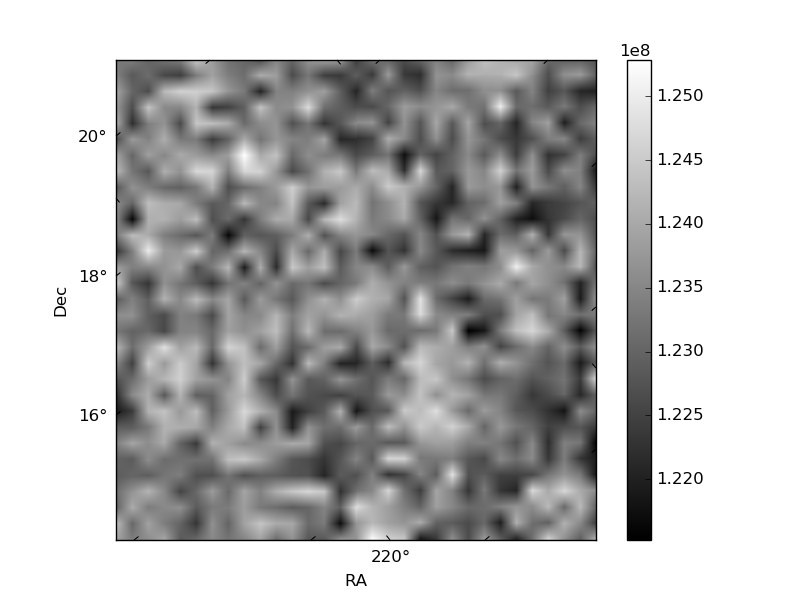
Quadrant B |
|---|---|---|---|
| Quadrant D | 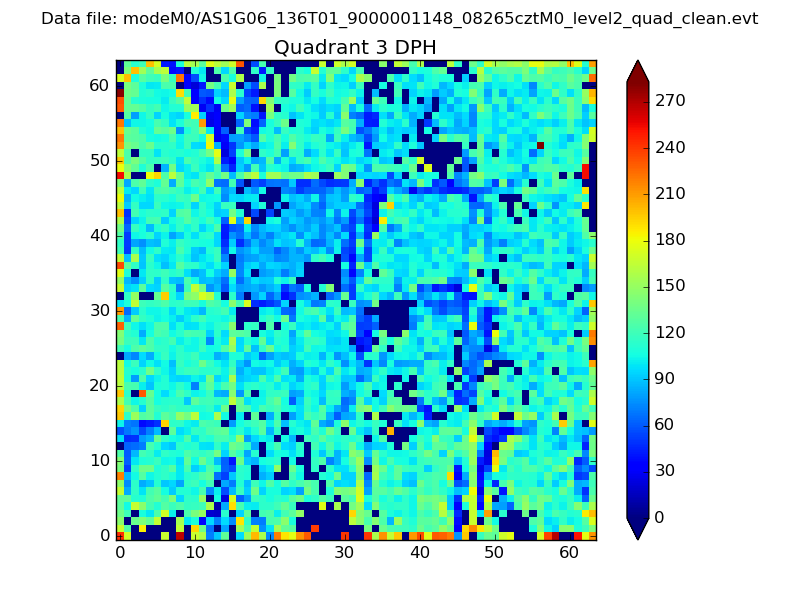 |
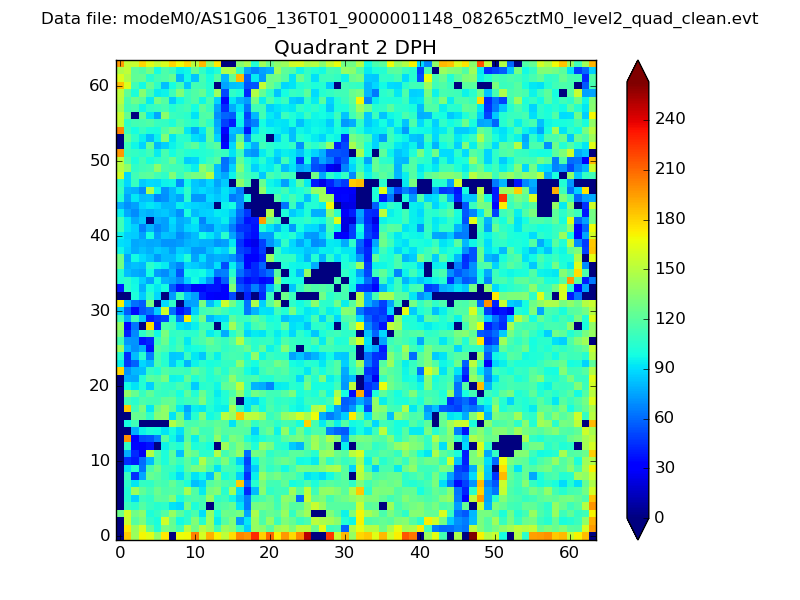 |
Quadrant C |
| Plot type | Count rate plots | Images |
|---|---|---|
| Comparison with Poisson distribution Blue bars denote a histogram of data divided into 1 sec bins. Red curve is a Poisson curve with rate = median count rate of data. |
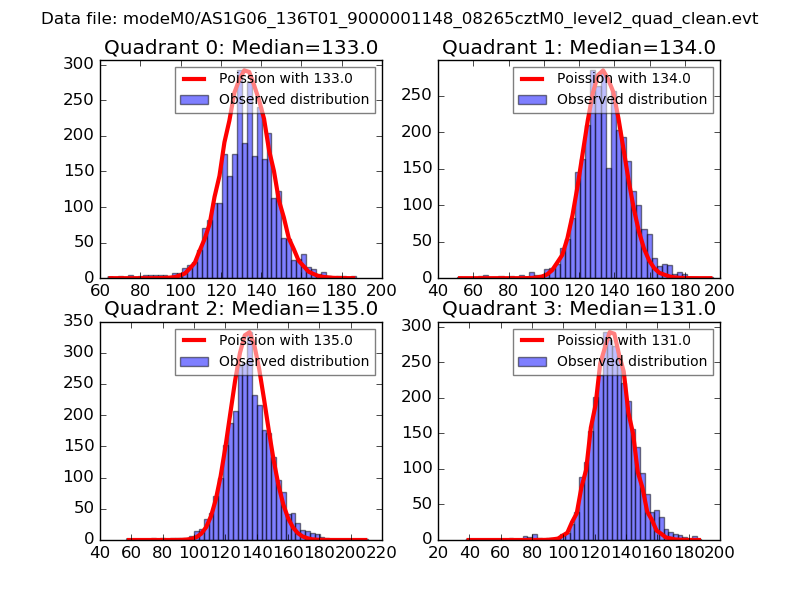 |
 |
| Quadrant-wise count rates Data is divided into 100 sec bins |
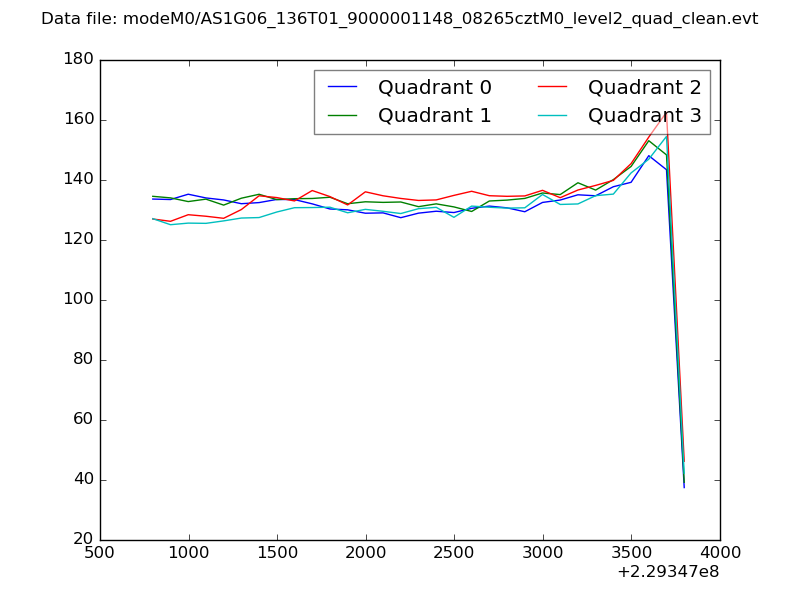 |
|
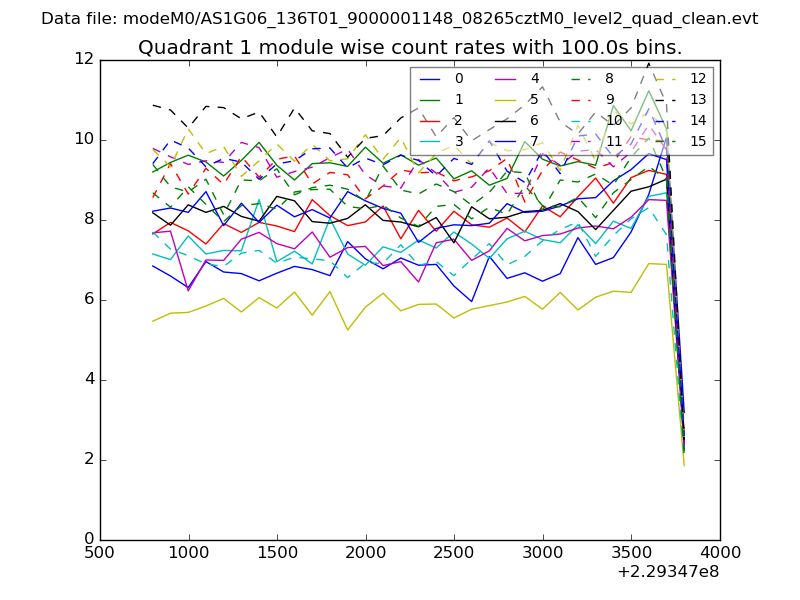
| Module-wise count rates for Quadrant A Data is divided into 100 sec bins |
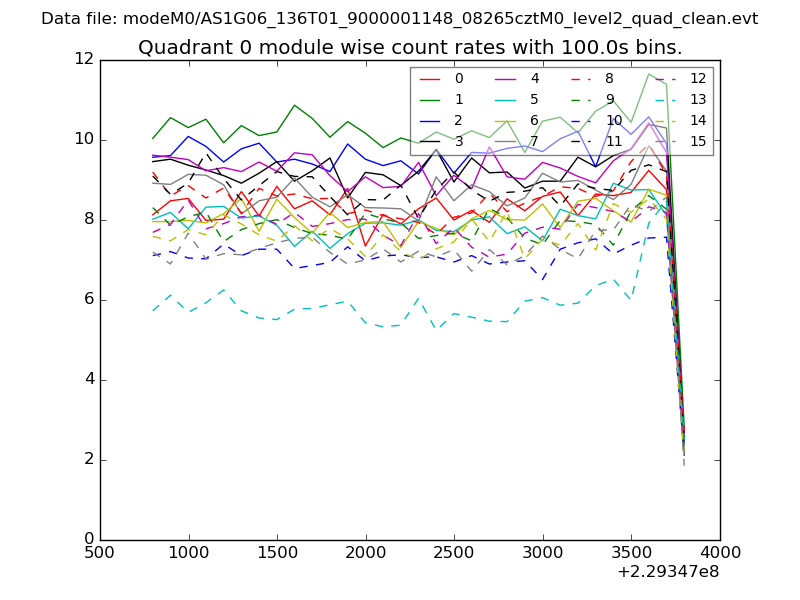 |
 |
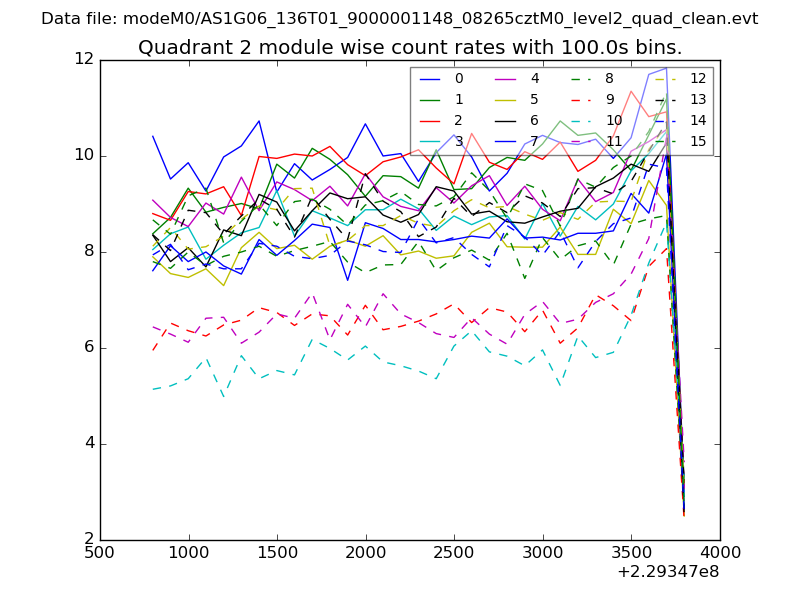
| Module-wise count rates for Quadrant B Data is divided into 100 sec bins |
 |
 |
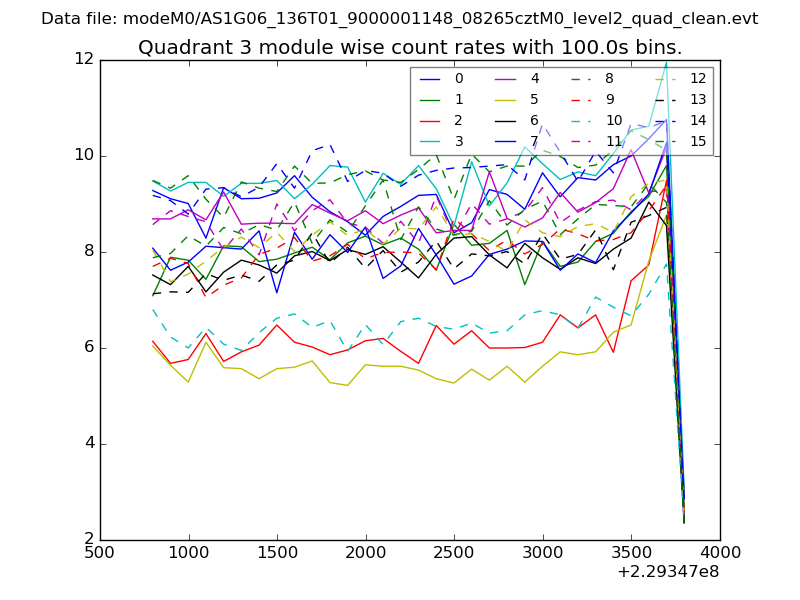
| Module-wise count rates for Quadrant C Data is divided into 100 sec bins |
 |
 |
| Module-wise count rates for Quadrant D Data is divided into 100 sec bins |
 |
 |
| Parameter | Plot |
|---|---|
| CZT HV Monitor | 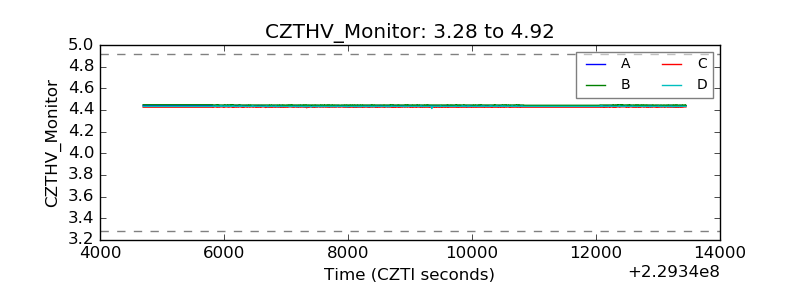 |
| D_VDD | 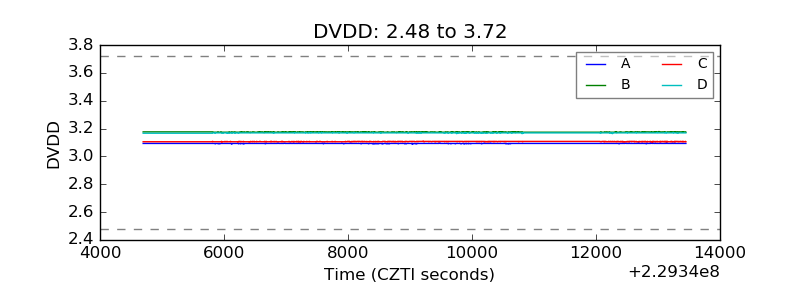 |
| Temperature 1 | 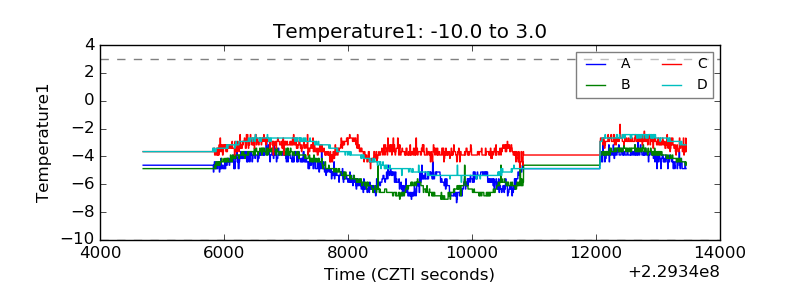 |
| Veto HV Monitor | 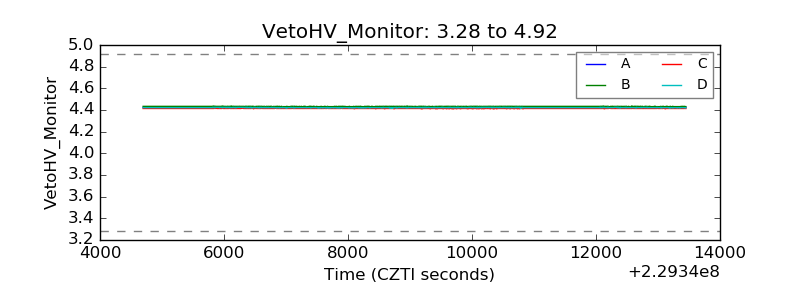 |
| Veto LLD | 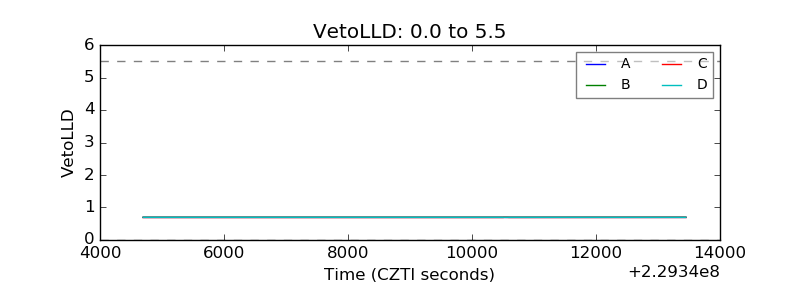 |
| Alpha Counter | 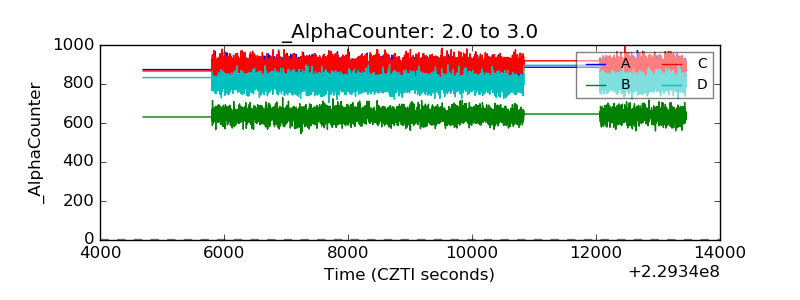 |
| _CPM_Rate | 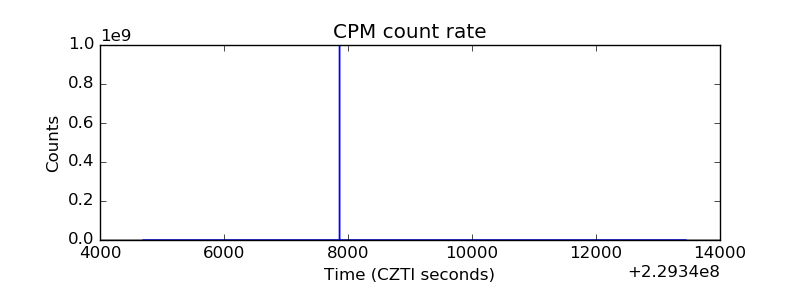 |
| CZT Counter | 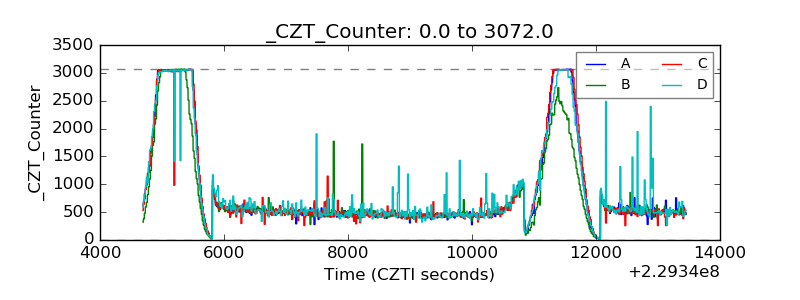 |
| +2.5 Volts monitor |  |
| +5 Volts monitor | 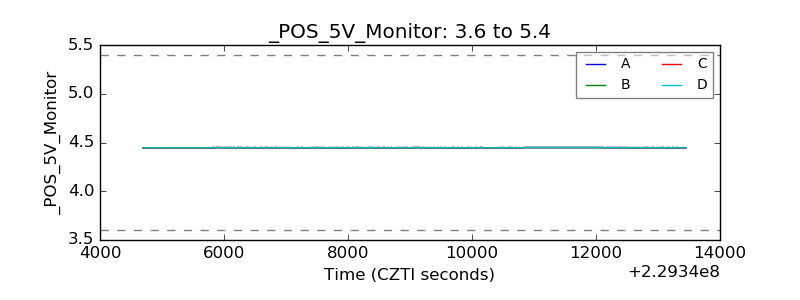 |
| _ROLL_ROT | 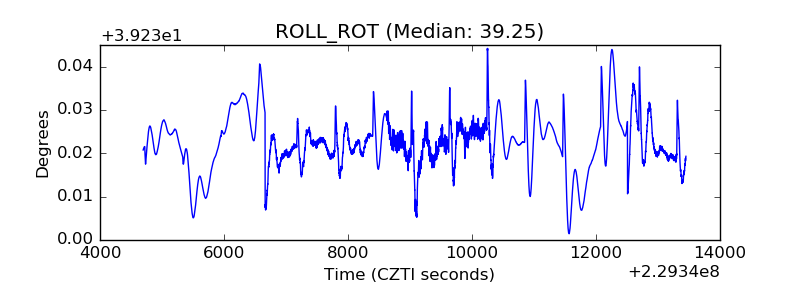 |
| _Roll_DEC | 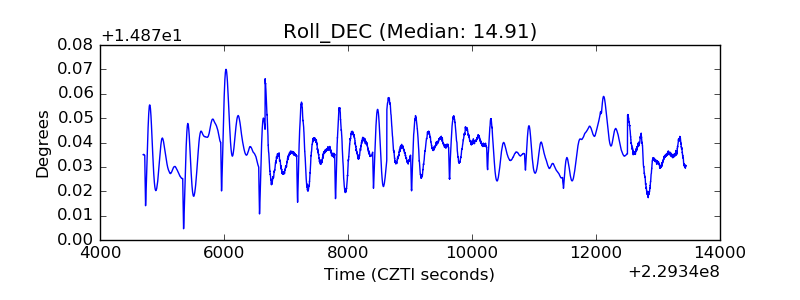 |
| _Roll_RA | 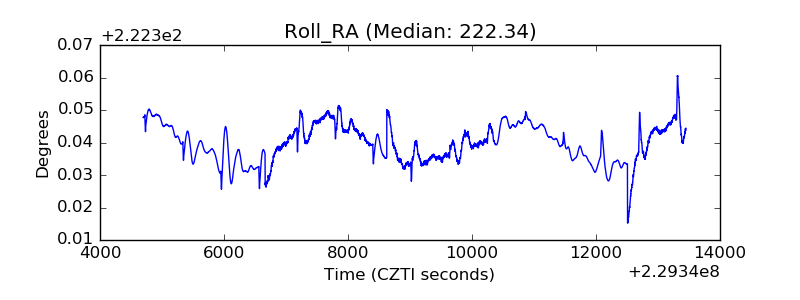 |
| Veto Counter | 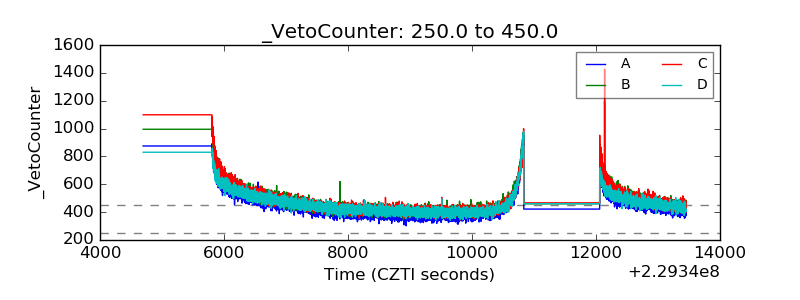 |