| Param | Original file | Final file |
|---|---|---|
| Filename | modeM0/AS1G06_136T01_9000001148_08266cztM0_level2.evt | modeM0/AS1G06_136T01_9000001148_08266cztM0_level2_quad_clean.evt |
| Size (bytes) | 471,876,480 | 77,973,120 |
| Size | 450.0 MB | 74.4 MB |
| Events in quadrant A | 3,301,044 | 472,129 |
| Events in quadrant B | 3,319,719 | 483,236 |
| Events in quadrant C | 3,362,955 | 483,895 |
| Events in quadrant D | 3,868,972 | 471,741 |
| Mode SS | |||
|---|---|---|---|
| Quadrant | BADHDUFLAG | Total packets | Discarded packets |
| A | 0 | 132 | 0 |
| B | 0 | 132 | 0 |
| C | 0 | 132 | 0 |
| D | 0 | 132 | 0 |
| Mode M9 | |||
|---|---|---|---|
| Quadrant | BADHDUFLAG | Total packets | Discarded packets |
| A | 0 | 24 | 0 |
| B | 0 | 24 | 0 |
| C | 0 | 24 | 0 |
| D | 0 | 24 | 0 |
| Mode M0 | |||
|---|---|---|---|
| Quadrant | BADHDUFLAG | Total packets | Discarded packets |
| A | 0 | 13914 | 3 |
| B | 0 | 13858 | 2 |
| C | 0 | 14160 | 2 |
| D | 0 | 15774 | 2 |
| Quadrant | Total seconds | Saturated seconds | Saturation percentage |
|---|---|---|---|
| A | 6451 | 160 | 2.480236% |
| B | 6451 | 168 | 2.604247% |
| C | 6451 | 166 | 2.573244% |
| D | 6451 | 217 | 3.363820% |
Noise dominated data is calculated using 1-second bins in cleaned event files. If a bin has >2000 counts, and if more than 50% of those come from <1% of pixels, then it is considered to be noise-dominated and hence unusable.
| Quadrant | # 1 sec bins | Bins with >0 counts | Bins with >2000 counts | High rate bins dominated by noise | Noise dominated (total time) | Noise dominated (detector-on time) | Marked lightcurve |
|---|---|---|---|---|---|---|---|
| A | 8801 | 6452 | 3 | 3 | 0.03% | 0.05% | 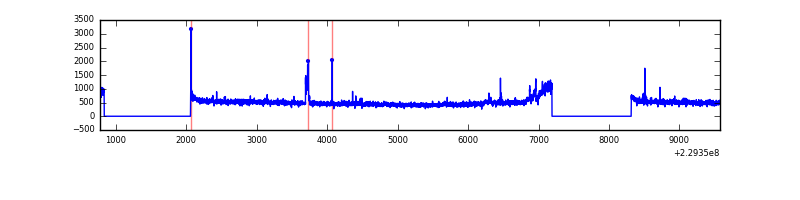 |
| B | 8801 | 6452 | 13 | 13 | 0.15% | 0.20% | 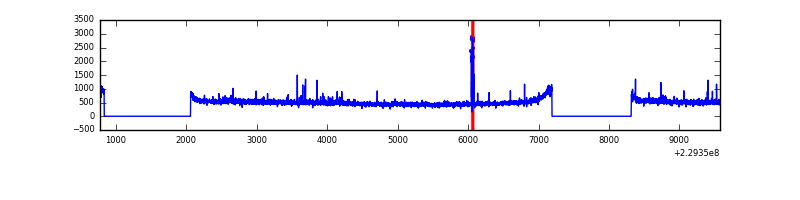 |
| C | 8801 | 6452 | 34 | 34 | 0.39% | 0.53% |  |
| D | 8801 | 6452 | 81 | 81 | 0.92% | 1.26% | 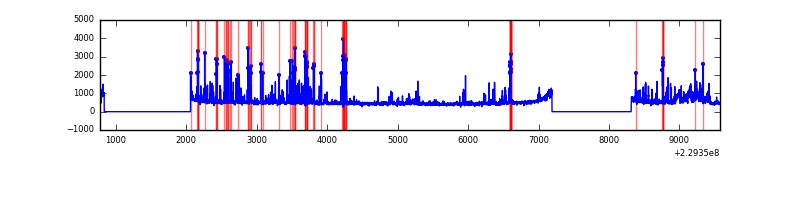 |
Top three noisy pixels from each quadrant. If the there are fewer than three noisy pixels in the level2.evt file, extra rows are filled as -1
| Pixel properties | Quadrant properties | ||||||
|---|---|---|---|---|---|---|---|
| Quadrant | DetID | PixID | Counts | Sigma | Mean | Median | Sigma |
| A | 15 | 234 | 127616 | 759.58 | 819 | 800 | 167.0 |
| A | 0 | 254 | 18084 | 103.52 | 819 | 800 | 167.0 |
| A | 13 | 248 | 8895 | 48.49 | 819 | 800 | 167.0 |
| B | 11 | 51 | 44495 | 275.03 | 822 | 803 | 158.9 |
| B | 10 | 252 | 43875 | 271.12 | 822 | 803 | 158.9 |
| B | 0 | 214 | 35025 | 215.42 | 822 | 803 | 158.9 |
| C | 9 | 54 | 224668 | 1201.46 | 804 | 810 | 186.3 |
| C | 13 | 61 | 6123 | 28.52 | 804 | 810 | 186.3 |
| C | 14 | 222 | 2261 | 7.79 | 804 | 810 | 186.3 |
| D | 1 | 52 | 526864 | 2728.32 | 802 | 782 | 192.8 |
| D | 13 | 105 | 218190 | 1127.5 | 802 | 782 | 192.8 |
| D | 2 | 152 | 50540 | 258.05 | 802 | 782 | 192.8 |
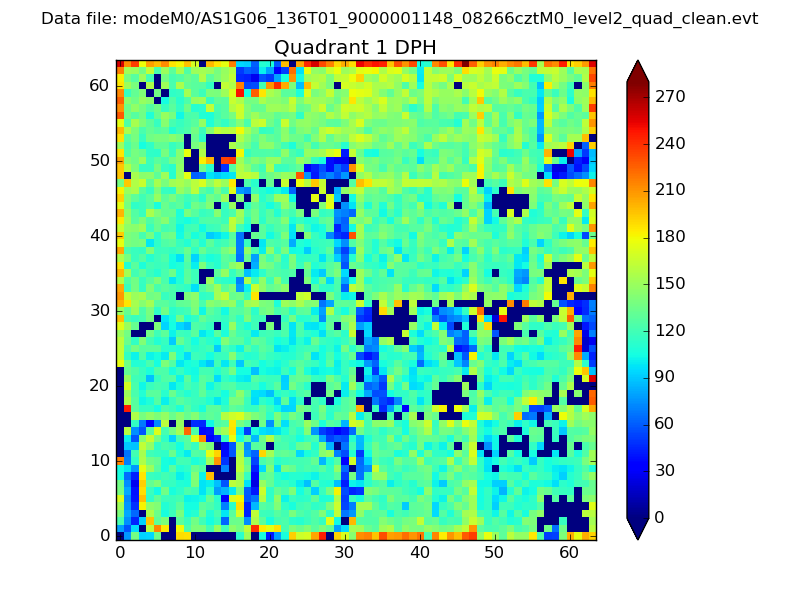
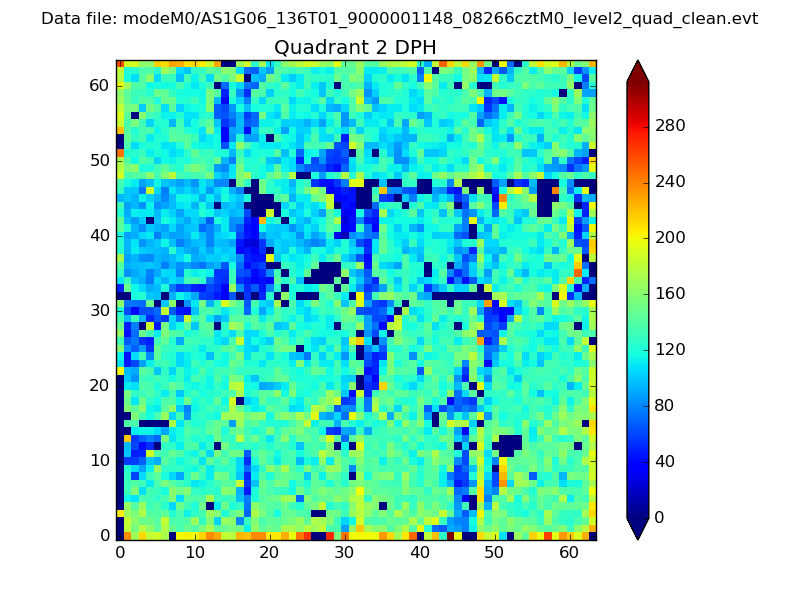
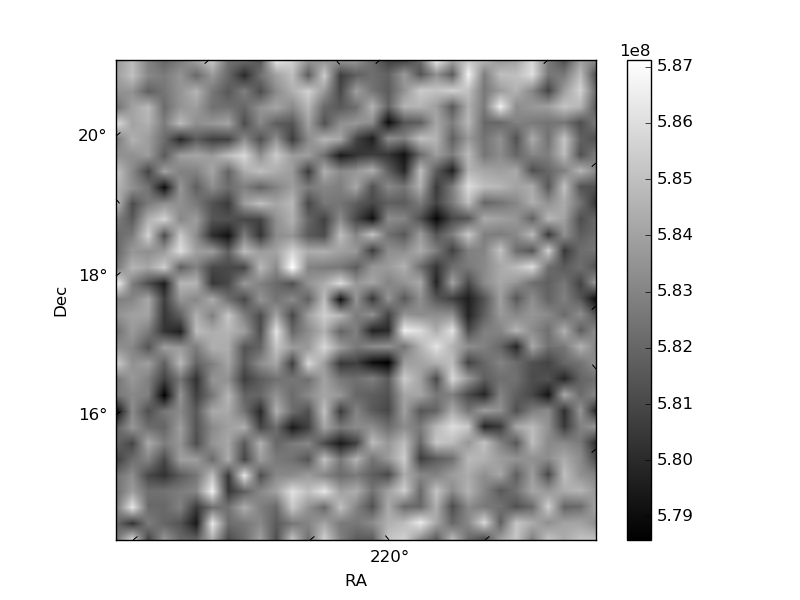
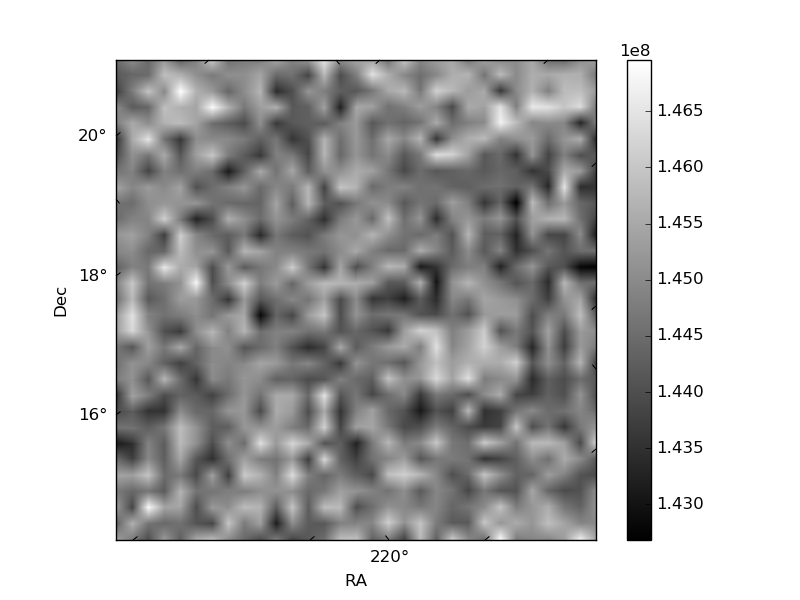
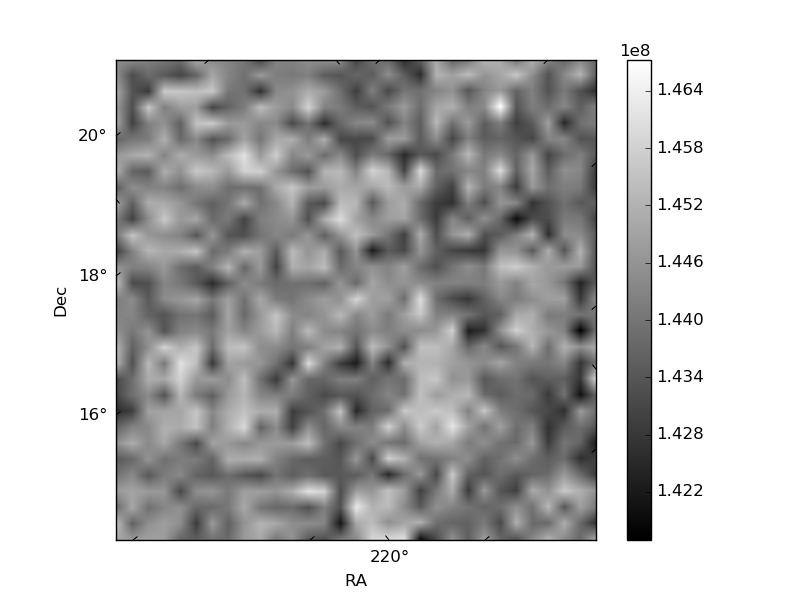
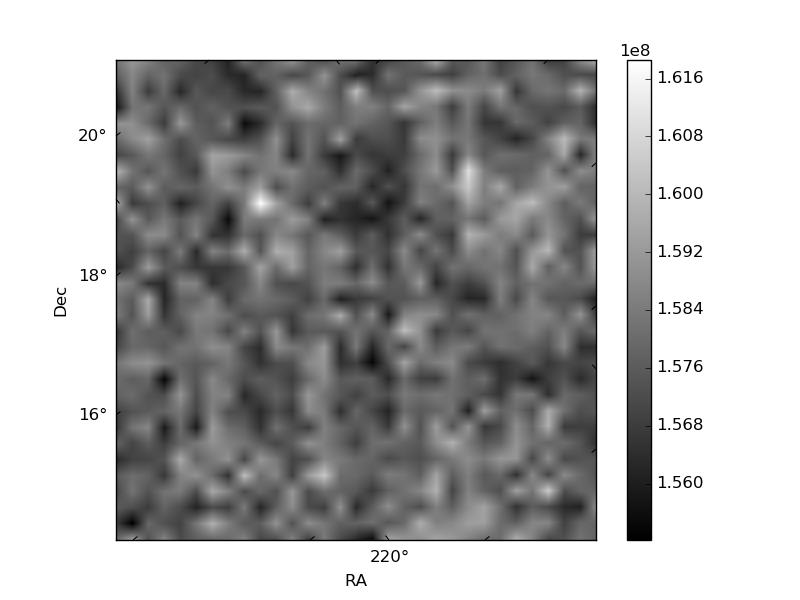
Histogram calculated using DETX and DETY for each event in the final _common_clean file
| Quadrant A | 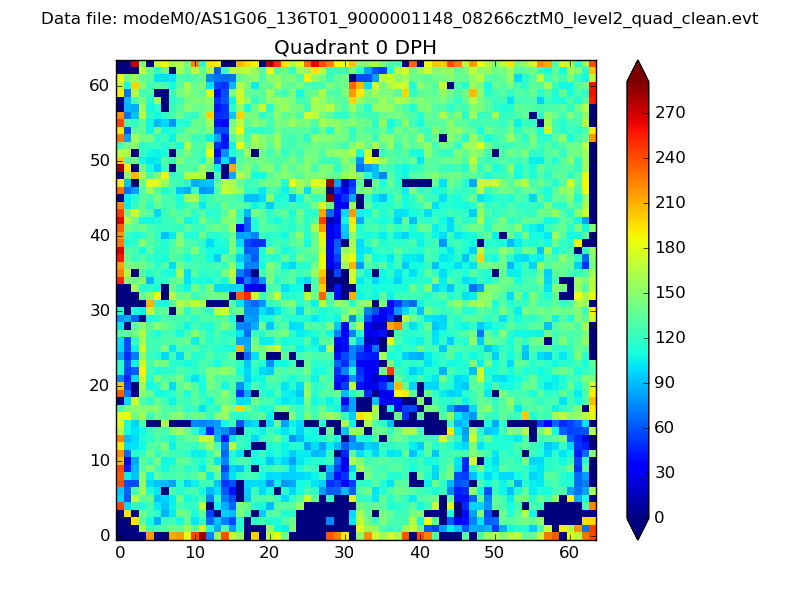 |
 |
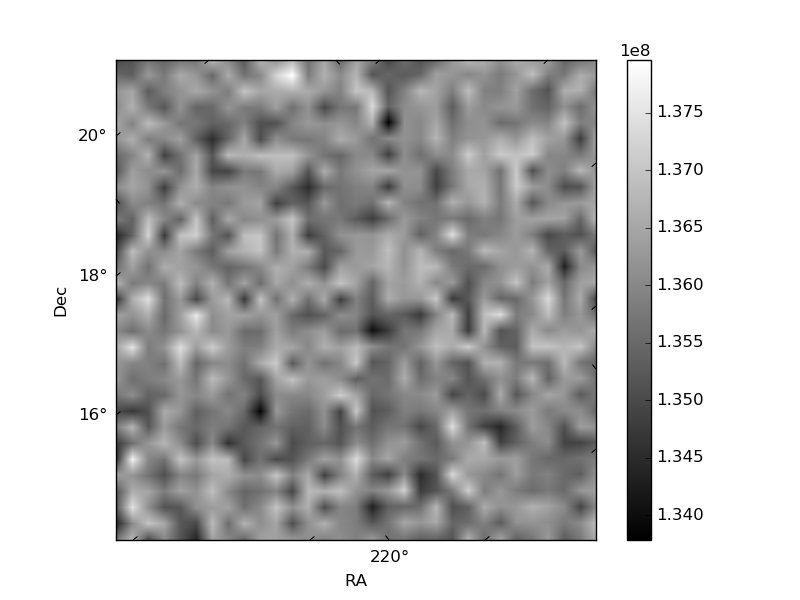
Quadrant B |
|---|---|---|---|
| Quadrant D | 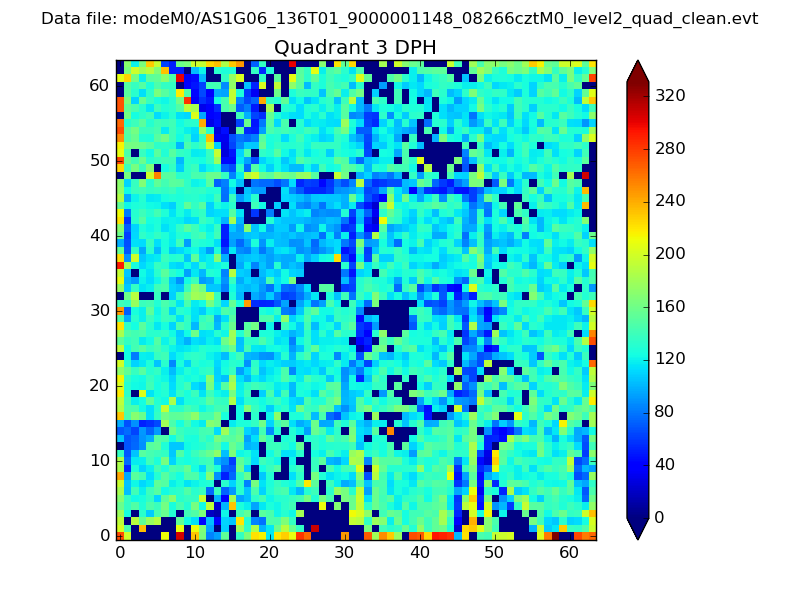 |
 |
Quadrant C |
| Plot type | Count rate plots | Images |
|---|---|---|
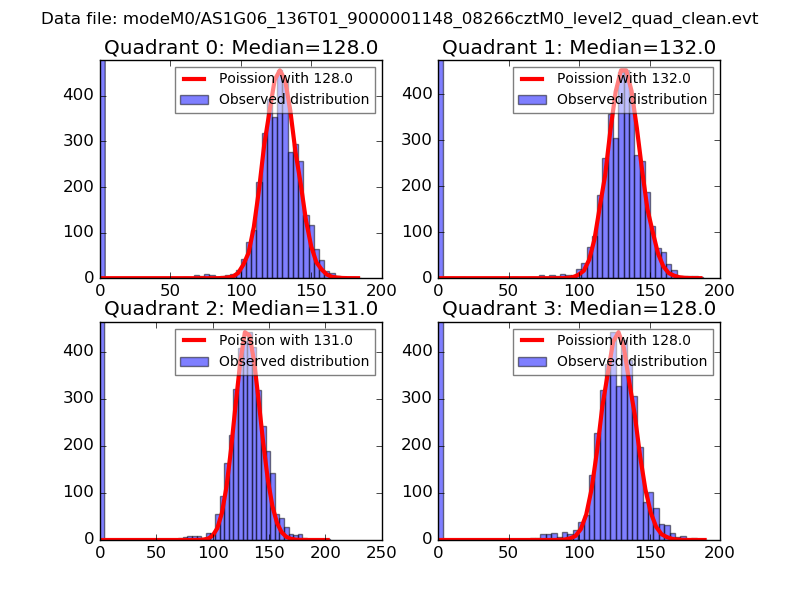
| Comparison with Poisson distribution Blue bars denote a histogram of data divided into 1 sec bins. Red curve is a Poisson curve with rate = median count rate of data. |
 |
 |
| Quadrant-wise count rates Data is divided into 100 sec bins |
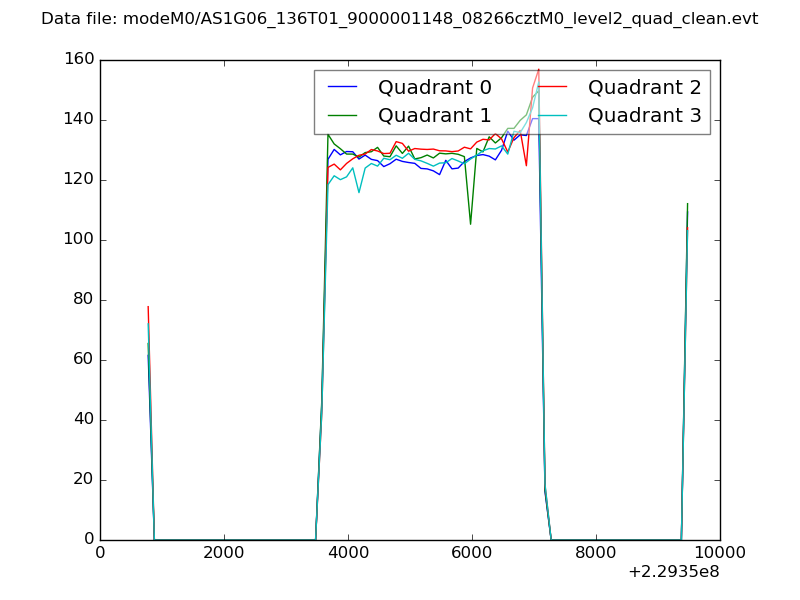 |
|
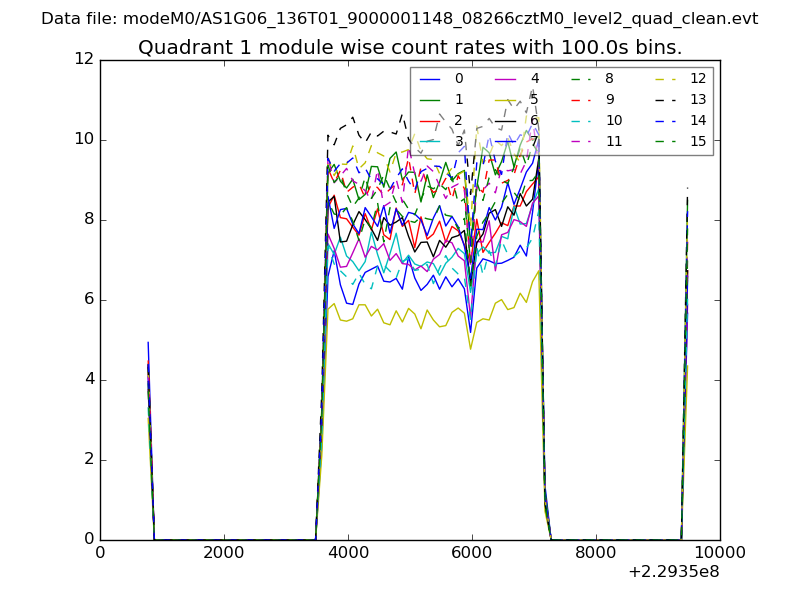
| Module-wise count rates for Quadrant A Data is divided into 100 sec bins |
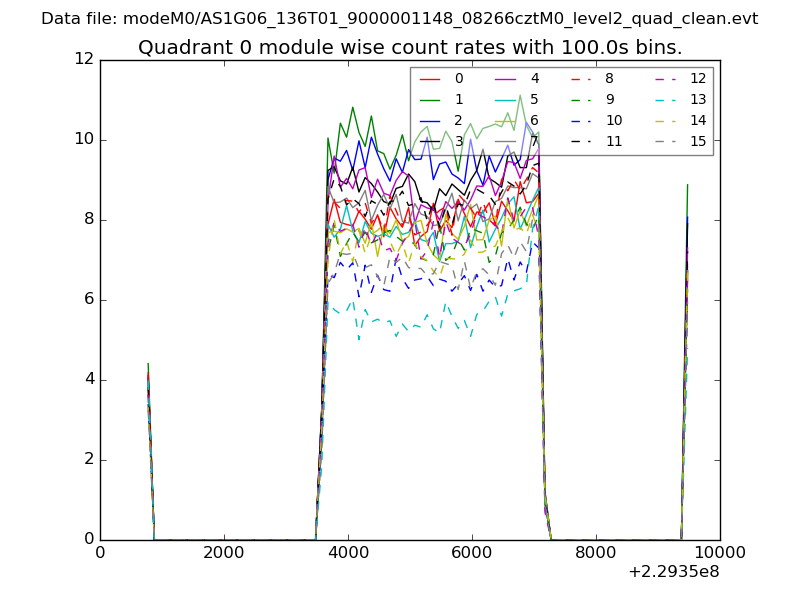 |
 |
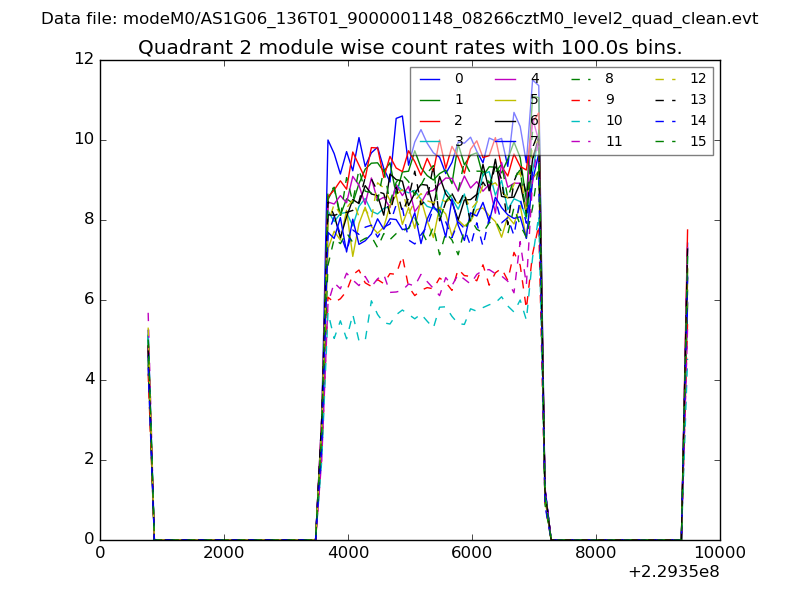
| Module-wise count rates for Quadrant B Data is divided into 100 sec bins |
 |
 |
| Module-wise count rates for Quadrant C Data is divided into 100 sec bins |
 |
 |
| Module-wise count rates for Quadrant D Data is divided into 100 sec bins |
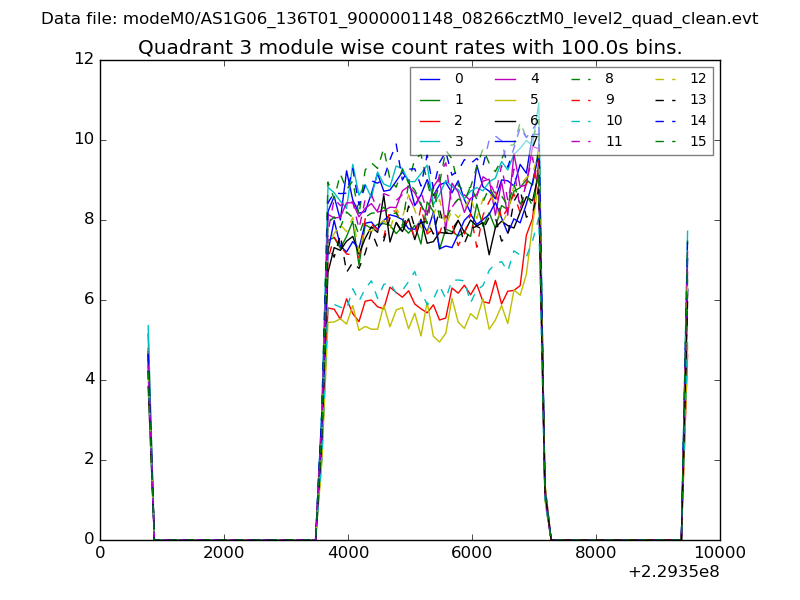 |
 |
| Parameter | Plot |
|---|---|
| CZT HV Monitor | 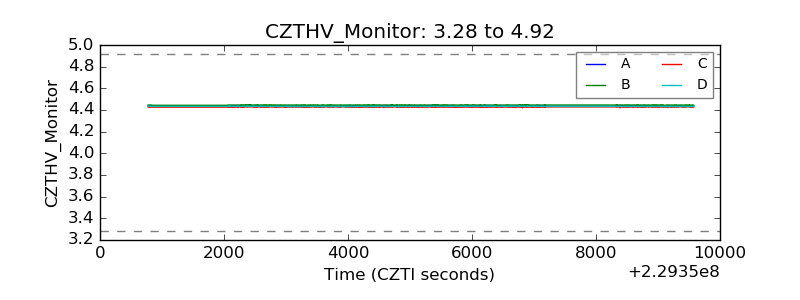 |
| D_VDD | 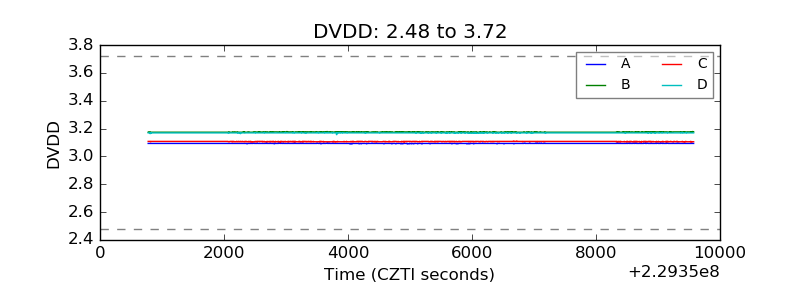 |
| Temperature 1 | 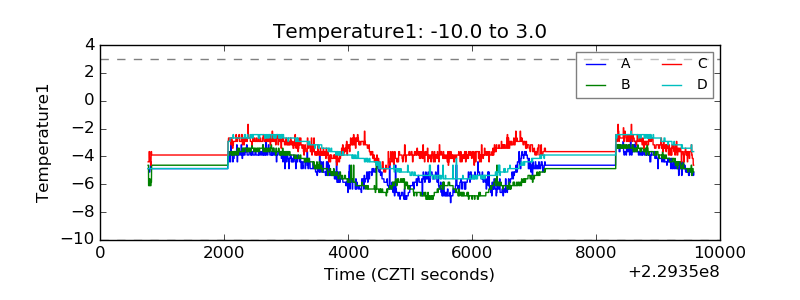 |
| Veto HV Monitor | 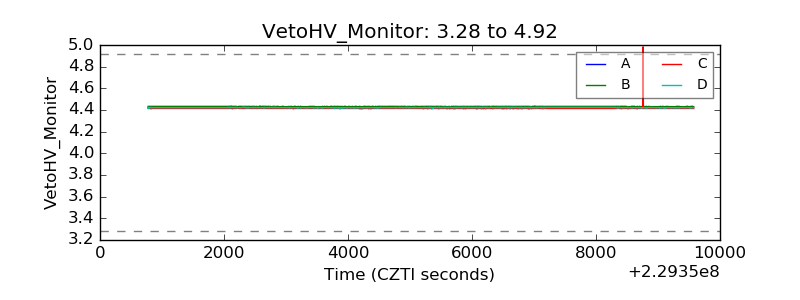 |
| Veto LLD | 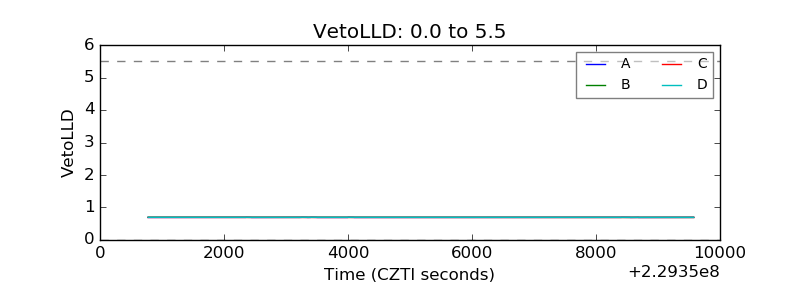 |
| Alpha Counter | 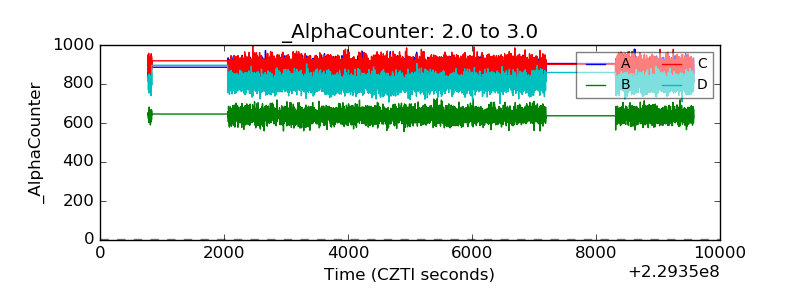 |
| _CPM_Rate | 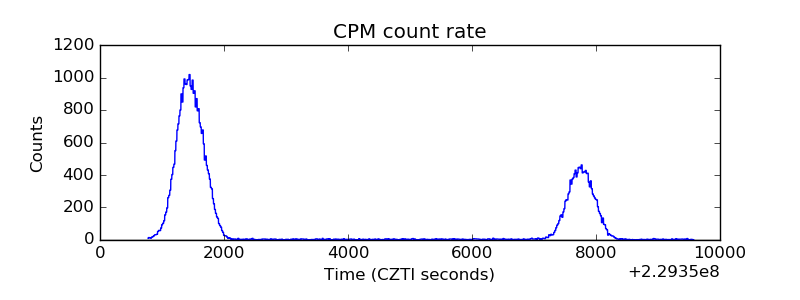 |
| CZT Counter | 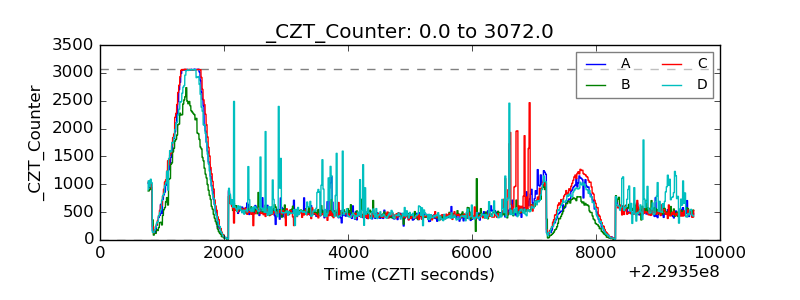 |
| +2.5 Volts monitor |  |
| +5 Volts monitor |  |
| _ROLL_ROT | 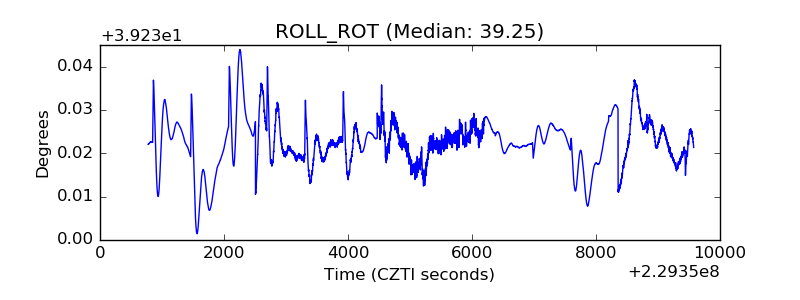 |
| _Roll_DEC | 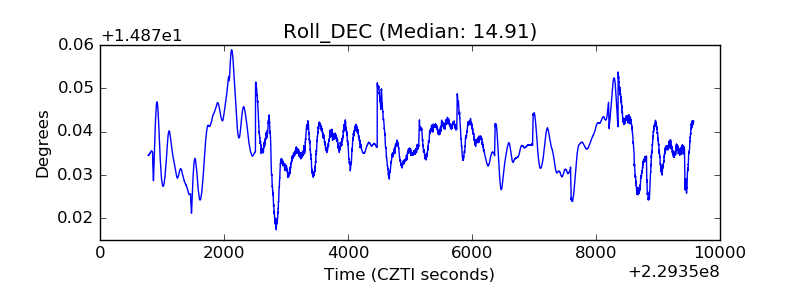 |
| _Roll_RA | 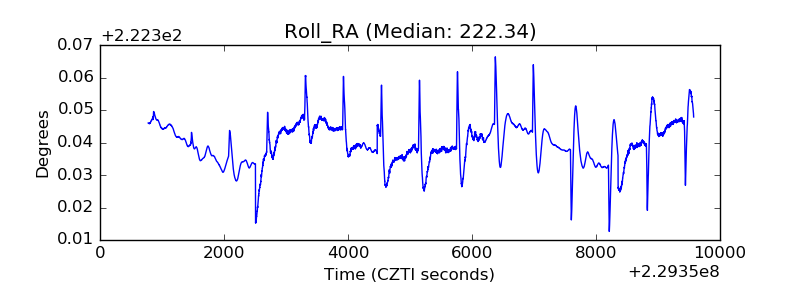 |
| Veto Counter | 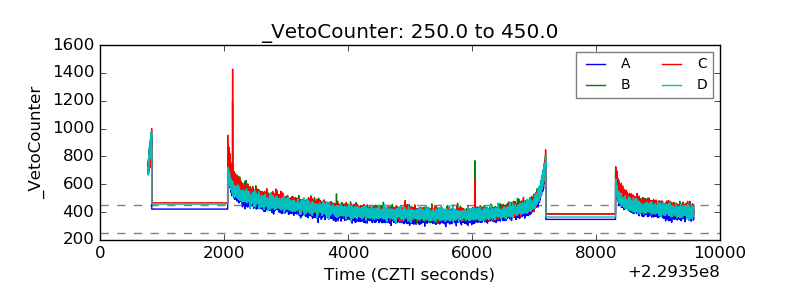 |