| Param | Original file | Final file |
|---|---|---|
| Filename | modeM0/AS1G06_136T01_9000001148_08267cztM0_level2.evt | modeM0/AS1G06_136T01_9000001148_08267cztM0_level2_quad_clean.evt |
| Size (bytes) | 503,398,080 | 93,369,600 |
| Size | 480.1 MB | 89.0 MB |
| Events in quadrant A | 3,560,418 | 573,191 |
| Events in quadrant B | 3,640,161 | 587,442 |
| Events in quadrant C | 3,590,135 | 587,625 |
| Events in quadrant D | 3,960,231 | 572,611 |
| Mode SS | |||
|---|---|---|---|
| Quadrant | BADHDUFLAG | Total packets | Discarded packets |
| A | 0 | 148 | 0 |
| B | 0 | 148 | 0 |
| C | 0 | 148 | 0 |
| D | 0 | 148 | 0 |
| Mode M9 | |||
|---|---|---|---|
| Quadrant | BADHDUFLAG | Total packets | Discarded packets |
| A | 0 | 20 | 0 |
| B | 0 | 20 | 0 |
| C | 0 | 20 | 0 |
| D | 0 | 20 | 0 |
| Mode M0 | |||
|---|---|---|---|
| Quadrant | BADHDUFLAG | Total packets | Discarded packets |
| A | 0 | 15477 | 3 |
| B | 0 | 15497 | 2 |
| C | 0 | 15491 | 2 |
| D | 0 | 16881 | 2 |
| Quadrant | Total seconds | Saturated seconds | Saturation percentage |
|---|---|---|---|
| A | 7283 | 154 | 2.114513% |
| B | 7283 | 148 | 2.032130% |
| C | 7283 | 150 | 2.059591% |
| D | 7283 | 163 | 2.238089% |
Noise dominated data is calculated using 1-second bins in cleaned event files. If a bin has >2000 counts, and if more than 50% of those come from <1% of pixels, then it is considered to be noise-dominated and hence unusable.
| Quadrant | # 1 sec bins | Bins with >0 counts | Bins with >2000 counts | High rate bins dominated by noise | Noise dominated (total time) | Noise dominated (detector-on time) | Marked lightcurve |
|---|---|---|---|---|---|---|---|
| A | 9198 | 7285 | 0 | 0 | 0.00% | 0.00% | 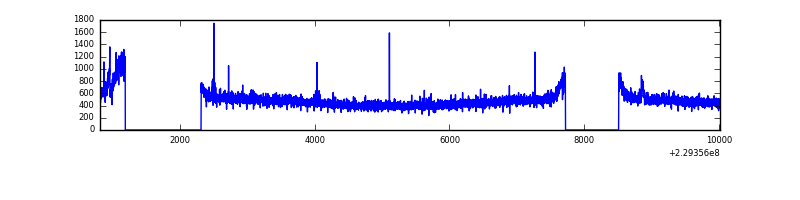 |
| B | 9198 | 7285 | 0 | 0 | 0.00% | 0.00% | 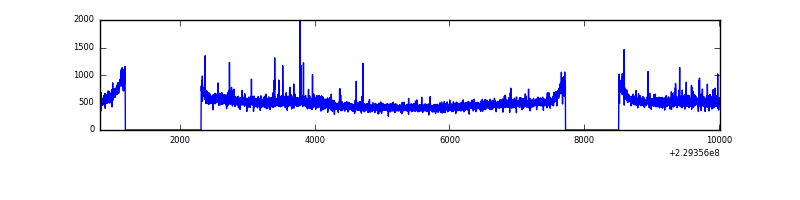 |
| C | 9198 | 7285 | 22 | 22 | 0.24% | 0.30% | 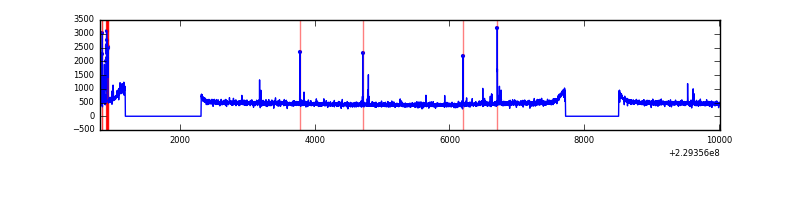 |
| D | 9198 | 7285 | 19 | 19 | 0.21% | 0.26% | 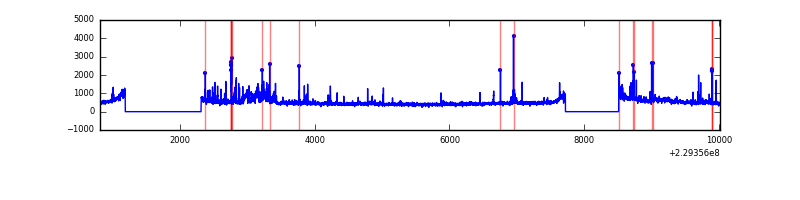 |
Top three noisy pixels from each quadrant. If the there are fewer than three noisy pixels in the level2.evt file, extra rows are filled as -1
| Pixel properties | Quadrant properties | ||||||
|---|---|---|---|---|---|---|---|
| Quadrant | DetID | PixID | Counts | Sigma | Mean | Median | Sigma |
| A | 15 | 234 | 74322 | 395.87 | 904 | 884 | 185.5 |
| A | 0 | 254 | 10129 | 49.84 | 904 | 884 | 185.5 |
| A | 0 | 226 | 8488 | 40.99 | 904 | 884 | 185.5 |
| B | 11 | 51 | 66376 | 371.93 | 910 | 889 | 176.1 |
| B | 0 | 214 | 26518 | 145.56 | 910 | 889 | 176.1 |
| B | 12 | 111 | 19534 | 105.89 | 910 | 889 | 176.1 |
| C | 9 | 54 | 123121 | 588.04 | 889 | 895 | 207.9 |
| C | 13 | 61 | 6681 | 27.84 | 889 | 895 | 207.9 |
| C | 3 | 202 | 2111 | 5.85 | 889 | 895 | 207.9 |
| D | 1 | 52 | 350972 | 1642.08 | 886 | 863 | 213.2 |
| D | 8 | 230 | 168725 | 787.31 | 886 | 863 | 213.2 |
| D | 2 | 152 | 40682 | 186.76 | 886 | 863 | 213.2 |
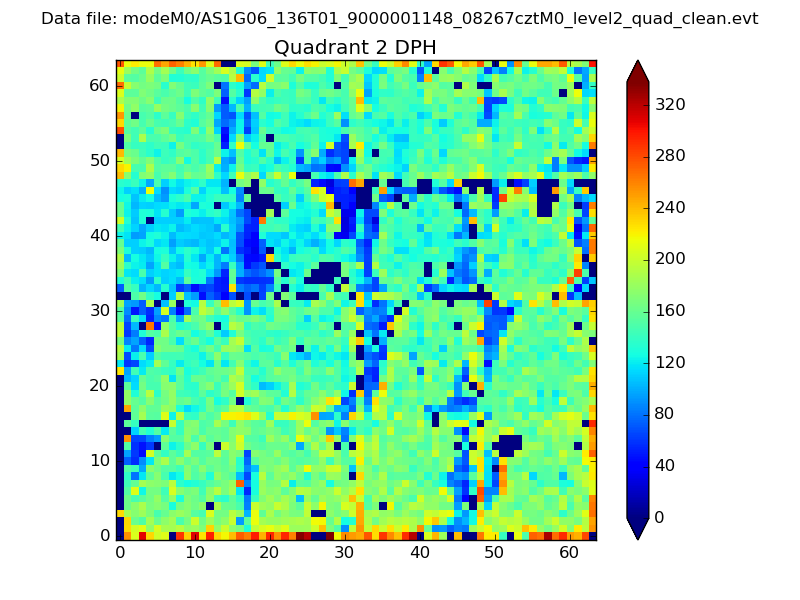
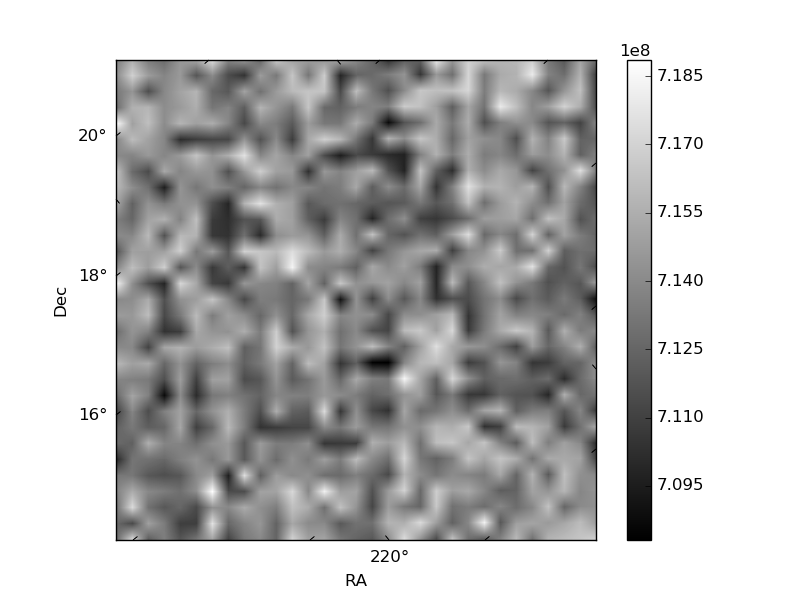
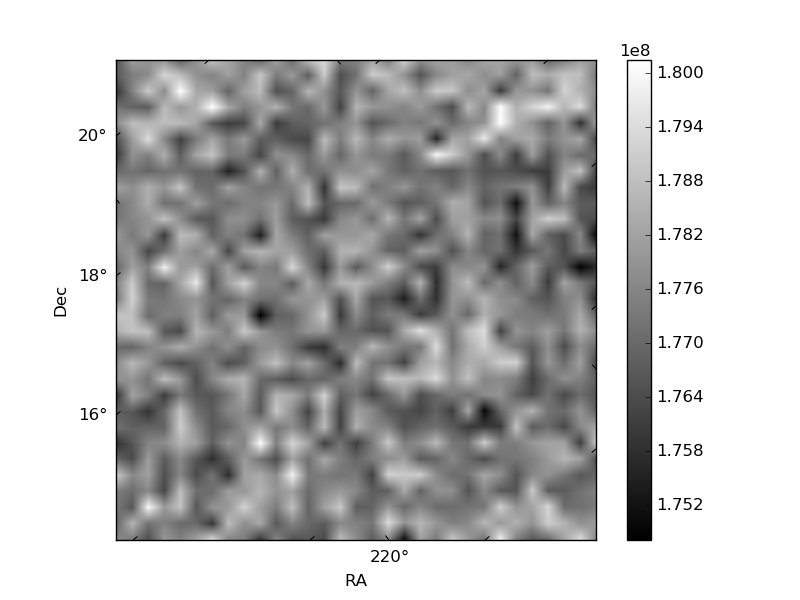
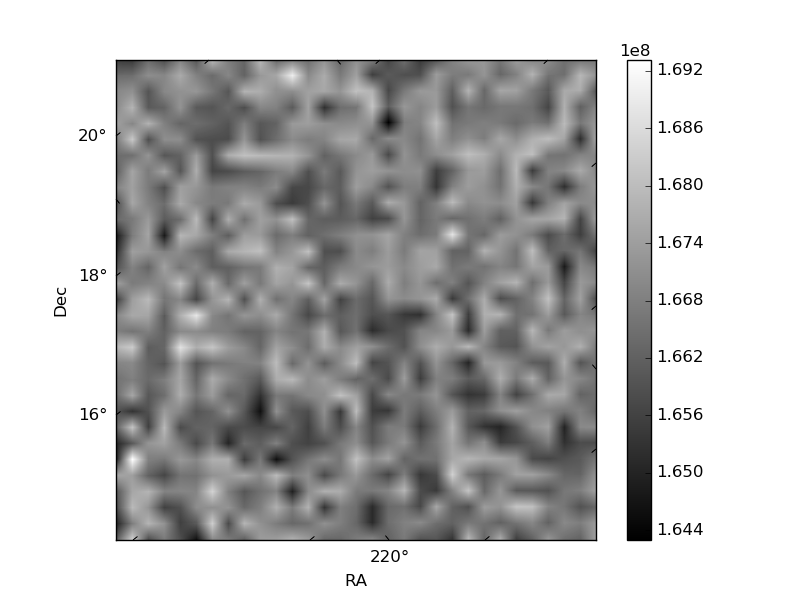
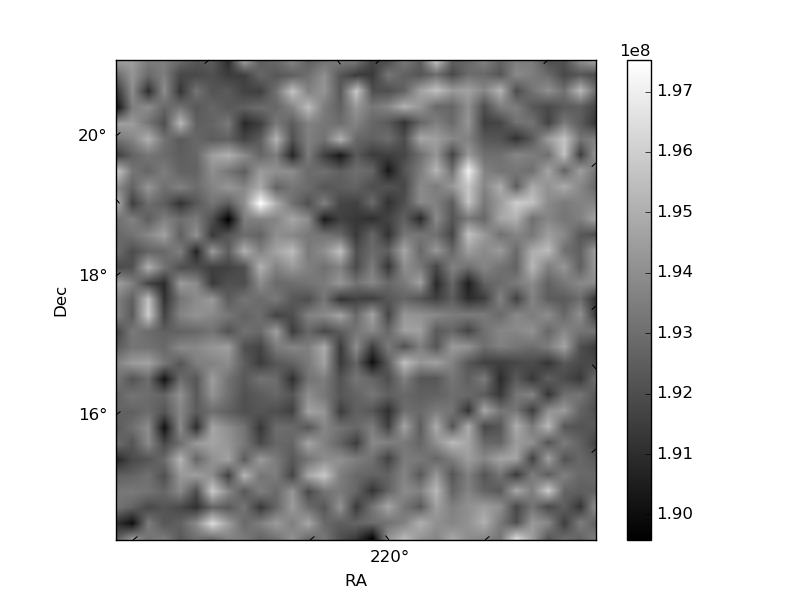
Histogram calculated using DETX and DETY for each event in the final _common_clean file
| Quadrant A | 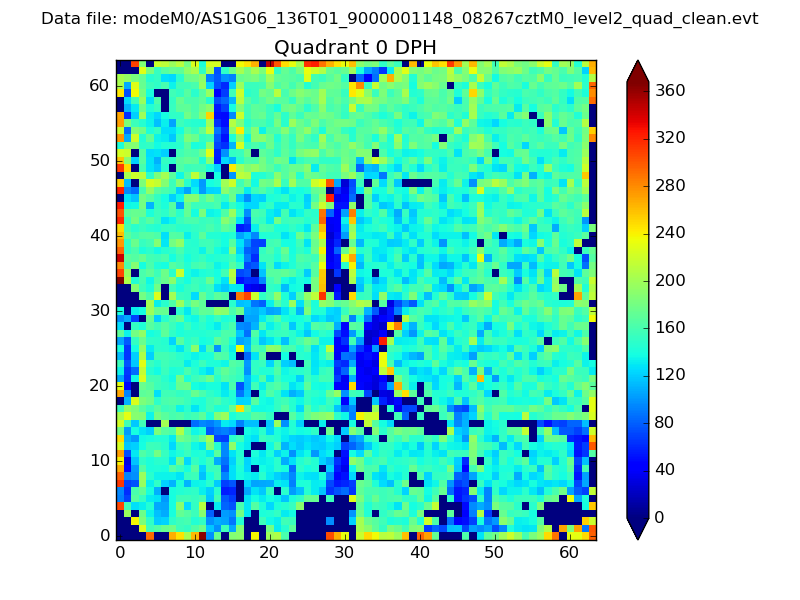 |
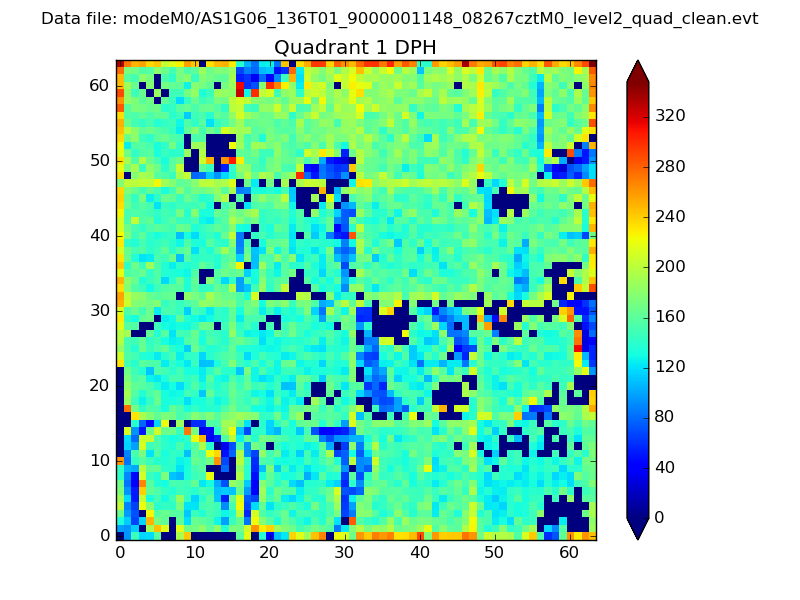 |
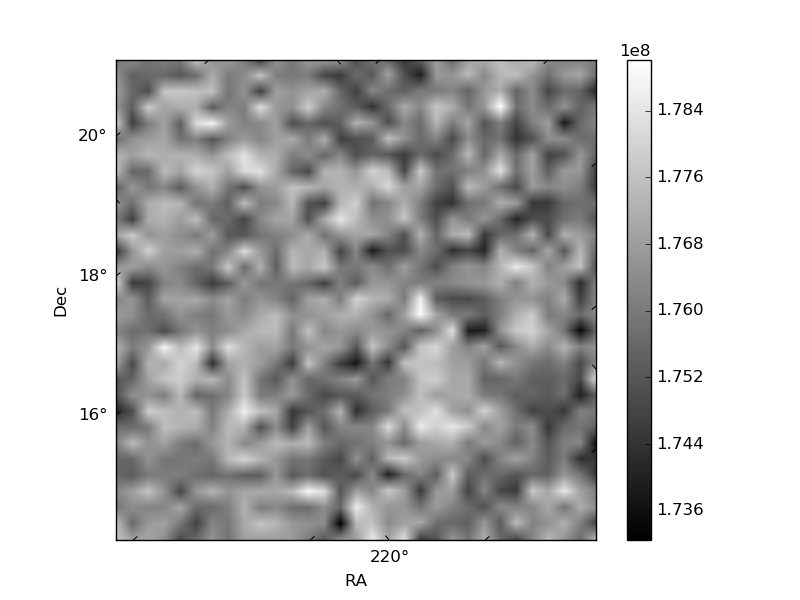
Quadrant B |
|---|---|---|---|
| Quadrant D | 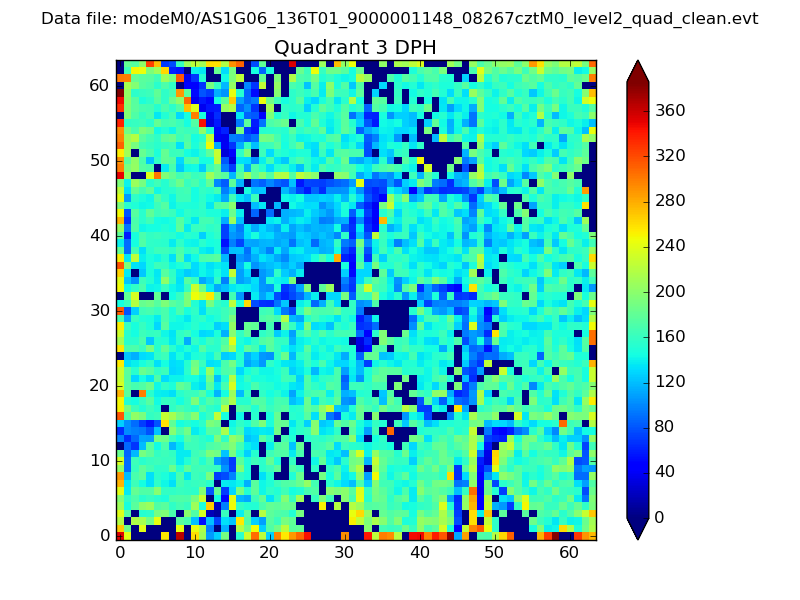 |
 |
Quadrant C |
| Plot type | Count rate plots | Images |
|---|---|---|
| Comparison with Poisson distribution Blue bars denote a histogram of data divided into 1 sec bins. Red curve is a Poisson curve with rate = median count rate of data. |
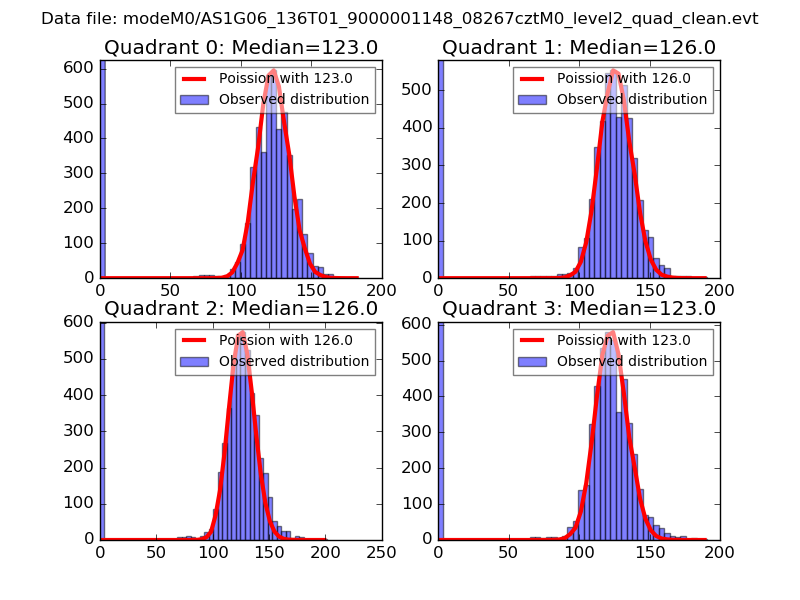 |
 |
| Quadrant-wise count rates Data is divided into 100 sec bins |
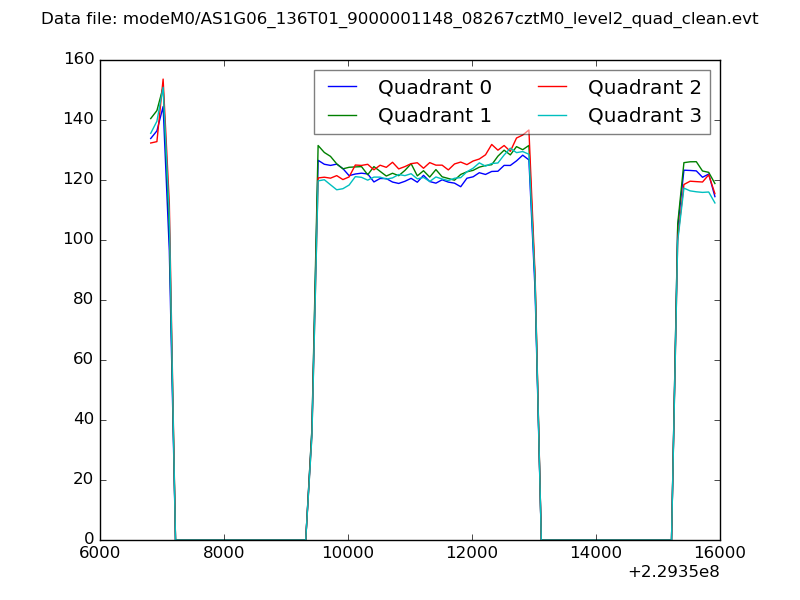 |
|
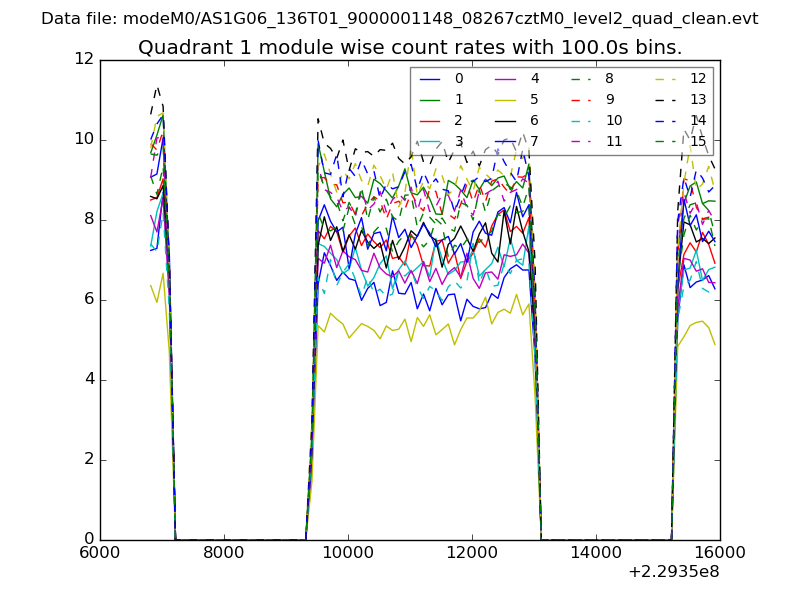
| Module-wise count rates for Quadrant A Data is divided into 100 sec bins |
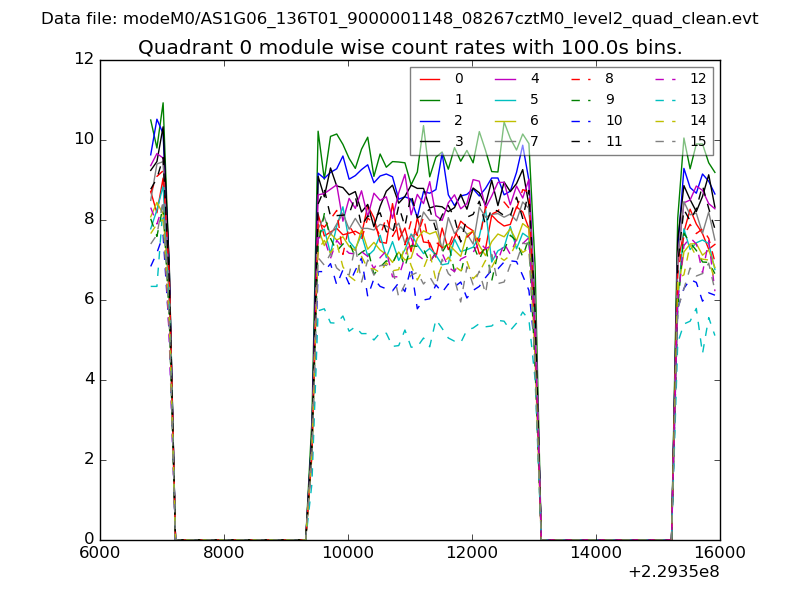 |
 |
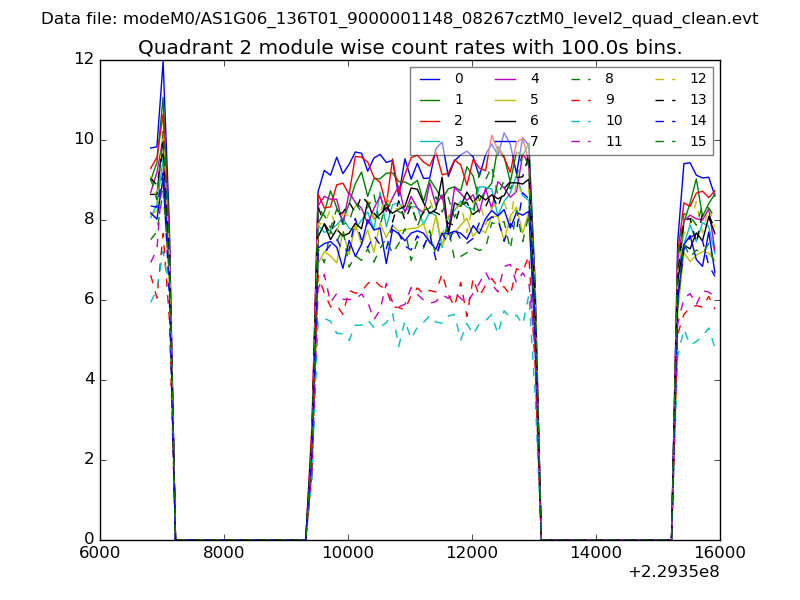
| Module-wise count rates for Quadrant B Data is divided into 100 sec bins |
 |
 |
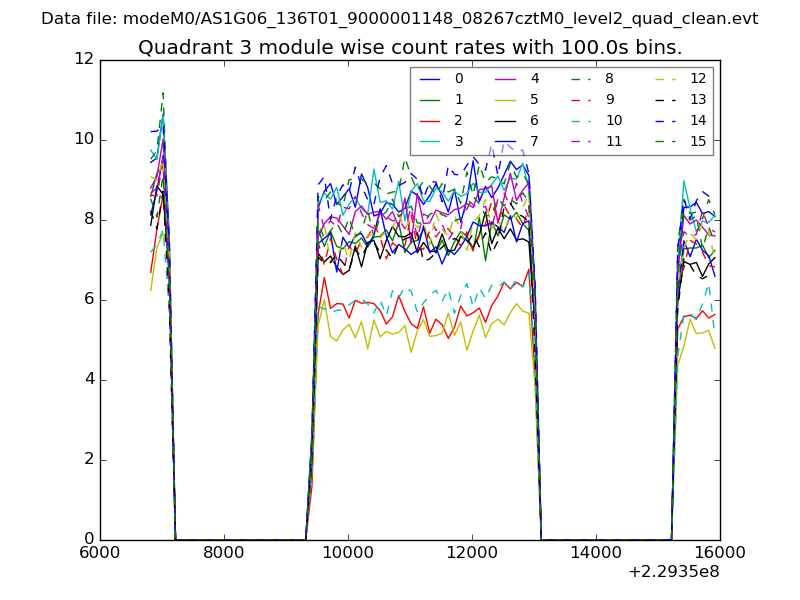
| Module-wise count rates for Quadrant C Data is divided into 100 sec bins |
 |
 |
| Module-wise count rates for Quadrant D Data is divided into 100 sec bins |
 |
 |
| Parameter | Plot |
|---|---|
| CZT HV Monitor | 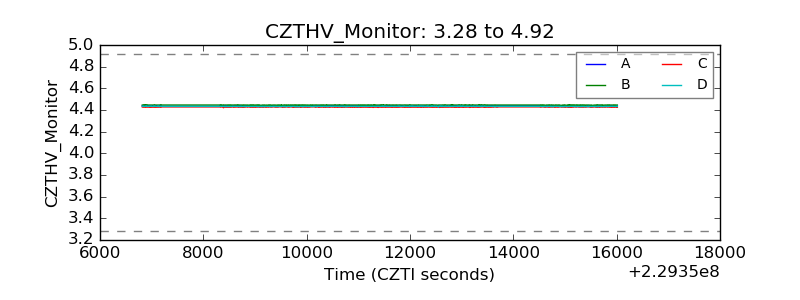 |
| D_VDD | 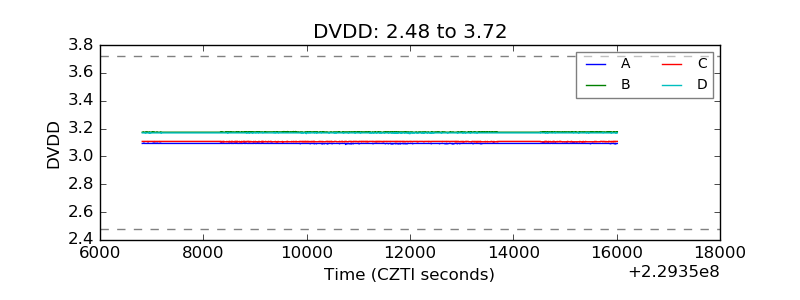 |
| Temperature 1 | 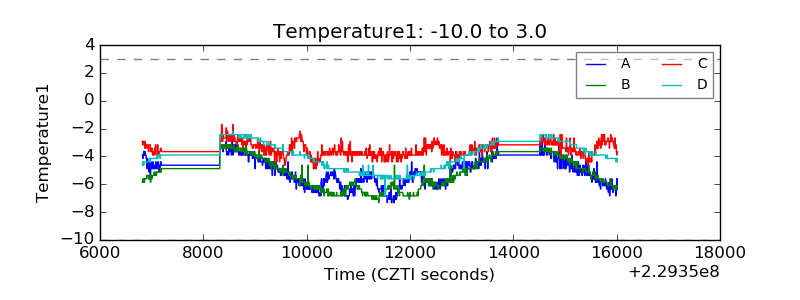 |
| Veto HV Monitor | 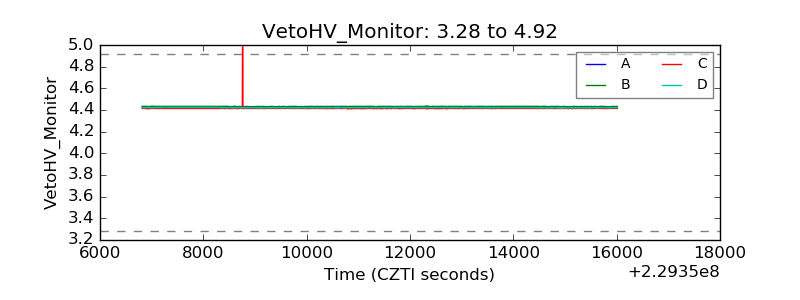 |
| Veto LLD |  |
| Alpha Counter | 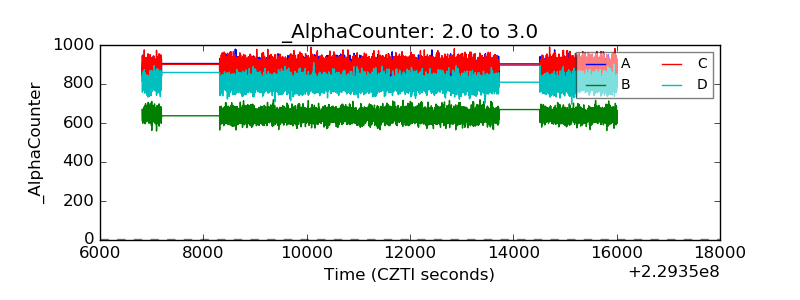 |
| _CPM_Rate | 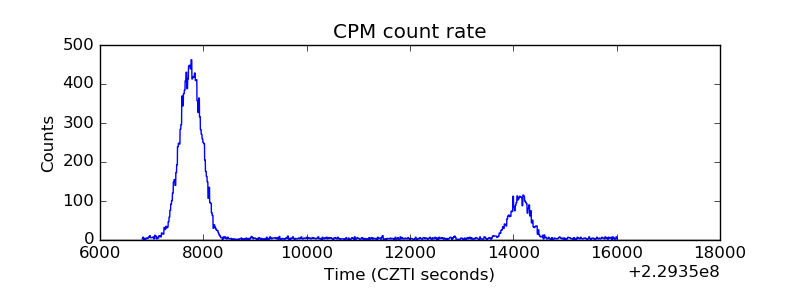 |
| CZT Counter | 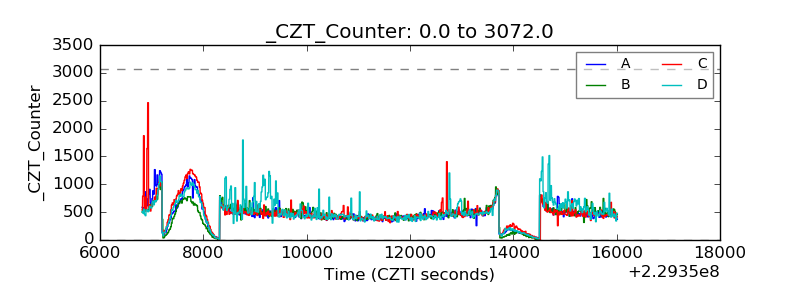 |
| +2.5 Volts monitor |  |
| +5 Volts monitor | 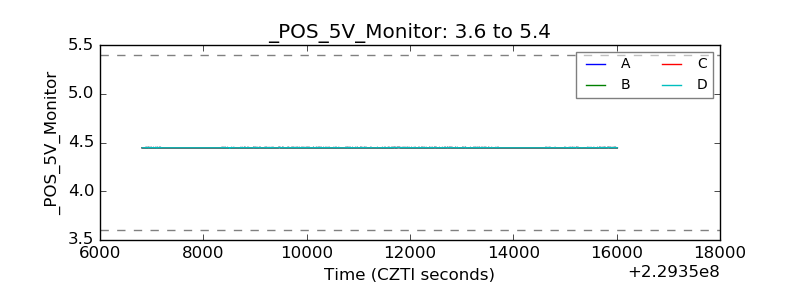 |
| _ROLL_ROT | 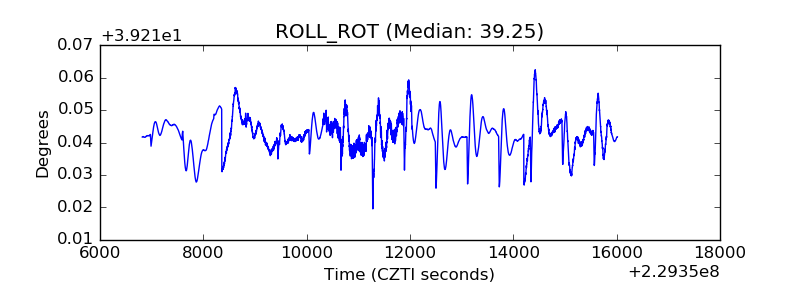 |
| _Roll_DEC | 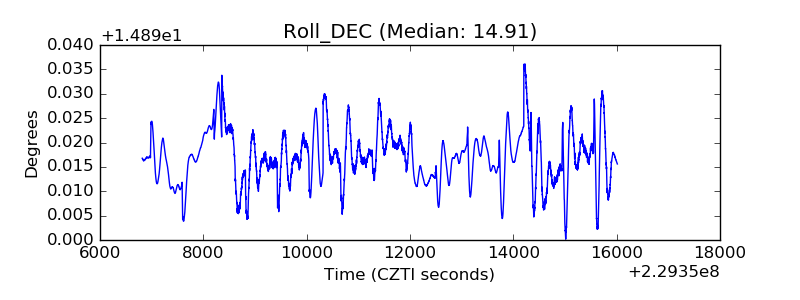 |
| _Roll_RA | 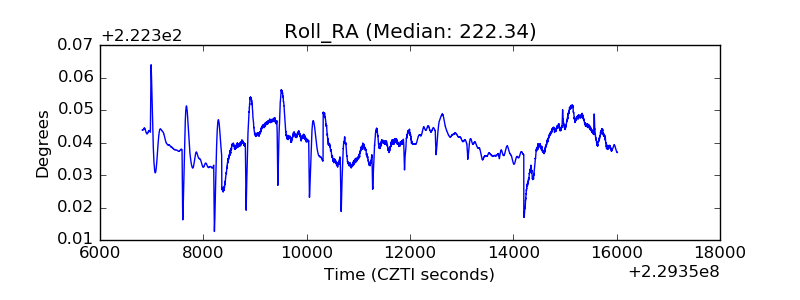 |
| Veto Counter | 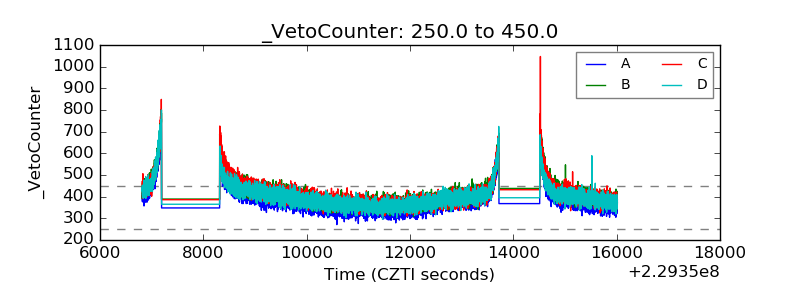 |