| Param | Original file | Final file |
|---|---|---|
| Filename | modeM0/AS1G06_136T01_9000001148_08268cztM0_level2.evt | modeM0/AS1G06_136T01_9000001148_08268cztM0_level2_quad_clean.evt |
| Size (bytes) | 548,732,160 | 95,414,400 |
| Size | 523.3 MB | 91.0 MB |
| Events in quadrant A | 3,900,083 | 574,454 |
| Events in quadrant B | 4,024,649 | 587,348 |
| Events in quadrant C | 3,881,168 | 588,974 |
| Events in quadrant D | 4,257,996 | 571,212 |
| Mode SS | |||
|---|---|---|---|
| Quadrant | BADHDUFLAG | Total packets | Discarded packets |
| A | 0 | 166 | 0 |
| B | 0 | 166 | 0 |
| C | 0 | 166 | 0 |
| D | 0 | 166 | 0 |
| Mode M9 | |||
|---|---|---|---|
| Quadrant | BADHDUFLAG | Total packets | Discarded packets |
| A | 0 | 12 | 0 |
| B | 0 | 12 | 0 |
| C | 0 | 12 | 0 |
| D | 0 | 12 | 0 |
| Mode M0 | |||
|---|---|---|---|
| Quadrant | BADHDUFLAG | Total packets | Discarded packets |
| A | 0 | 17119 | 3 |
| B | 0 | 17270 | 2 |
| C | 0 | 17055 | 2 |
| D | 0 | 18267 | 2 |
| Quadrant | Total seconds | Saturated seconds | Saturation percentage |
|---|---|---|---|
| A | 8169 | 118 | 1.444485% |
| B | 8169 | 155 | 1.897417% |
| C | 8169 | 113 | 1.383278% |
| D | 8169 | 167 | 2.044314% |
Noise dominated data is calculated using 1-second bins in cleaned event files. If a bin has >2000 counts, and if more than 50% of those come from <1% of pixels, then it is considered to be noise-dominated and hence unusable.
| Quadrant | # 1 sec bins | Bins with >0 counts | Bins with >2000 counts | High rate bins dominated by noise | Noise dominated (total time) | Noise dominated (detector-on time) | Marked lightcurve |
|---|---|---|---|---|---|---|---|
| A | 9339 | 8171 | 15 | 15 | 0.16% | 0.18% | 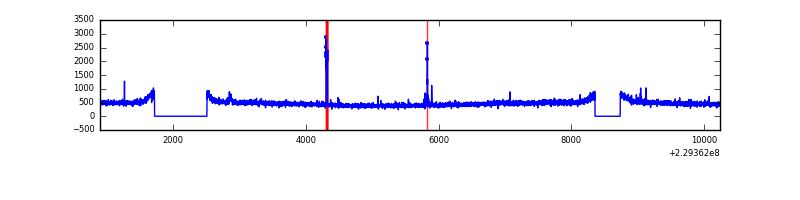 |
| B | 9339 | 8171 | 1 | 1 | 0.01% | 0.01% | 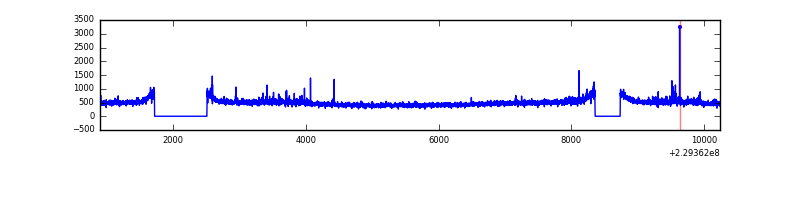 |
| C | 9339 | 8171 | 8 | 8 | 0.09% | 0.10% |  |
| D | 9339 | 8171 | 47 | 47 | 0.50% | 0.58% | 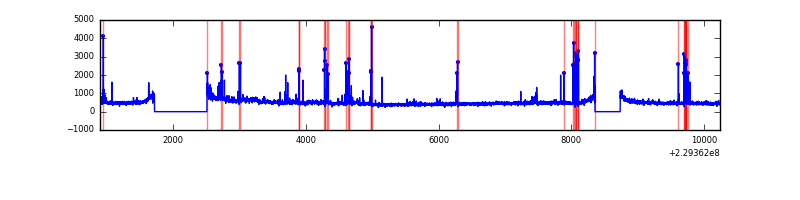 |
Top three noisy pixels from each quadrant. If the there are fewer than three noisy pixels in the level2.evt file, extra rows are filled as -1
| Pixel properties | Quadrant properties | ||||||
|---|---|---|---|---|---|---|---|
| Quadrant | DetID | PixID | Counts | Sigma | Mean | Median | Sigma |
| A | 0 | 254 | 59915 | 286.93 | 996 | 971 | 205.4 |
| A | 15 | 234 | 12875 | 57.95 | 996 | 971 | 205.4 |
| A | 0 | 226 | 9238 | 40.24 | 996 | 971 | 205.4 |
| B | 11 | 51 | 66820 | 336.62 | 1005 | 981 | 195.6 |
| B | 0 | 214 | 31237 | 154.69 | 1005 | 981 | 195.6 |
| B | 12 | 111 | 21579 | 105.31 | 1005 | 981 | 195.6 |
| C | 9 | 54 | 68891 | 297.36 | 978 | 980 | 228.4 |
| C | 13 | 61 | 7354 | 27.91 | 978 | 980 | 228.4 |
| C | 3 | 202 | 2502 | 6.66 | 978 | 980 | 228.4 |
| D | 8 | 230 | 210548 | 894.64 | 974 | 947 | 234.3 |
| D | 1 | 52 | 174228 | 739.62 | 974 | 947 | 234.3 |
| D | 13 | 105 | 54411 | 228.2 | 974 | 947 | 234.3 |
Histogram calculated using DETX and DETY for each event in the final _common_clean file
| Quadrant A |  |
 |
Quadrant B |
|---|---|---|---|
| Quadrant D |  |
 |
Quadrant C |
| Plot type | Count rate plots | Images |
|---|---|---|
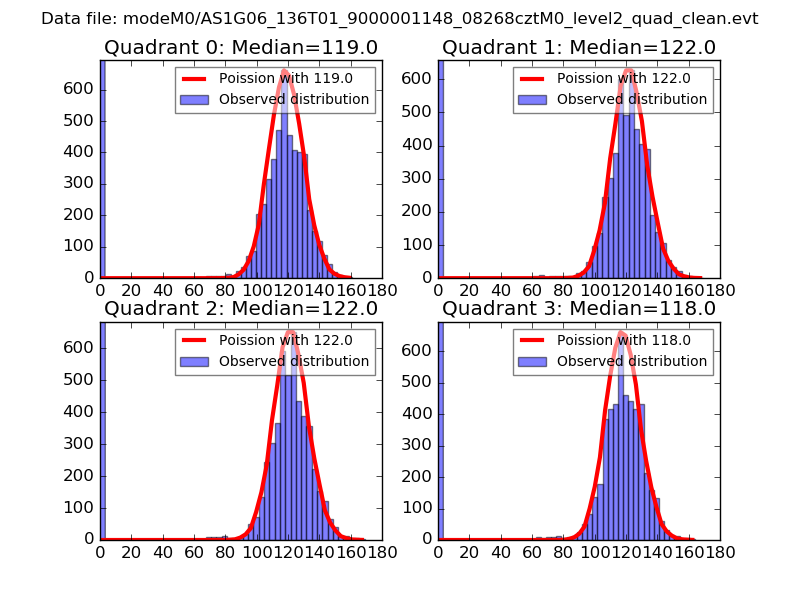
| Comparison with Poisson distribution Blue bars denote a histogram of data divided into 1 sec bins. Red curve is a Poisson curve with rate = median count rate of data. |
 |
 |
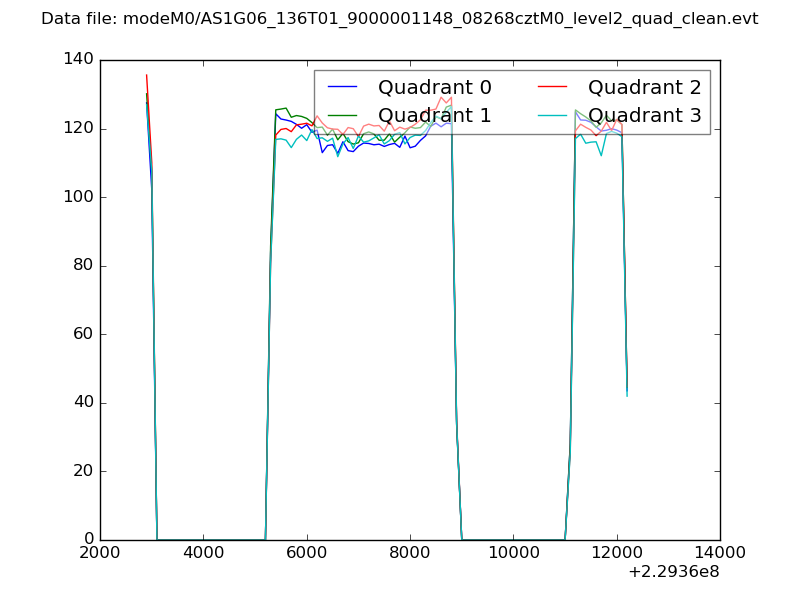
| Quadrant-wise count rates Data is divided into 100 sec bins |
 |
|
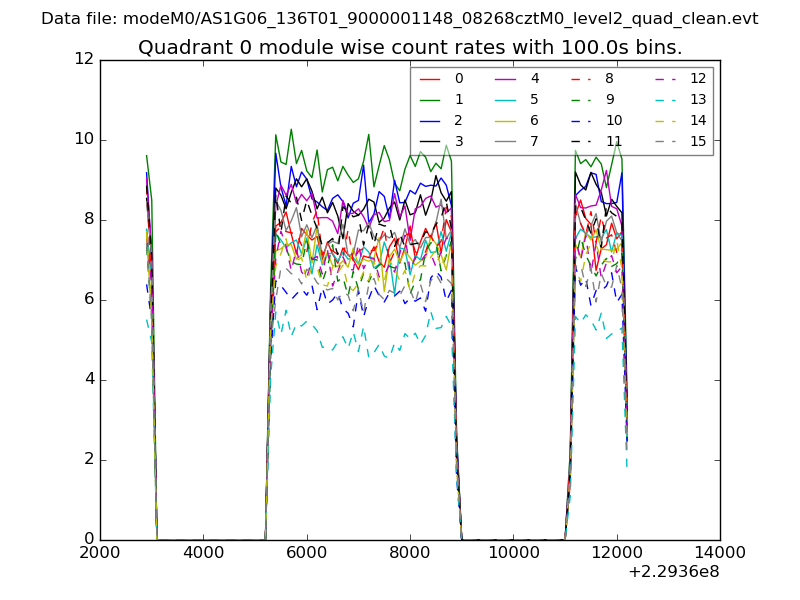
| Module-wise count rates for Quadrant A Data is divided into 100 sec bins |
 |
 |
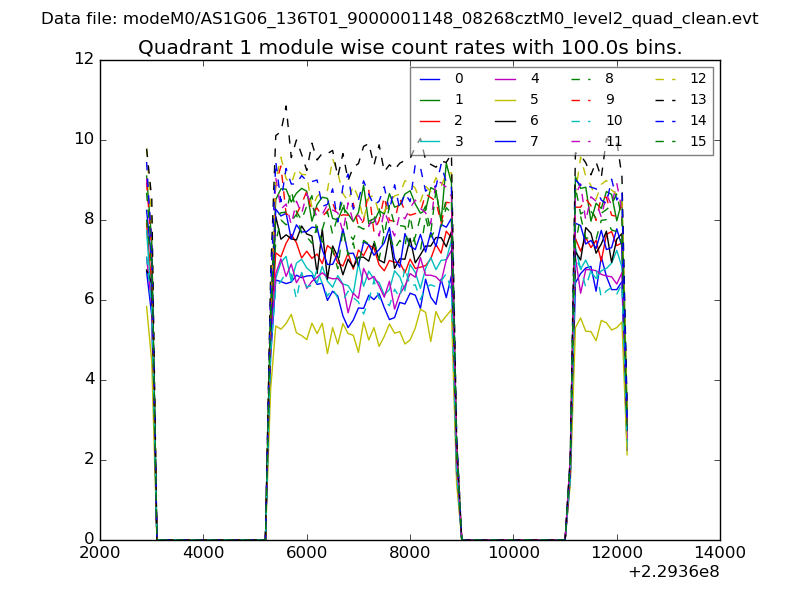
| Module-wise count rates for Quadrant B Data is divided into 100 sec bins |
 |
 |
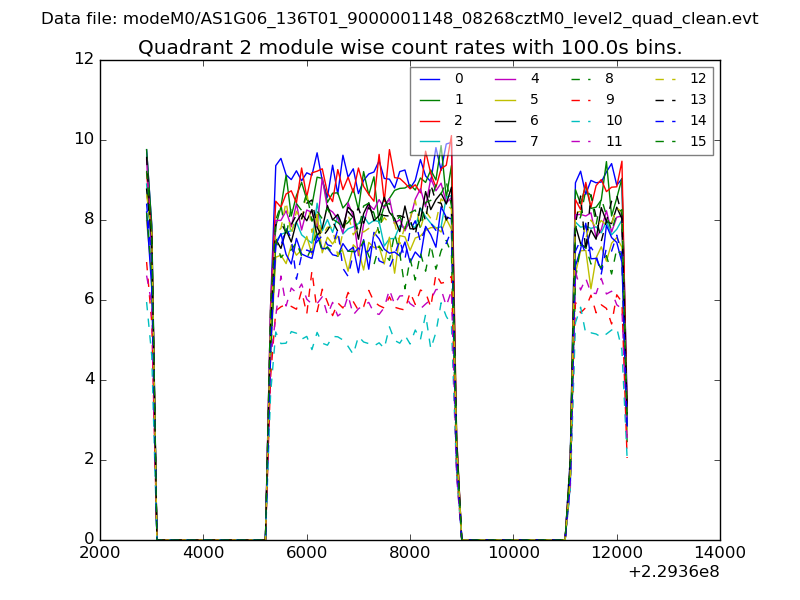
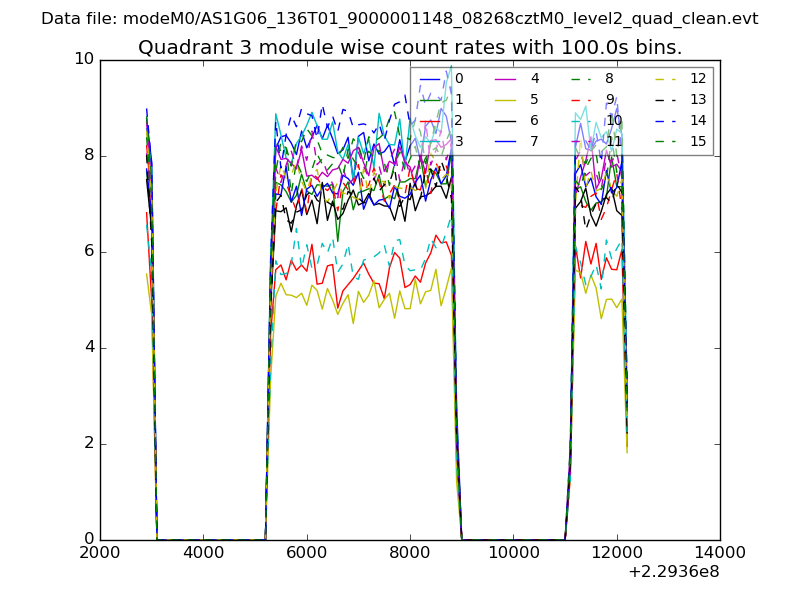
| Module-wise count rates for Quadrant C Data is divided into 100 sec bins |
 |
 |
| Module-wise count rates for Quadrant D Data is divided into 100 sec bins |
 |
 |
| Parameter | Plot |
|---|---|
| CZT HV Monitor | 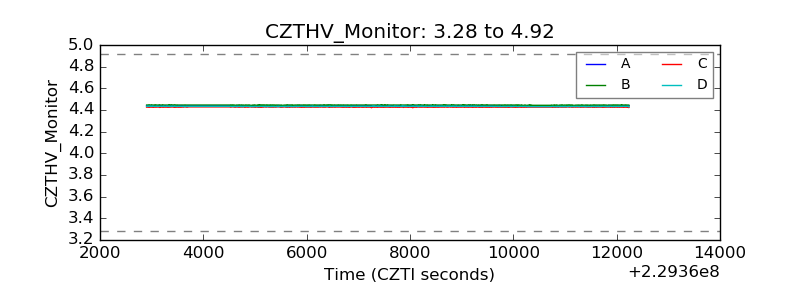 |
| D_VDD |  |
| Temperature 1 |  |
| Veto HV Monitor |  |
| Veto LLD |  |
| Alpha Counter | 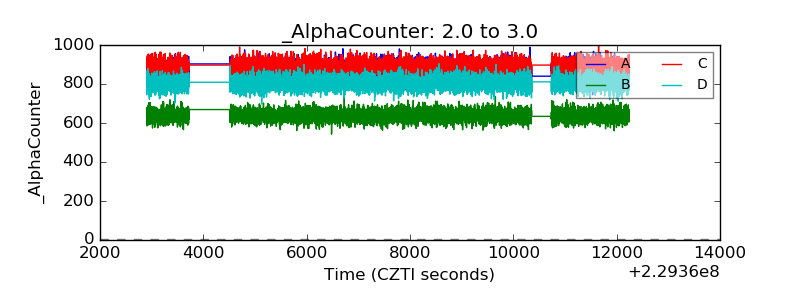 |
| _CPM_Rate | 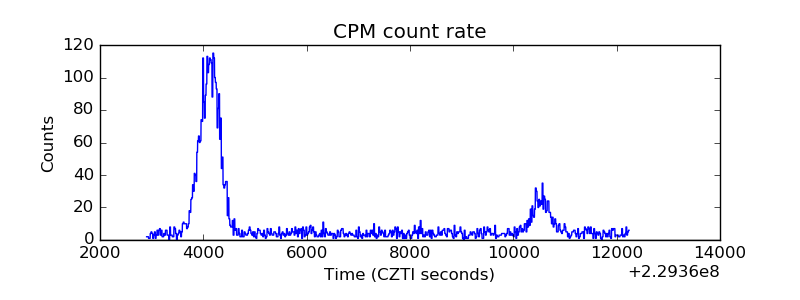 |
| CZT Counter |  |
| +2.5 Volts monitor |  |
| +5 Volts monitor |  |
| _ROLL_ROT | 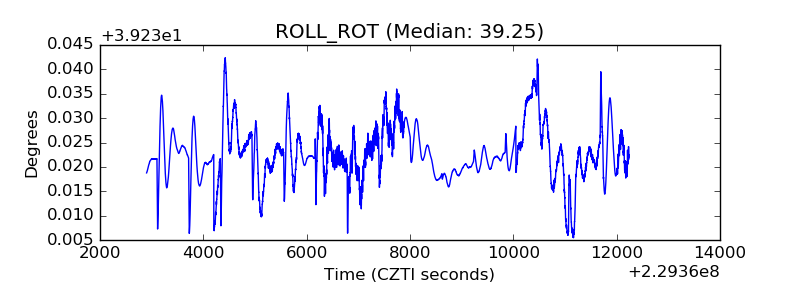 |
| _Roll_DEC |  |
| _Roll_RA |  |
| Veto Counter | 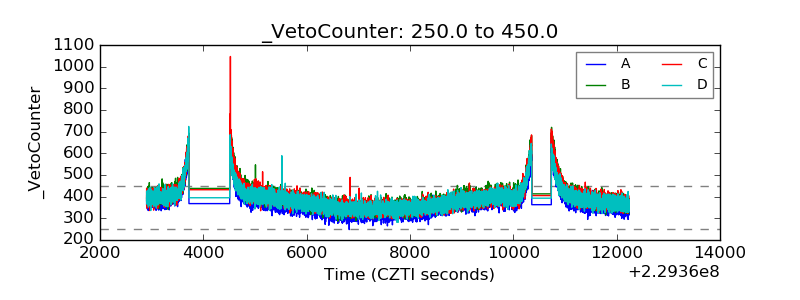 |