| Param | Original file | Final file |
|---|---|---|
| Filename | modeM0/AS1G06_136T01_9000001148_08269cztM0_level2.evt | modeM0/AS1G06_136T01_9000001148_08269cztM0_level2_quad_clean.evt |
| Size (bytes) | 156,015,360 | 38,306,880 |
| Size | 148.8 MB | 36.5 MB |
| Events in quadrant A | 1,083,692 | 244,925 |
| Events in quadrant B | 1,162,080 | 249,160 |
| Events in quadrant C | 1,146,588 | 248,723 |
| Events in quadrant D | 1,163,908 | 241,147 |
| Mode SS | |||
|---|---|---|---|
| Quadrant | BADHDUFLAG | Total packets | Discarded packets |
| A | 0 | 48 | 0 |
| B | 0 | 48 | 0 |
| C | 0 | 48 | 0 |
| D | 0 | 48 | 0 |
| Mode M0 | |||
|---|---|---|---|
| Quadrant | BADHDUFLAG | Total packets | Discarded packets |
| A | 0 | 4995 | 0 |
| B | 0 | 5133 | 0 |
| C | 0 | 5124 | 0 |
| D | 0 | 5187 | 0 |
| Quadrant | Total seconds | Saturated seconds | Saturation percentage |
|---|---|---|---|
| A | 2447 | 5 | 0.204332% |
| B | 2447 | 8 | 0.326931% |
| C | 2447 | 10 | 0.408664% |
| D | 2447 | 13 | 0.531263% |
Noise dominated data is calculated using 1-second bins in cleaned event files. If a bin has >2000 counts, and if more than 50% of those come from <1% of pixels, then it is considered to be noise-dominated and hence unusable.
| Quadrant | # 1 sec bins | Bins with >0 counts | Bins with >2000 counts | High rate bins dominated by noise | Noise dominated (total time) | Noise dominated (detector-on time) | Marked lightcurve |
|---|---|---|---|---|---|---|---|
| A | 2447 | 2447 | 0 | 0 | 0.00% | 0.00% | 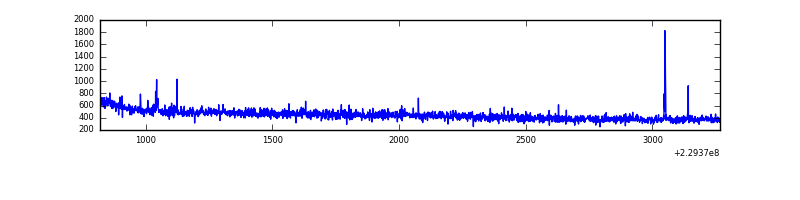 |
| B | 2447 | 2447 | 1 | 1 | 0.04% | 0.04% | 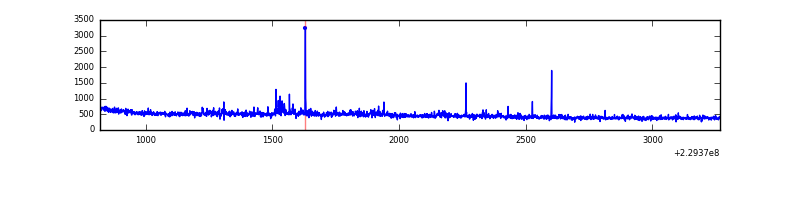 |
| C | 2447 | 2447 | 8 | 8 | 0.33% | 0.33% | 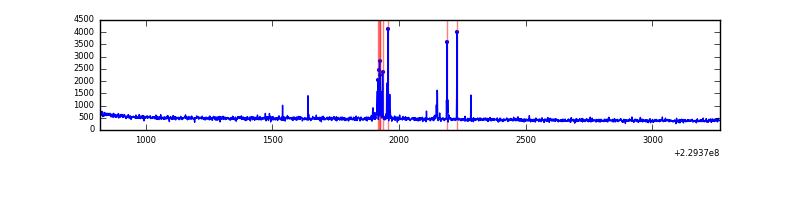 |
| D | 2447 | 2447 | 14 | 14 | 0.57% | 0.57% | 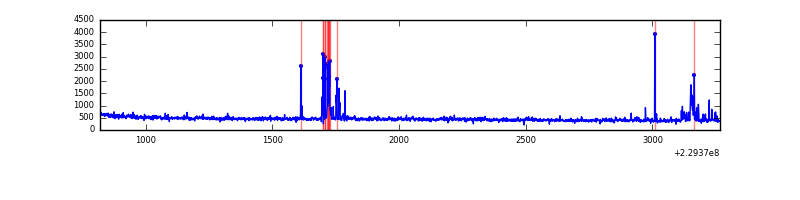 |
Top three noisy pixels from each quadrant. If the there are fewer than three noisy pixels in the level2.evt file, extra rows are filled as -1
| Pixel properties | Quadrant properties | ||||||
|---|---|---|---|---|---|---|---|
| Quadrant | DetID | PixID | Counts | Sigma | Mean | Median | Sigma |
| A | 0 | 254 | 9786 | 159.83 | 279 | 272 | 59.5 |
| A | 0 | 226 | 2563 | 38.49 | 279 | 272 | 59.5 |
| A | 12 | 194 | 2473 | 36.97 | 279 | 272 | 59.5 |
| B | 11 | 51 | 32375 | 568.08 | 284 | 276 | 56.5 |
| B | 4 | 81 | 14588 | 253.29 | 284 | 276 | 56.5 |
| B | 0 | 214 | 6341 | 107.34 | 284 | 276 | 56.5 |
| C | 9 | 54 | 57425 | 856.92 | 279 | 280 | 66.7 |
| C | 13 | 61 | 2064 | 26.75 | 279 | 280 | 66.7 |
| C | 3 | 202 | 681 | 6.01 | 279 | 280 | 66.7 |
| D | 1 | 52 | 36767 | 534.76 | 276 | 269 | 68.3 |
| D | 13 | 105 | 34867 | 506.92 | 276 | 269 | 68.3 |
| D | 2 | 152 | 25945 | 376.2 | 276 | 269 | 68.3 |
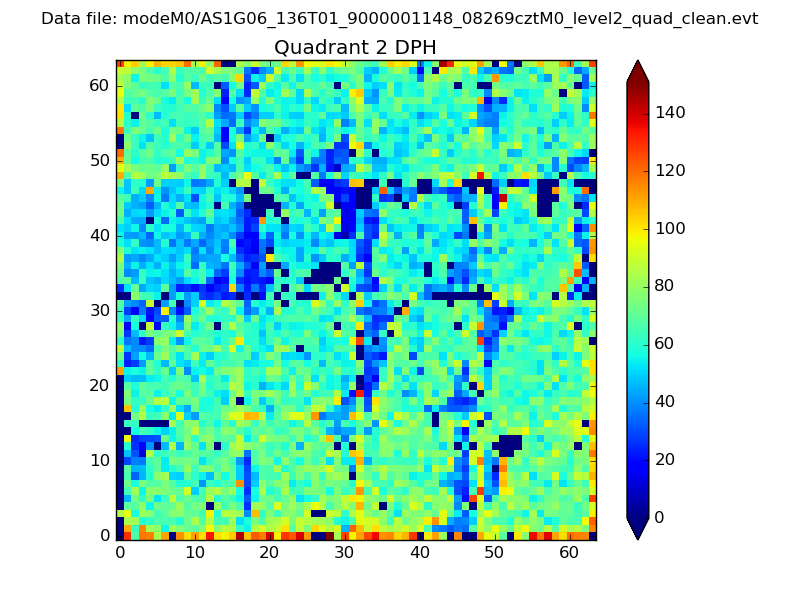
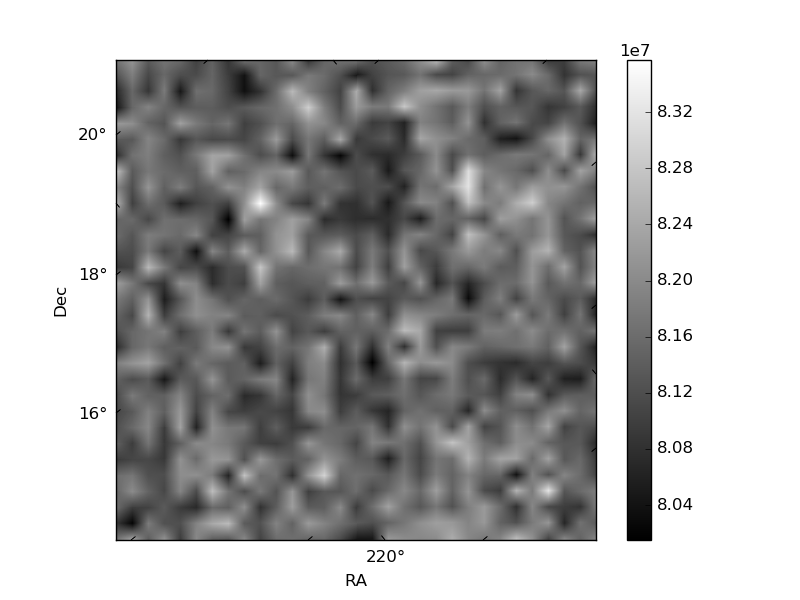
Histogram calculated using DETX and DETY for each event in the final _common_clean file
| Quadrant A |  |
 |
Quadrant B |
|---|---|---|---|
| Quadrant D | 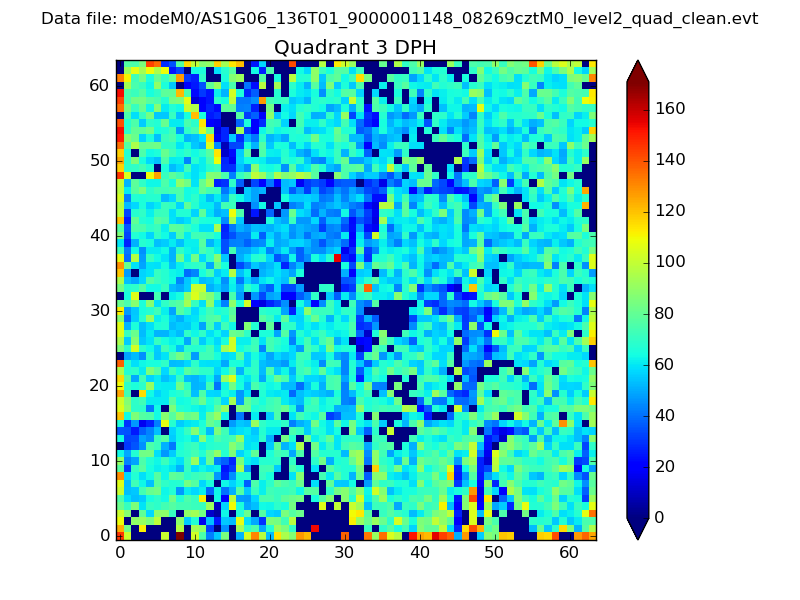 |
 |
Quadrant C |
| Plot type | Count rate plots | Images |
|---|---|---|
| Comparison with Poisson distribution Blue bars denote a histogram of data divided into 1 sec bins. Red curve is a Poisson curve with rate = median count rate of data. |
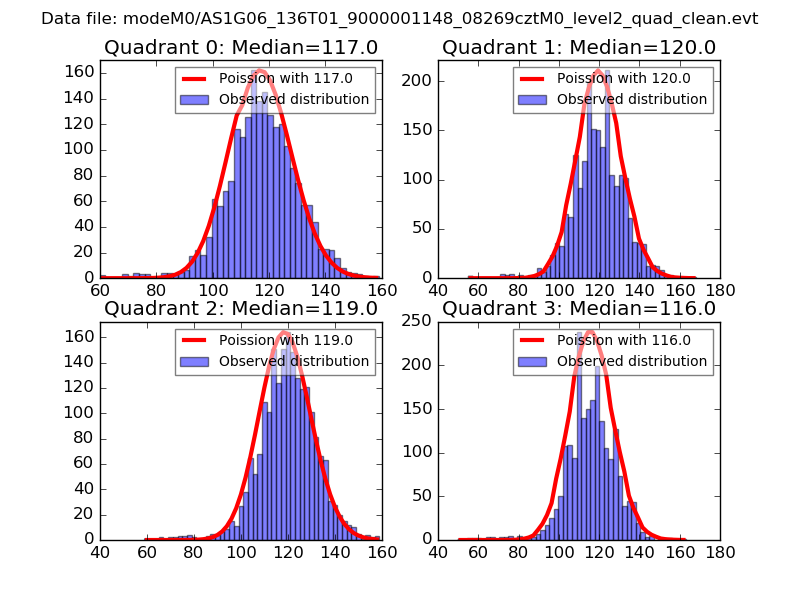 |
 |
| Quadrant-wise count rates Data is divided into 100 sec bins |
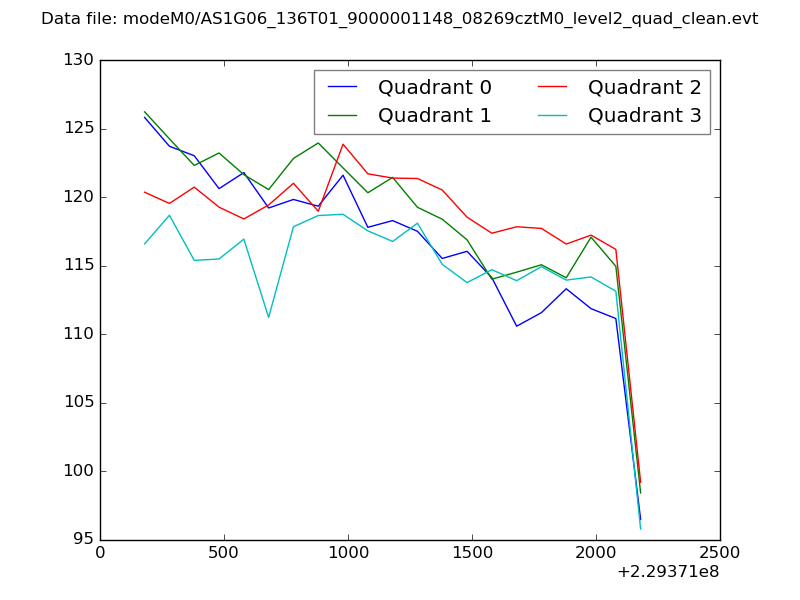 |
|
| Module-wise count rates for Quadrant A Data is divided into 100 sec bins |
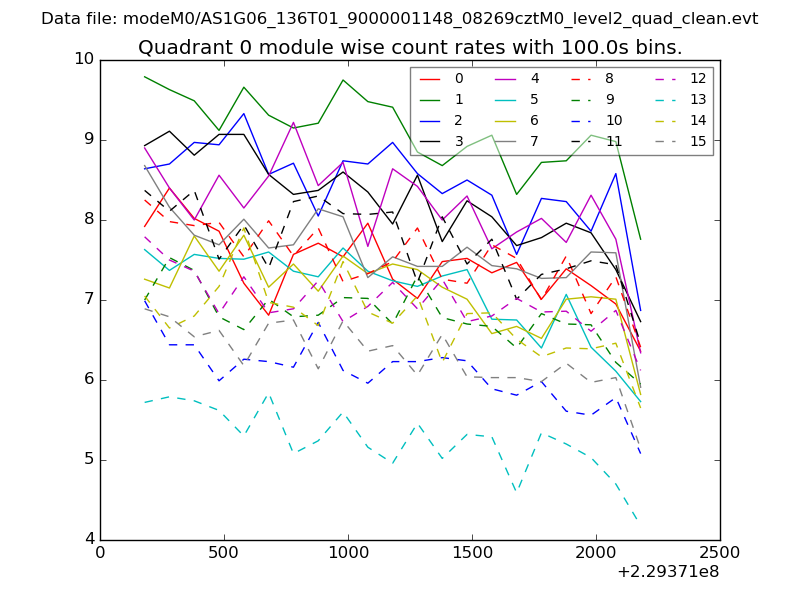 |
 |
| Module-wise count rates for Quadrant B Data is divided into 100 sec bins |
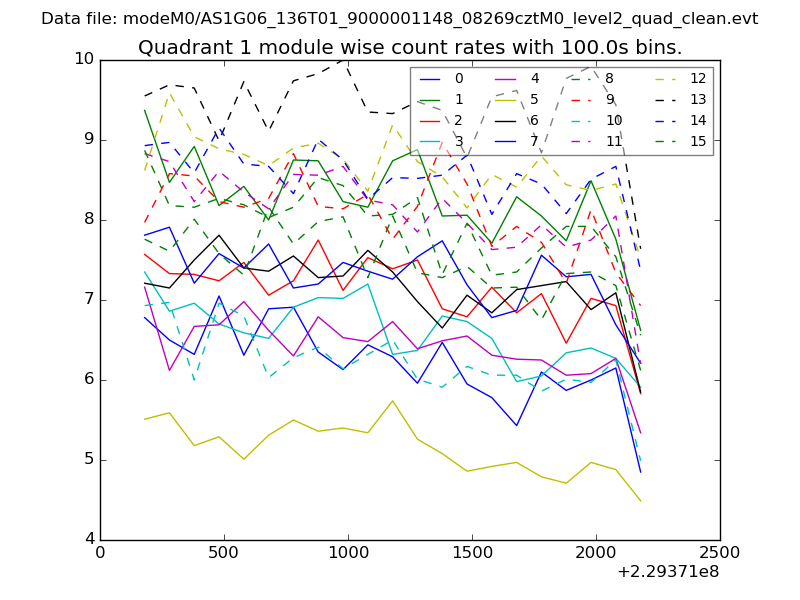 |
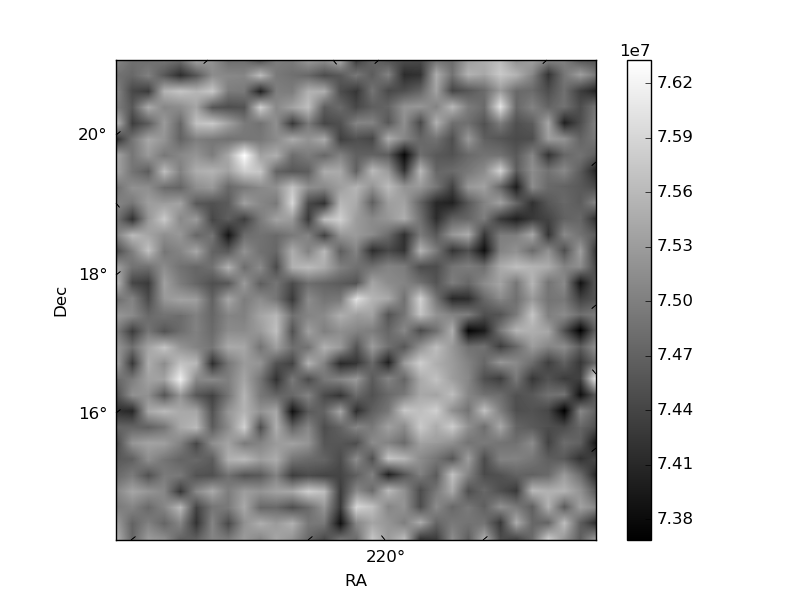 |
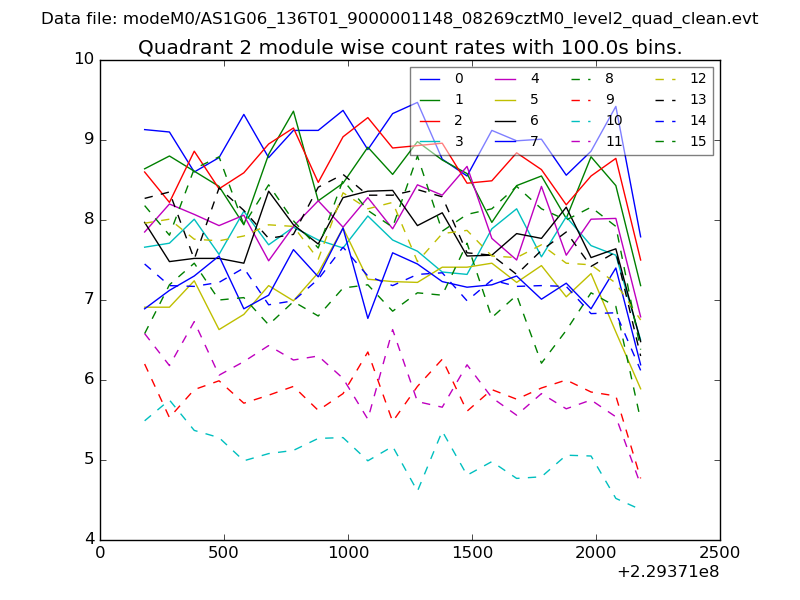
| Module-wise count rates for Quadrant C Data is divided into 100 sec bins |
 |
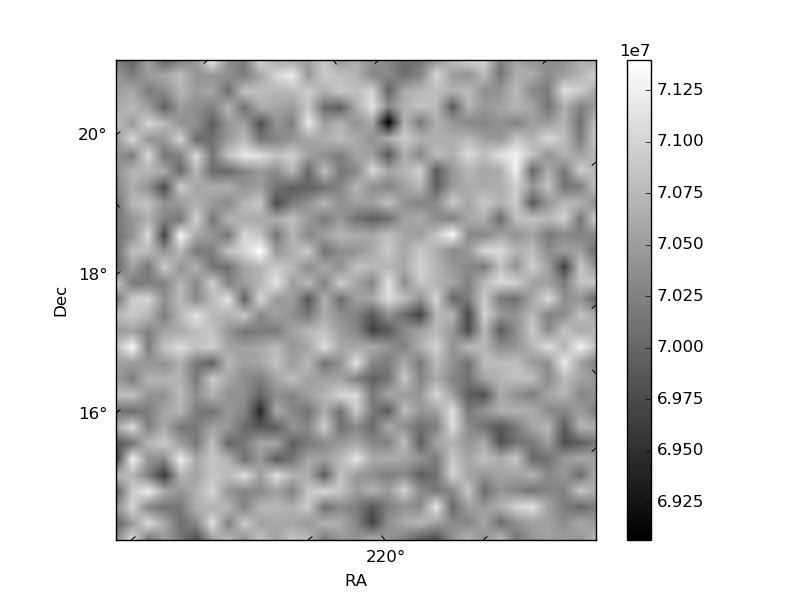 |
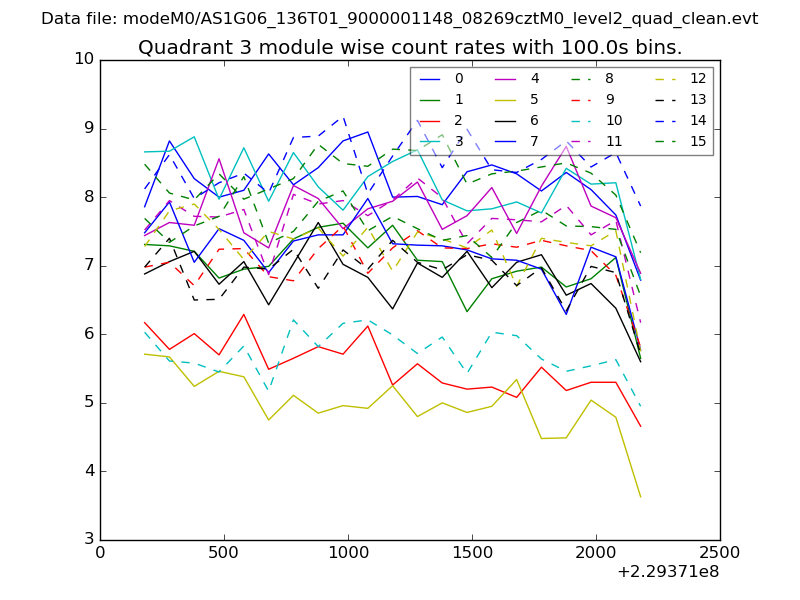
| Module-wise count rates for Quadrant D Data is divided into 100 sec bins |
 |
 |
| Parameter | Plot |
|---|---|
| CZT HV Monitor | 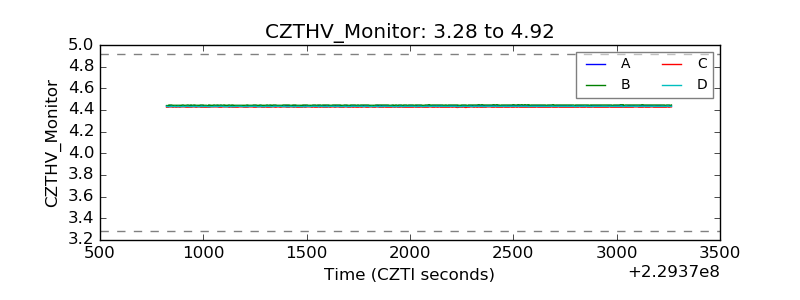 |
| D_VDD | 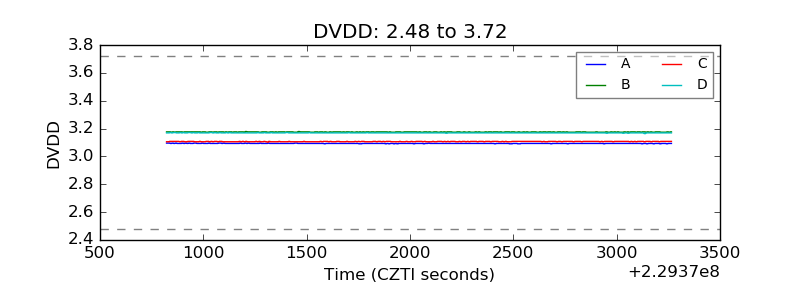 |
| Temperature 1 | 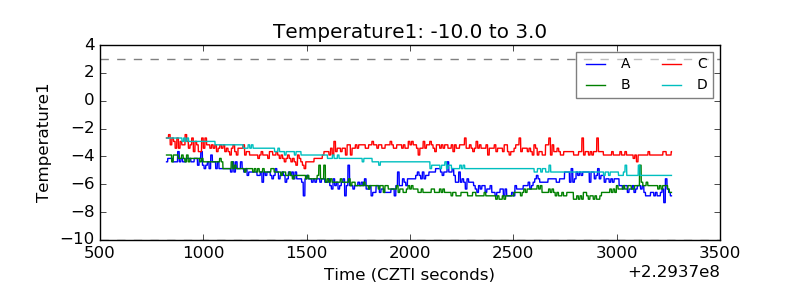 |
| Veto HV Monitor | 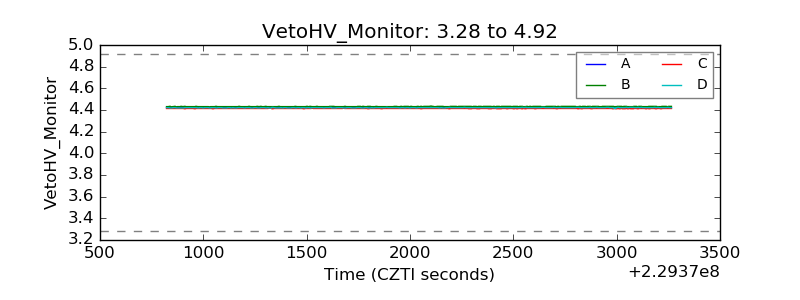 |
| Veto LLD |  |
| Alpha Counter | 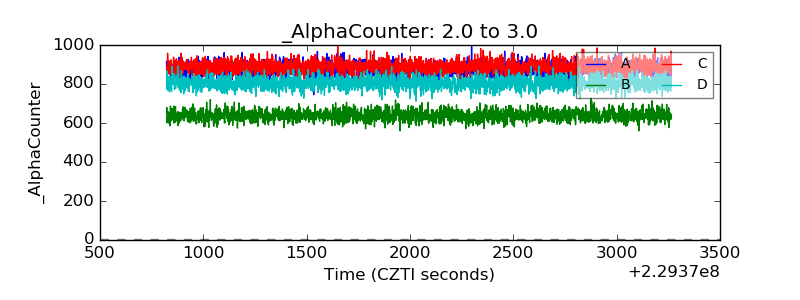 |
| _CPM_Rate | 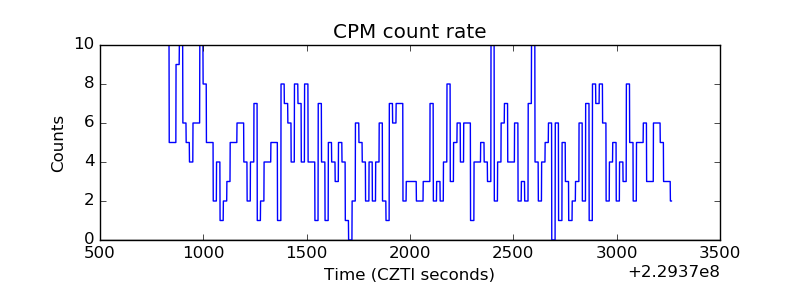 |
| CZT Counter | 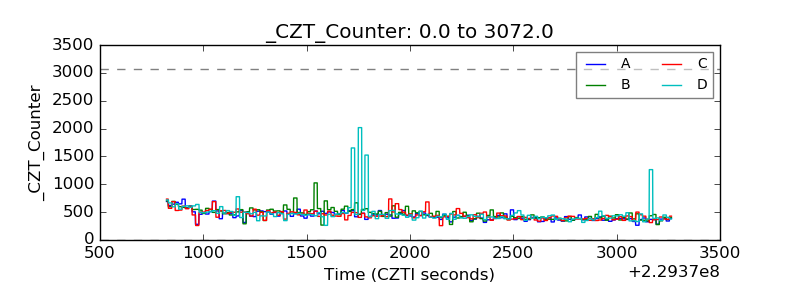 |
| +2.5 Volts monitor |  |
| +5 Volts monitor | 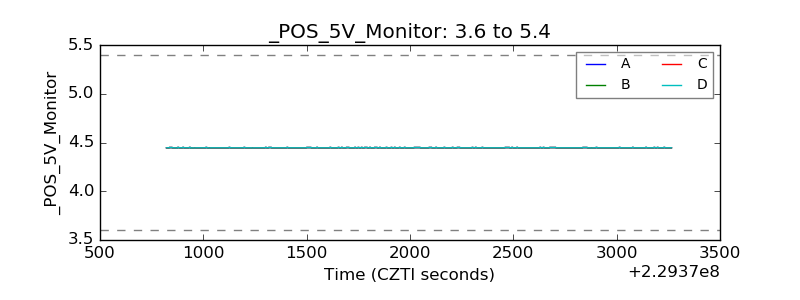 |
| _ROLL_ROT | 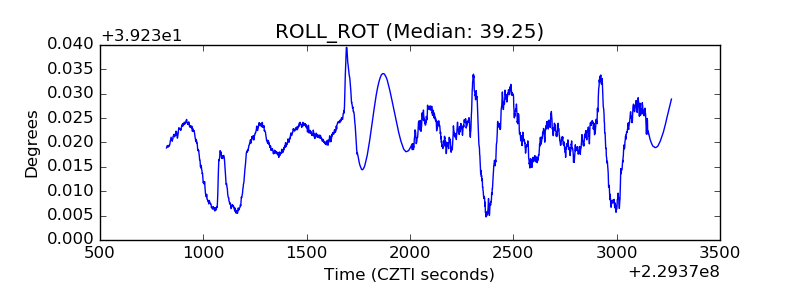 |
| _Roll_DEC | 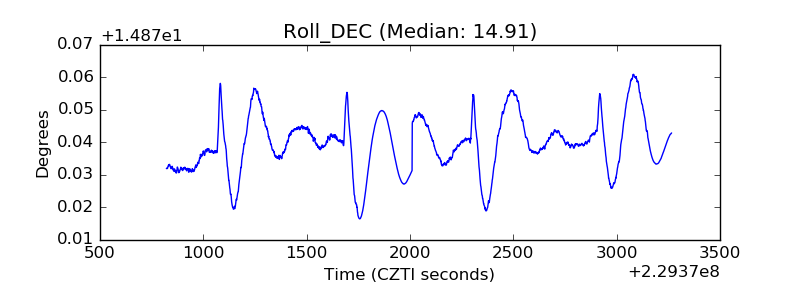 |
| _Roll_RA | 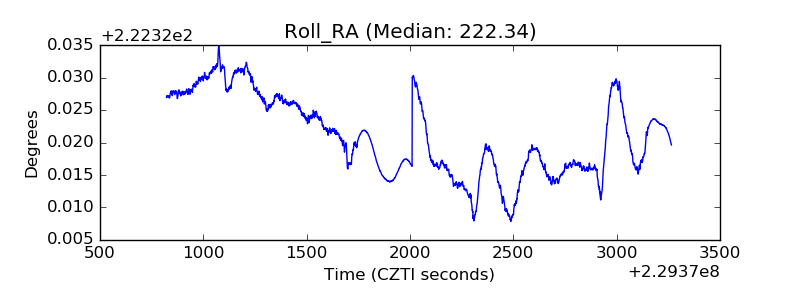 |
| Veto Counter | 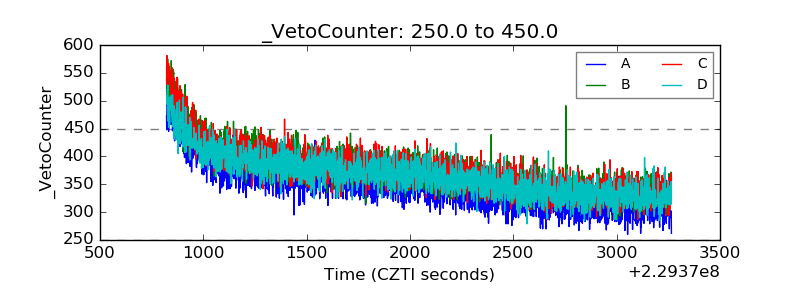 |