| Param | Original file | Final file |
|---|---|---|
| Filename | modeM0/AS1G06_136T01_9000001148_08439cztM0_level2.evt | modeM0/AS1G06_136T01_9000001148_08439cztM0_level2_quad_clean.evt |
| Size (bytes) | 40,838,400 | 12,363,840 |
| Size | 38.9 MB | 11.8 MB |
| Events in quadrant A | 293,463 | 79,187 |
| Events in quadrant B | 296,872 | 81,632 |
| Events in quadrant C | 304,375 | 82,432 |
| Events in quadrant D | 295,816 | 78,897 |
| Mode SS | |||
|---|---|---|---|
| Quadrant | BADHDUFLAG | Total packets | Discarded packets |
| A | 0 | 12 | 0 |
| B | 0 | 12 | 0 |
| C | 0 | 12 | 0 |
| D | 0 | 12 | 0 |
| Mode M0 | |||
|---|---|---|---|
| Quadrant | BADHDUFLAG | Total packets | Discarded packets |
| A | 0 | 1267 | 1 |
| B | 0 | 1268 | 0 |
| C | 0 | 1329 | 0 |
| D | 0 | 1306 | 0 |
| Quadrant | Total seconds | Saturated seconds | Saturation percentage |
|---|---|---|---|
| A | 631 | 0 | 0.000000% |
| B | 631 | 0 | 0.000000% |
| C | 631 | 1 | 0.158479% |
| D | 631 | 2 | 0.316957% |
Noise dominated data is calculated using 1-second bins in cleaned event files. If a bin has >2000 counts, and if more than 50% of those come from <1% of pixels, then it is considered to be noise-dominated and hence unusable.
| Quadrant | # 1 sec bins | Bins with >0 counts | Bins with >2000 counts | High rate bins dominated by noise | Noise dominated (total time) | Noise dominated (detector-on time) | Marked lightcurve |
|---|---|---|---|---|---|---|---|
| A | 632 | 632 | 0 | 0 | 0.00% | 0.00% | 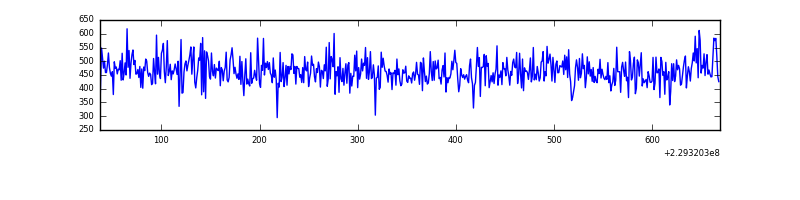 |
| B | 632 | 632 | 0 | 0 | 0.00% | 0.00% | 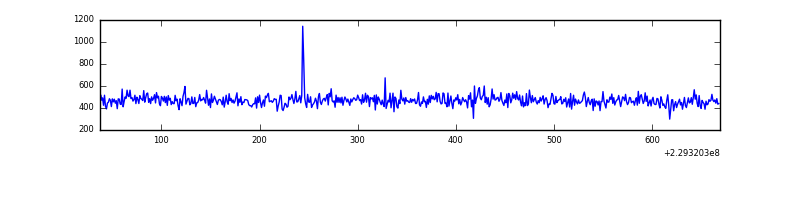 |
| C | 632 | 632 | 1 | 1 | 0.16% | 0.16% |  |
| D | 632 | 632 | 2 | 2 | 0.32% | 0.32% | 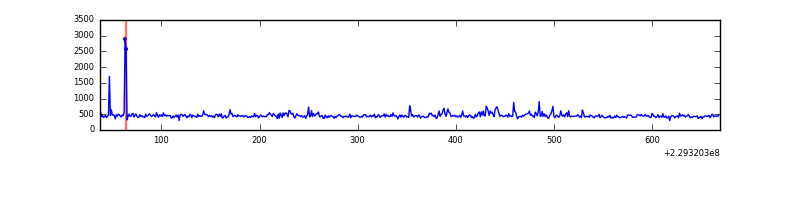 |
Top three noisy pixels from each quadrant. If the there are fewer than three noisy pixels in the level2.evt file, extra rows are filled as -1
| Pixel properties | Quadrant properties | ||||||
|---|---|---|---|---|---|---|---|
| Quadrant | DetID | PixID | Counts | Sigma | Mean | Median | Sigma |
| A | 13 | 248 | 1514 | 81.72 | 75 | 74 | 17.6 |
| A | 0 | 128 | 1341 | 71.9 | 75 | 74 | 17.6 |
| A | 0 | 226 | 778 | 39.95 | 75 | 74 | 17.6 |
| B | 0 | 214 | 4327 | 255.52 | 74 | 73 | 16.6 |
| B | 15 | 204 | 2274 | 132.2 | 74 | 73 | 16.6 |
| B | 12 | 111 | 1564 | 89.56 | 74 | 73 | 16.6 |
| C | 13 | 255 | 22315 | 1223.81 | 71 | 71 | 18.2 |
| C | 13 | 61 | 4003 | 216.33 | 71 | 71 | 18.2 |
| C | 3 | 202 | 174 | 5.67 | 71 | 71 | 18.2 |
| D | 13 | 174 | 6882 | 344.76 | 72 | 69 | 19.8 |
| D | 1 | 52 | 5018 | 250.44 | 72 | 69 | 19.8 |
| D | 12 | 233 | 3755 | 186.52 | 72 | 69 | 19.8 |
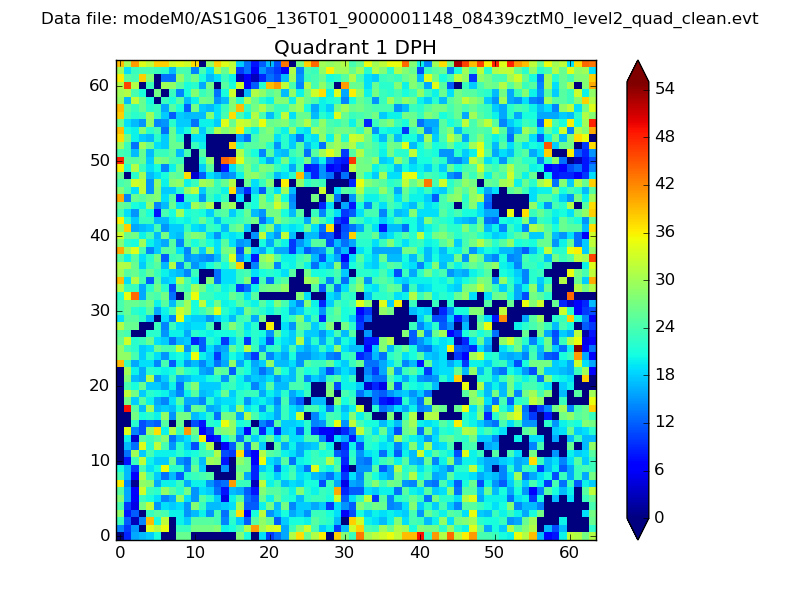
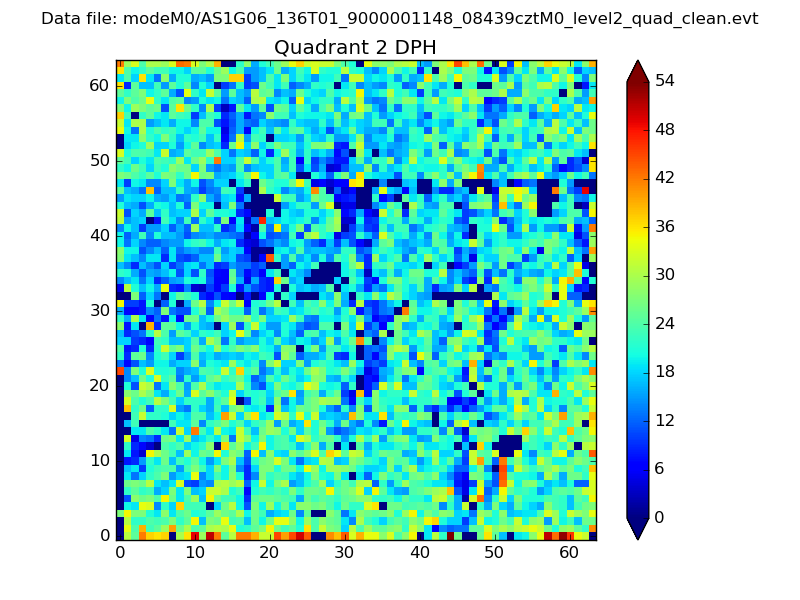
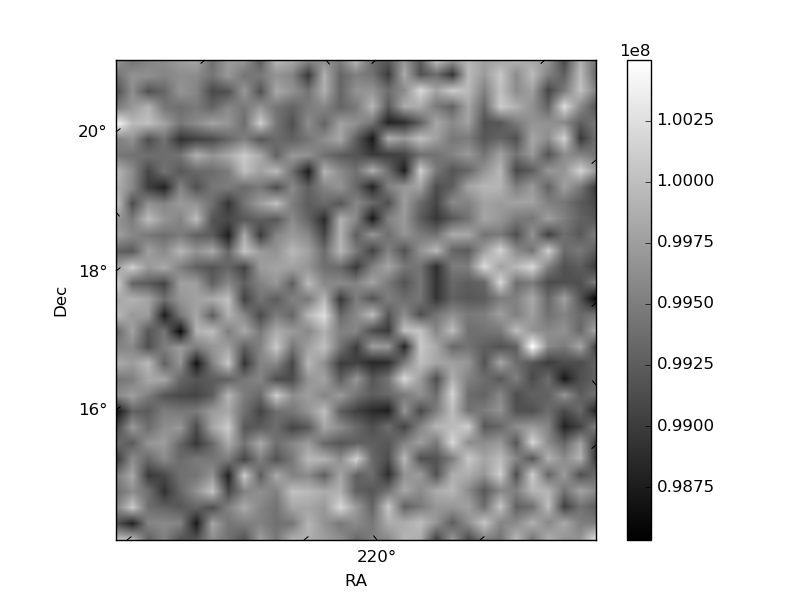
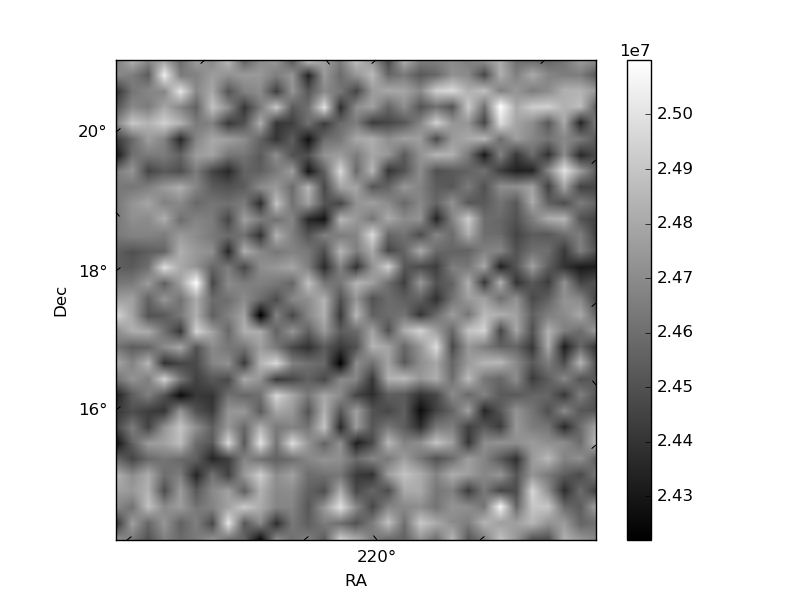
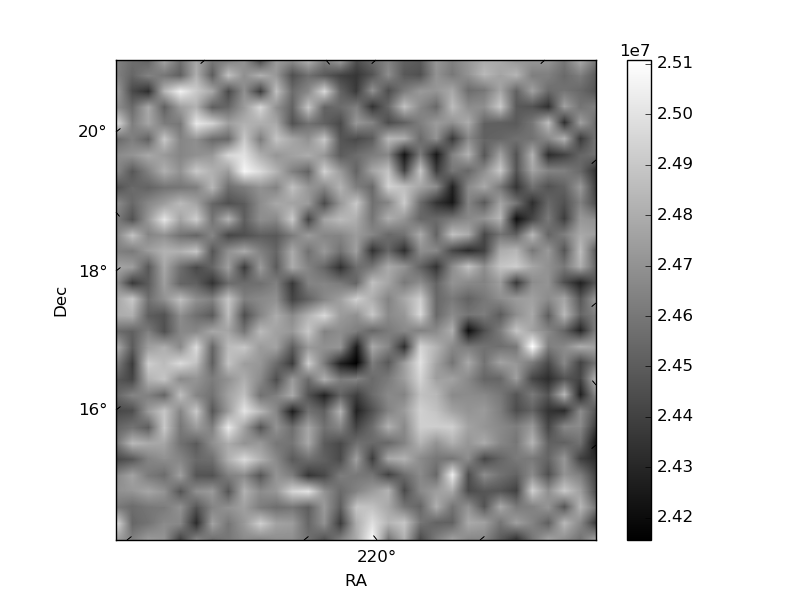
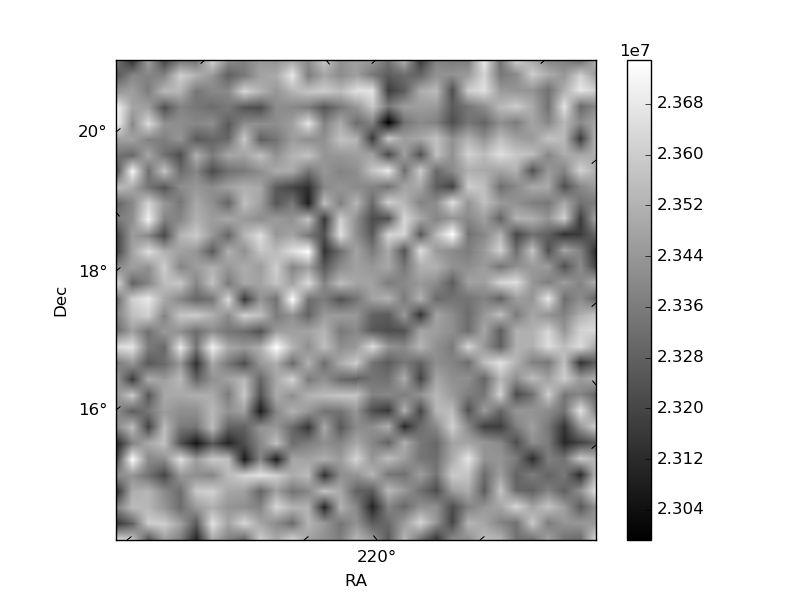
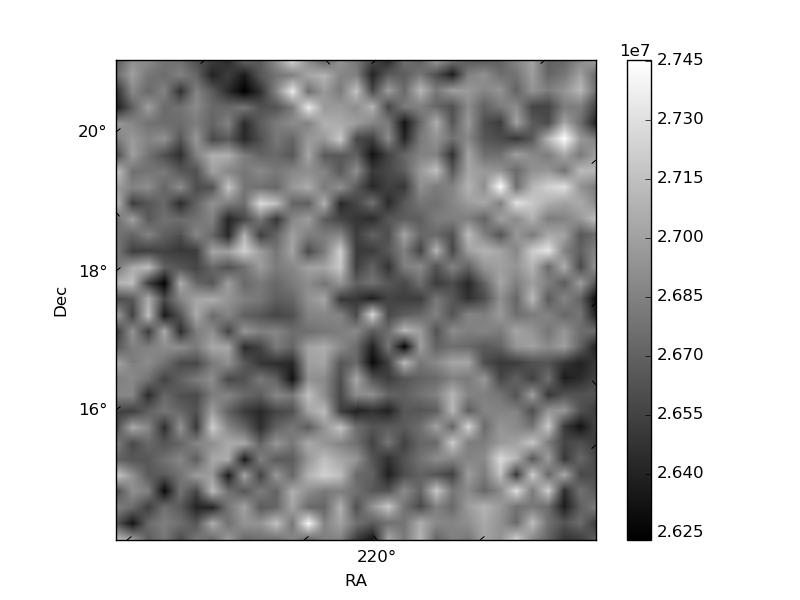
Histogram calculated using DETX and DETY for each event in the final _common_clean file
| Quadrant A | 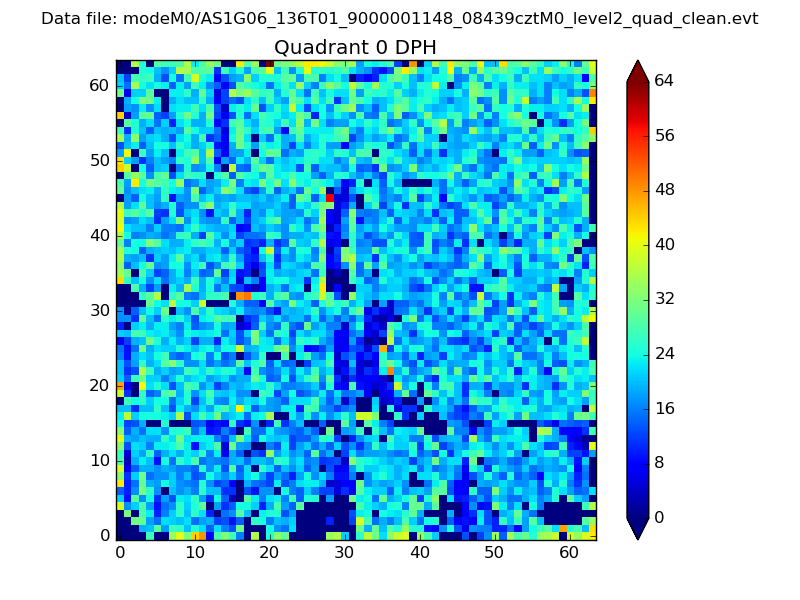 |
 |
Quadrant B |
|---|---|---|---|
| Quadrant D | 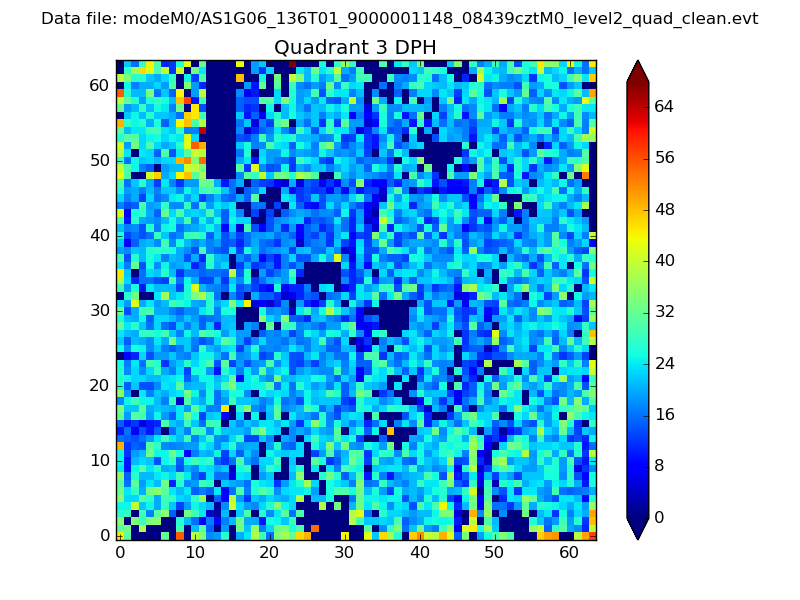 |
 |
Quadrant C |
| Plot type | Count rate plots | Images |
|---|---|---|
| Comparison with Poisson distribution Blue bars denote a histogram of data divided into 1 sec bins. Red curve is a Poisson curve with rate = median count rate of data. |
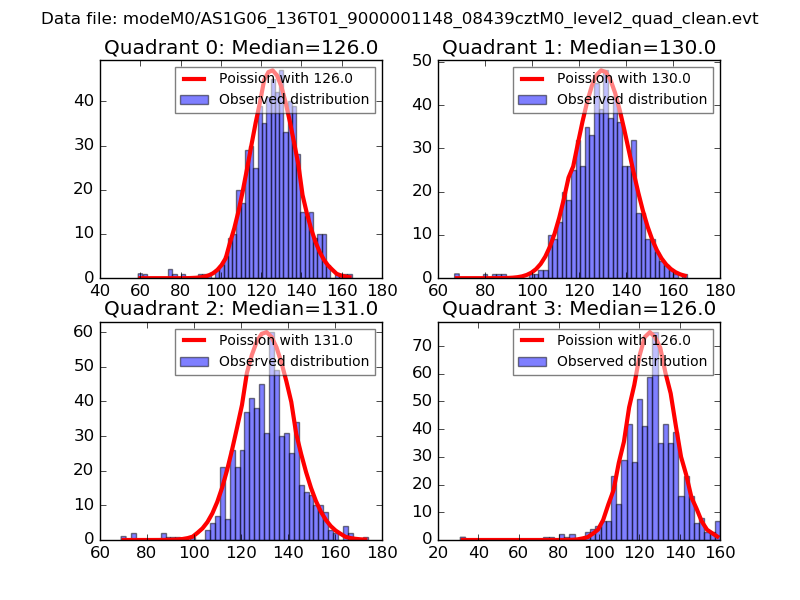 |
 |
| Quadrant-wise count rates Data is divided into 100 sec bins |
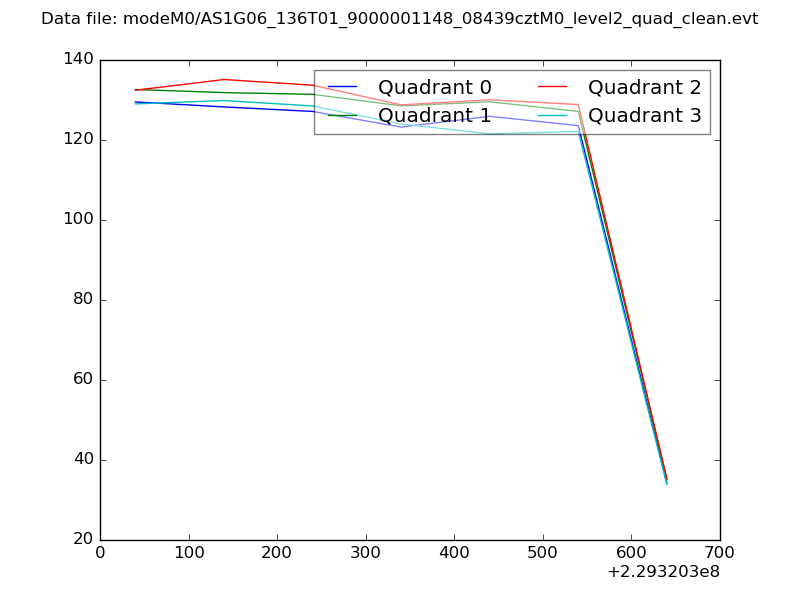 |
|
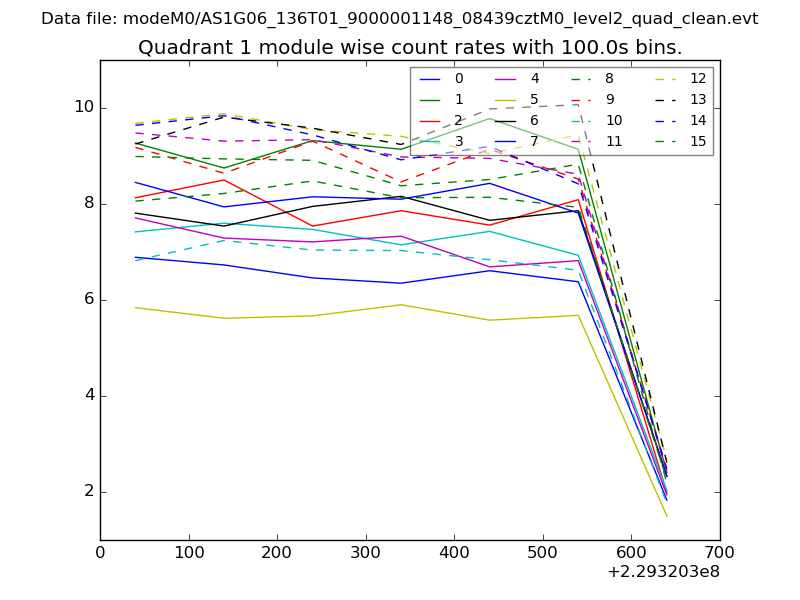
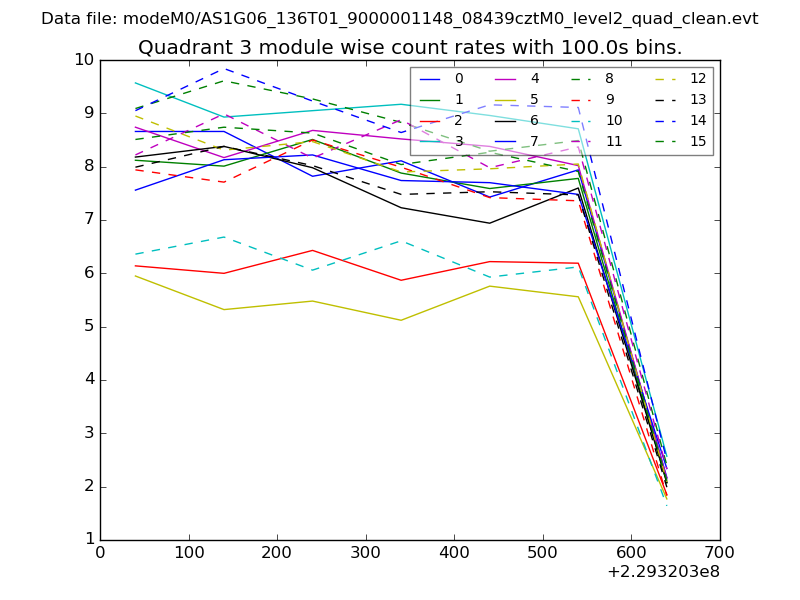
| Module-wise count rates for Quadrant A Data is divided into 100 sec bins |
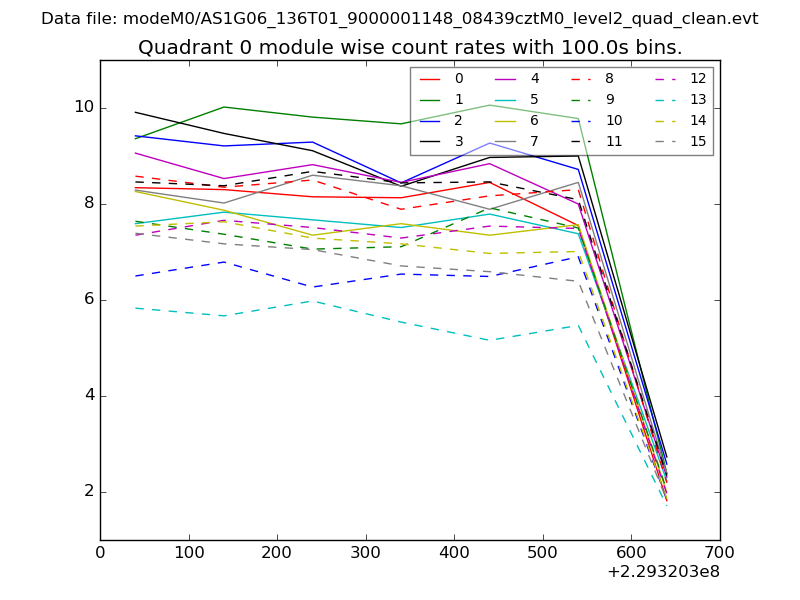 |
 |
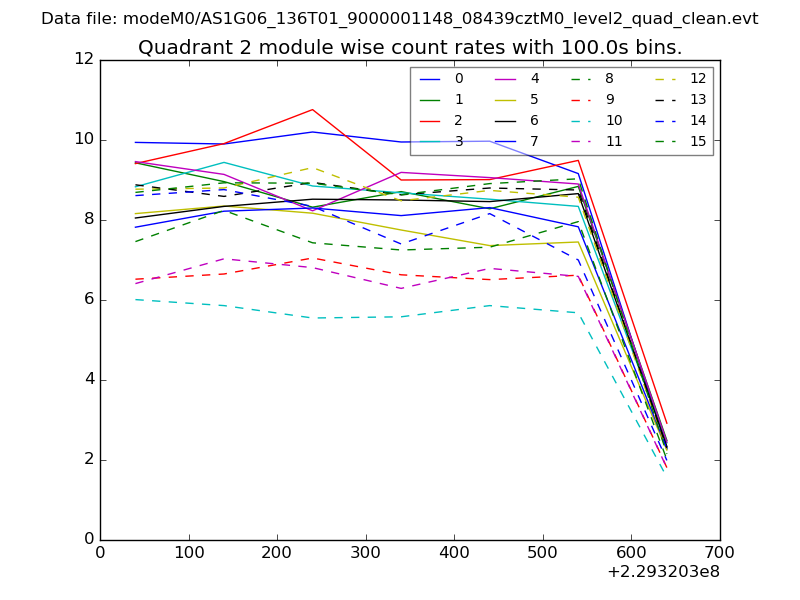
| Module-wise count rates for Quadrant B Data is divided into 100 sec bins |
 |
 |
| Module-wise count rates for Quadrant C Data is divided into 100 sec bins |
 |
 |
| Module-wise count rates for Quadrant D Data is divided into 100 sec bins |
 |
 |
| Parameter | Plot |
|---|---|
| CZT HV Monitor | 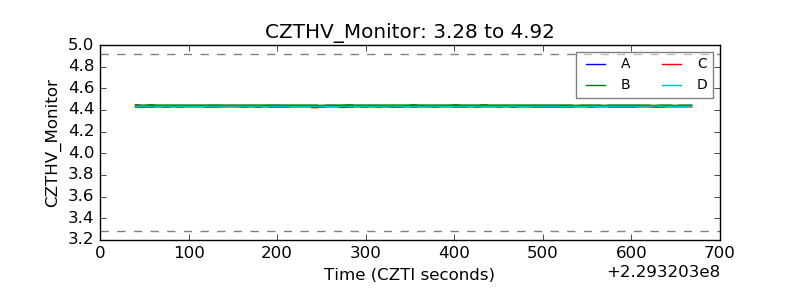 |
| D_VDD | 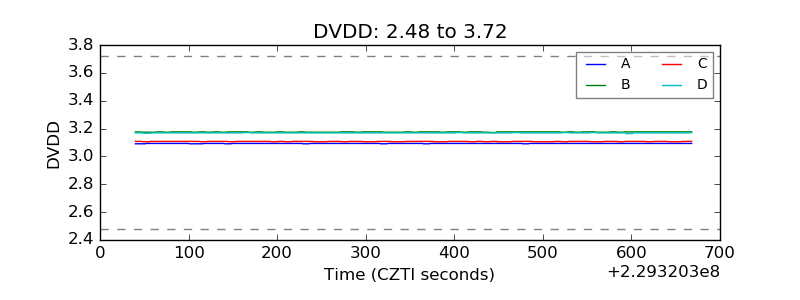 |
| Temperature 1 | 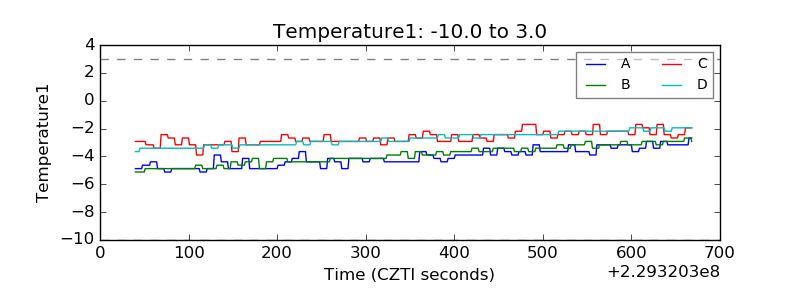 |
| Veto HV Monitor |  |
| Veto LLD | 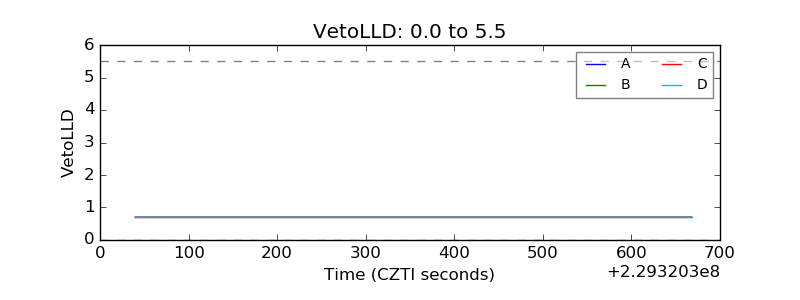 |
| Alpha Counter | 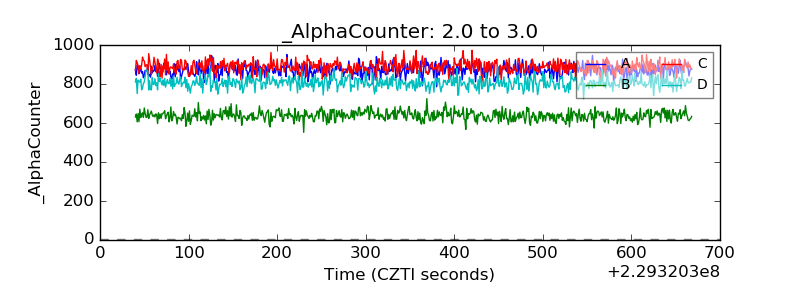 |
| _CPM_Rate | 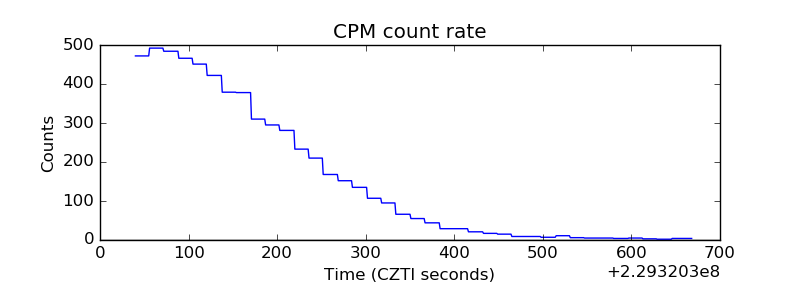 |
| CZT Counter | 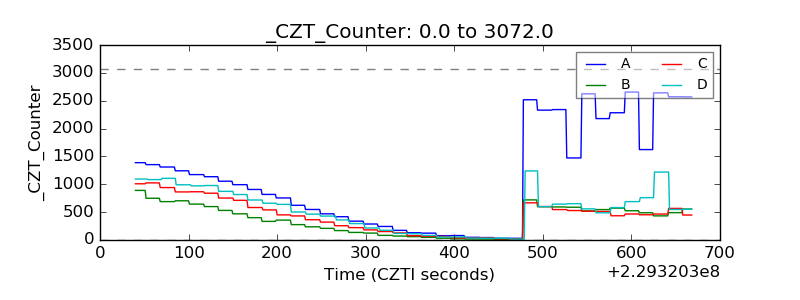 |
| +2.5 Volts monitor |  |
| +5 Volts monitor |  |
| _ROLL_ROT | 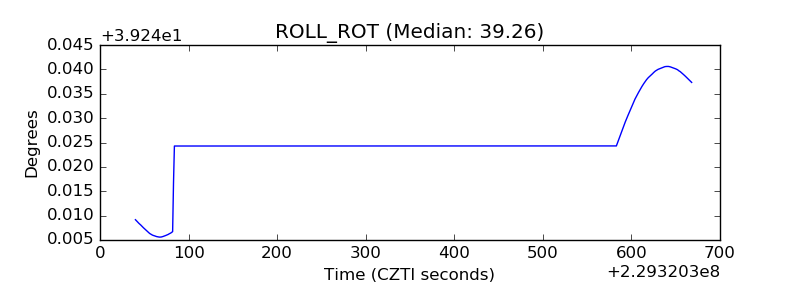 |
| _Roll_DEC | 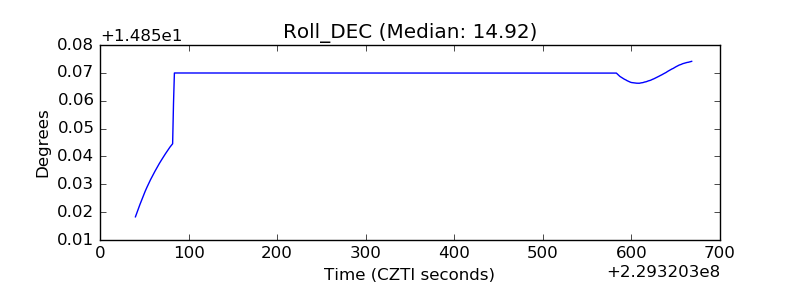 |
| _Roll_RA | 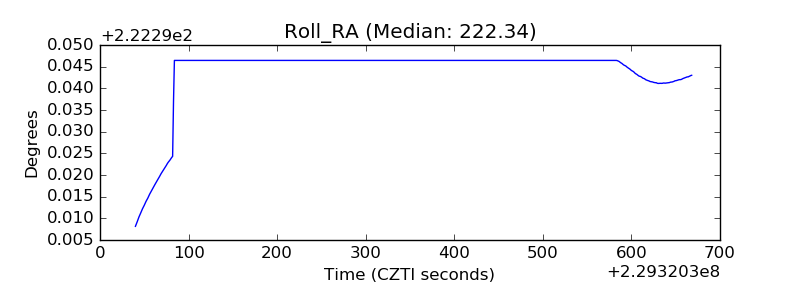 |
| Veto Counter | 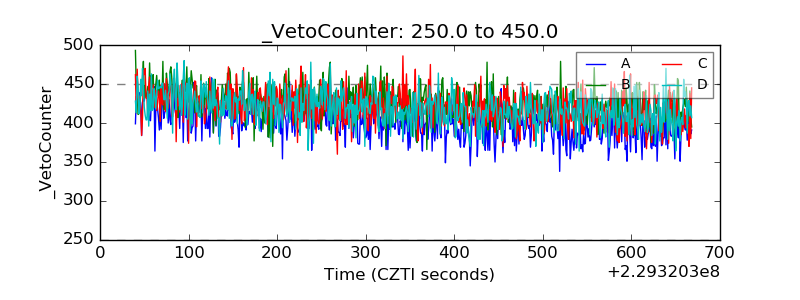 |