| Param | Original file | Final file |
|---|---|---|
| Filename | modeM0/AS1G07_065T02_9000001150cztM0_level2.fits | modeM0/AS1G07_065T02_9000001150cztM0_level2_quad_clean.evt |
| Size (bytes) | 747,118,080 | 791,104,320 |
| Size | 712.5 MB | 754.5 MB |
| Events in quadrant A | 4,504,590 | 4,833,291 |
| Events in quadrant B | 4,350,018 | 4,814,698 |
| Events in quadrant C | 4,455,554 | 4,612,071 |
| Events in quadrant D | 3,821,592 | 4,205,950 |
| Mode M9 | |||
|---|---|---|---|
| Quadrant | BADHDUFLAG | Total packets | Discarded packets |
| A | 0 | 114 | 0 |
| B | 0 | 114 | 0 |
| C | 0 | 114 | 0 |
| D | 0 | 114 | 0 |
| Mode M0 | |||
|---|---|---|---|
| Quadrant | BADHDUFLAG | Total packets | Discarded packets |
| A | 0 | 165070 | 0 |
| B | 0 | 172283 | 0 |
| C | 0 | 164575 | 0 |
| D | 0 | 190970 | 0 |
| Mode SS | |||
|---|---|---|---|
| Quadrant | BADHDUFLAG | Total packets | Discarded packets |
| A | 0 | 1638 | 0 |
| B | 0 | 1636 | 0 |
| C | 0 | 1636 | 0 |
| D | 0 | 1638 | 0 |
| Quadrant | Total seconds | Saturated seconds | Saturation percentage |
|---|---|---|---|
| A | 80116 | 833 | 1.039742% |
| B | 80136 | 1119 | 1.396376% |
| C | 80132 | 588 | 0.733789% |
| D | 80121 | 2037 | 2.542405% |
Noise dominated data is calculated using 1-second bins in cleaned event files. If a bin has >2000 counts, and if more than 50% of those come from <1% of pixels, then it is considered to be noise-dominated and hence unusable.
| Quadrant | # 1 sec bins | Bins with >0 counts | Bins with >2000 counts | High rate bins dominated by noise | Noise dominated (total time) | Noise dominated (detector-on time) | Marked lightcurve |
|---|---|---|---|---|---|---|---|
| A | 91829 | 80204 | 0 | 0 | 0.00% | 0.00% |  |
| B | 91829 | 80239 | 0 | 0 | 0.00% | 0.00% |  |
| C | 91829 | 80236 | 0 | 0 | 0.00% | 0.00% | 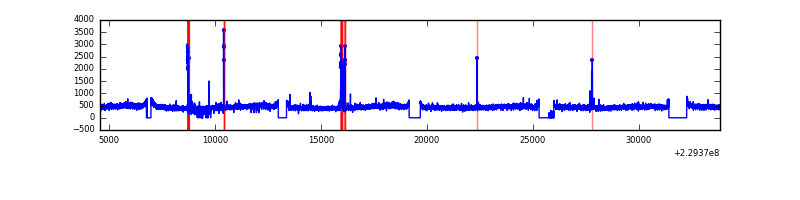 |
| D | 91829 | 80148 | 0 | 0 | 0.00% | 0.00% | 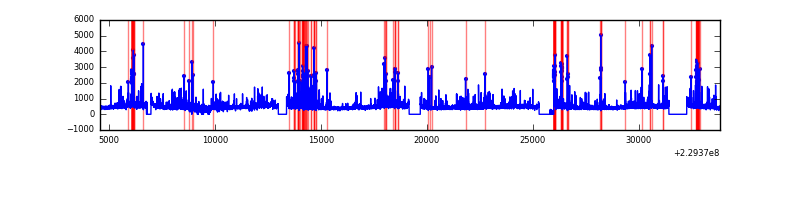 |
Top three noisy pixels from each quadrant. If the there are fewer than three noisy pixels in the level2.evt file, extra rows are filled as -1
| Pixel properties | Quadrant properties | ||||||
|---|---|---|---|---|---|---|---|
| Quadrant | DetID | PixID | Counts | Sigma | Mean | Median | Sigma |
| A | 0 | 29 | 4337 | 10.9 | 1171 | 1096 | 297.3 |
| A | 7 | 110 | 3801 | 9.1 | 1171 | 1096 | 297.3 |
| A | 9 | 19 | 3327 | 7.5 | 1171 | 1096 | 297.3 |
| B | 2 | 9 | 3729 | 11.6 | 1148 | 1093 | 227.2 |
| B | 12 | 226 | 3051 | 8.62 | 1148 | 1093 | 227.2 |
| B | 3 | 17 | 2953 | 8.19 | 1148 | 1093 | 227.2 |
| C | 1 | 80 | 3215 | 6.89 | 1175 | 1091 | 308.3 |
| C | 12 | 241 | 3158 | 6.7 | 1175 | 1091 | 308.3 |
| C | 1 | 81 | 3104 | 6.53 | 1175 | 1091 | 308.3 |
| D | 3 | 14 | 2876 | 6.47 | 1087 | 989 | 291.8 |
| D | 6 | 231 | 2772 | 6.11 | 1087 | 989 | 291.8 |
| D | 10 | 189 | 2735 | 5.98 | 1087 | 989 | 291.8 |
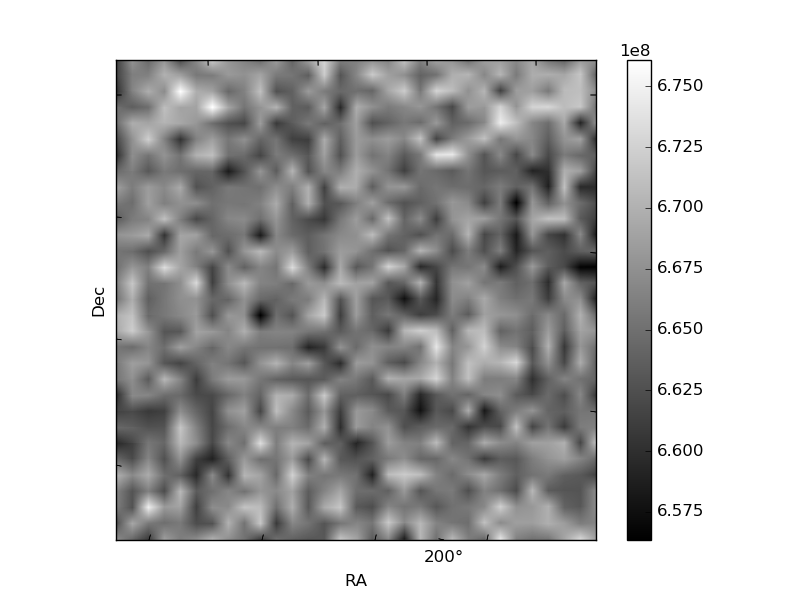
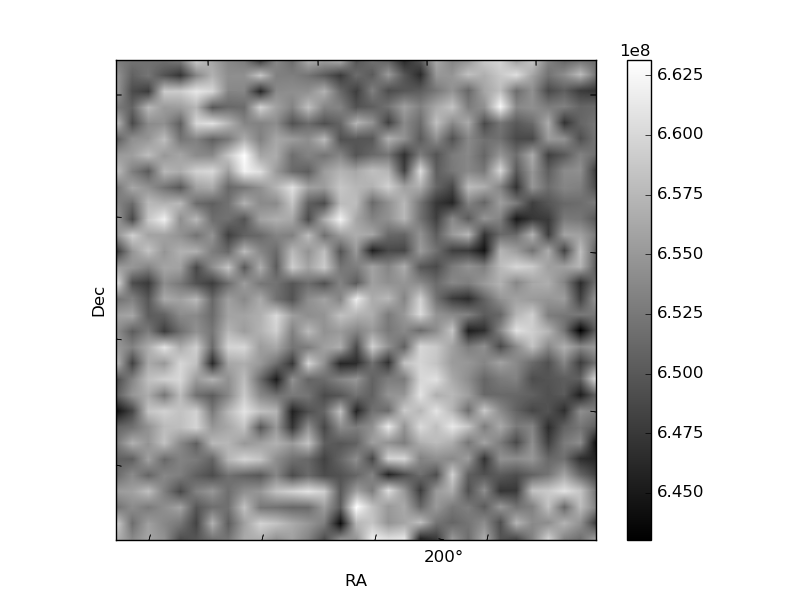
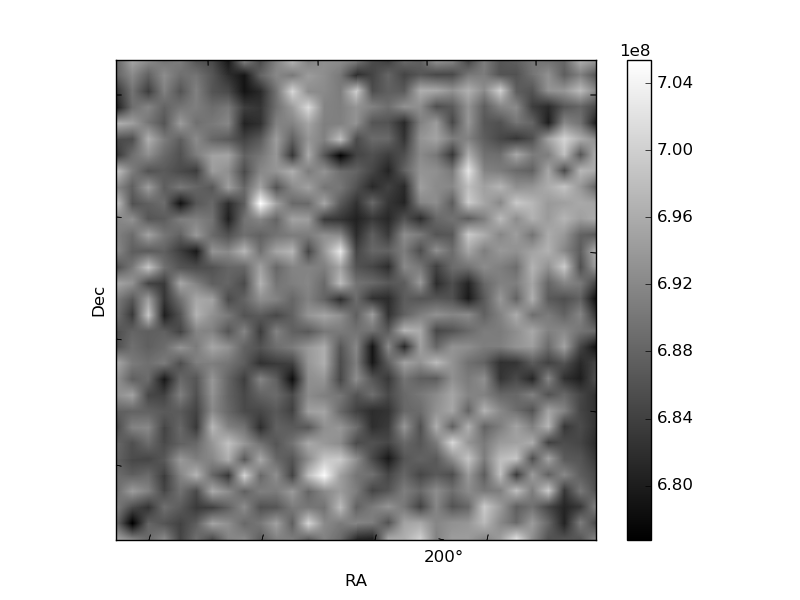
Histogram calculated using DETX and DETY for each event in the final _common_clean file
| Quadrant A |  |
 |
Quadrant B |
|---|---|---|---|
| Quadrant D | 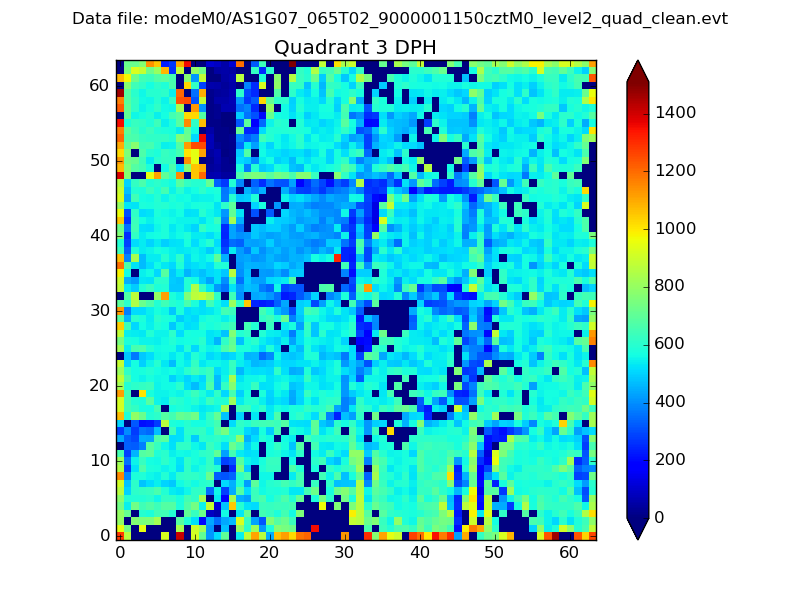 |
 |
Quadrant C |
| Plot type | Count rate plots | Images |
|---|---|---|
| Comparison with Poisson distribution Blue bars denote a histogram of data divided into 1 sec bins. Red curve is a Poisson curve with rate = median count rate of data. |
 |
 |
| Quadrant-wise count rates Data is divided into 100 sec bins |
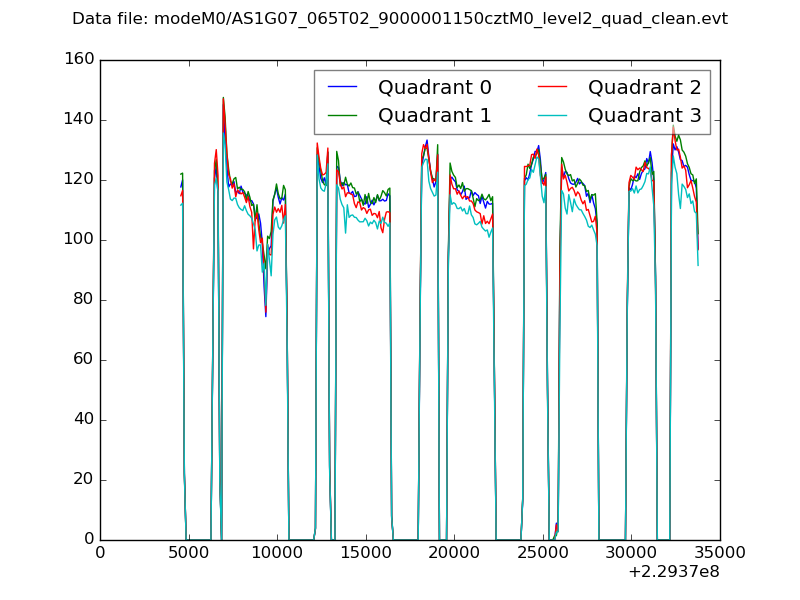 |
|
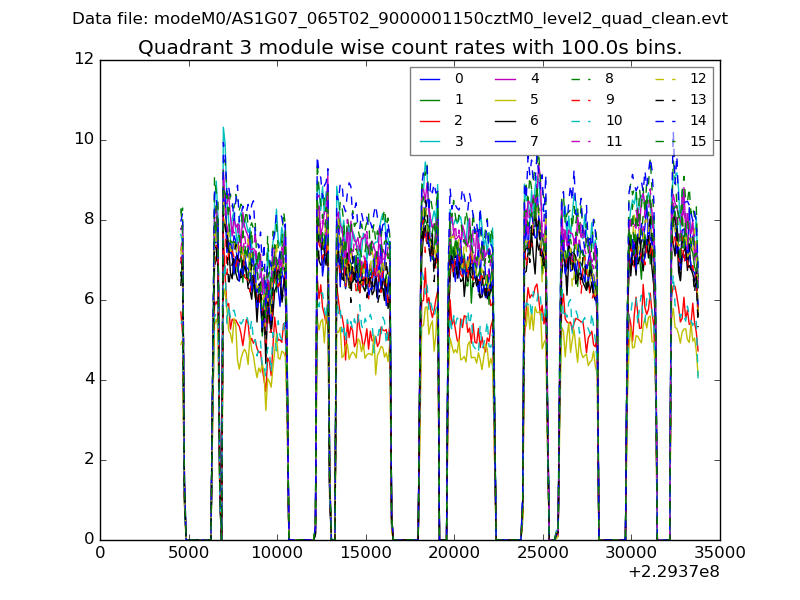
| Module-wise count rates for Quadrant A Data is divided into 100 sec bins |
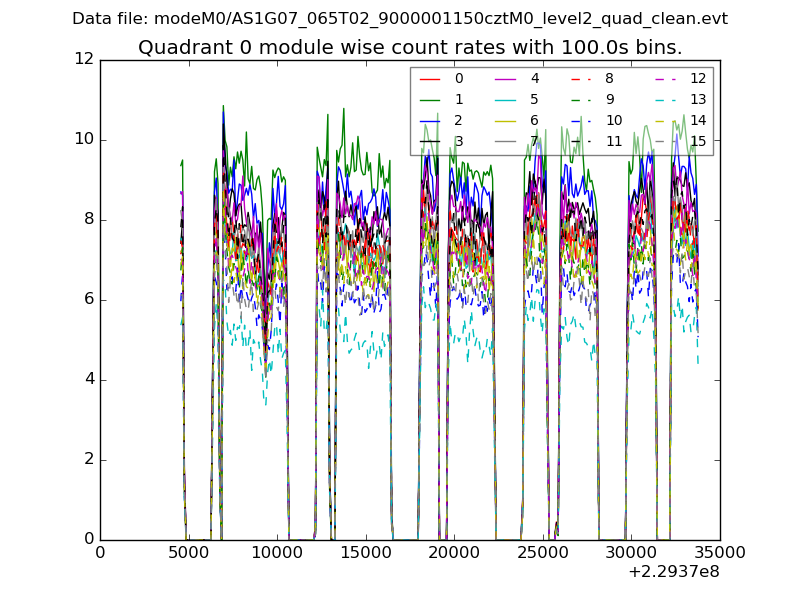 |
 |
| Module-wise count rates for Quadrant B Data is divided into 100 sec bins |
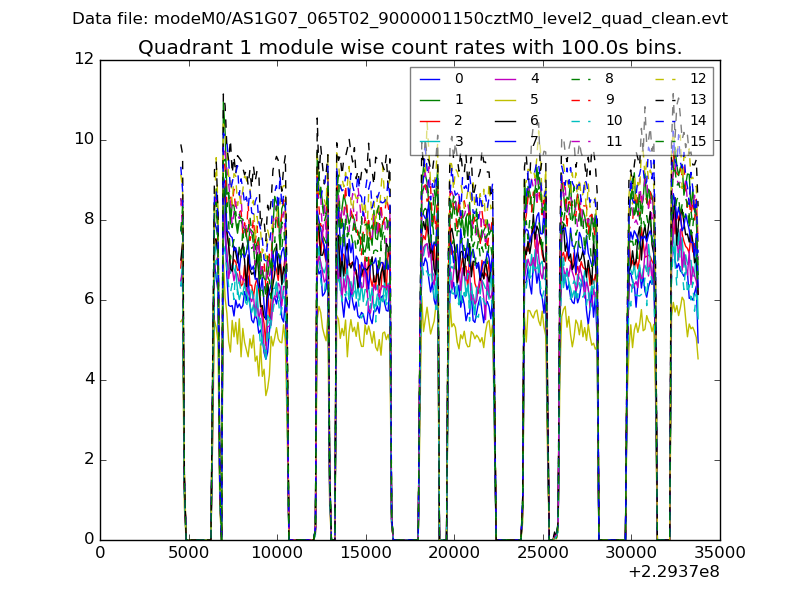 |
 |
| Module-wise count rates for Quadrant C Data is divided into 100 sec bins |
 |
 |
| Module-wise count rates for Quadrant D Data is divided into 100 sec bins |
 |
 |
| Parameter | Plot |
|---|---|
| CZT HV Monitor | 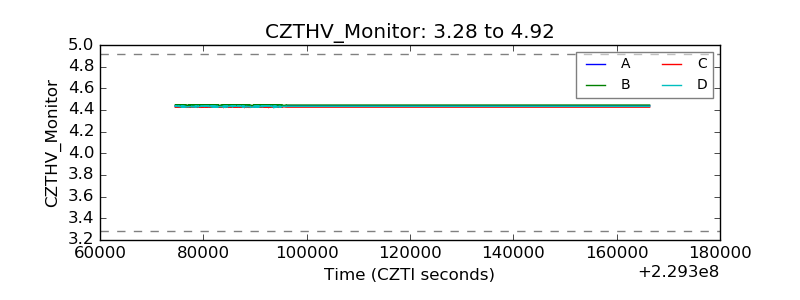 |
| D_VDD | 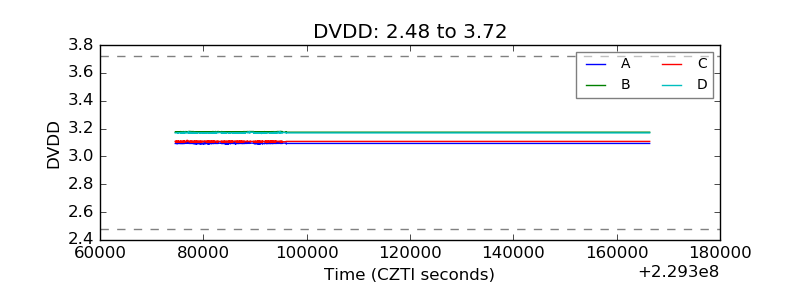 |
| Temperature 1 |  |
| Veto HV Monitor |  |
| Veto LLD |  |
| Alpha Counter | 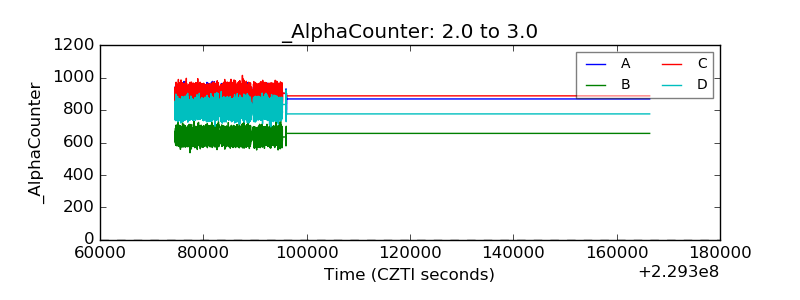 |
| _CPM_Rate | 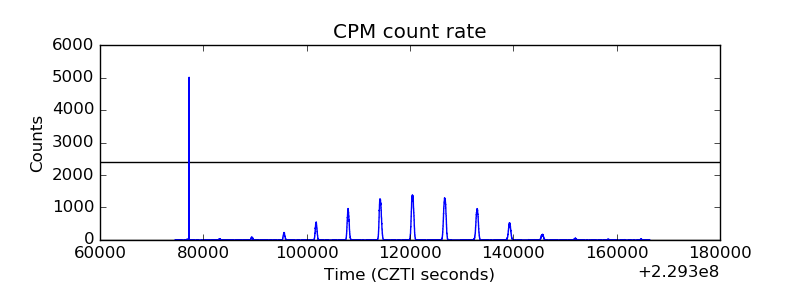 |
| CZT Counter |  |
| +2.5 Volts monitor | 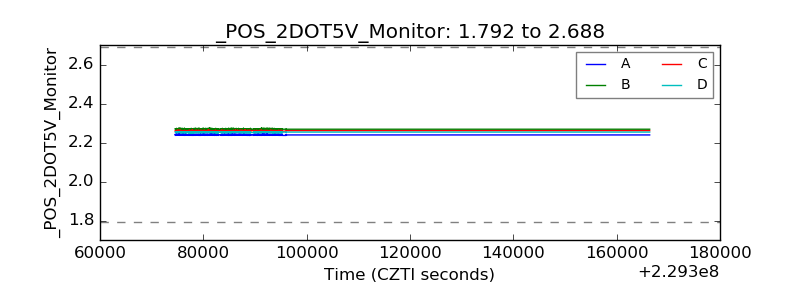 |
| +5 Volts monitor | 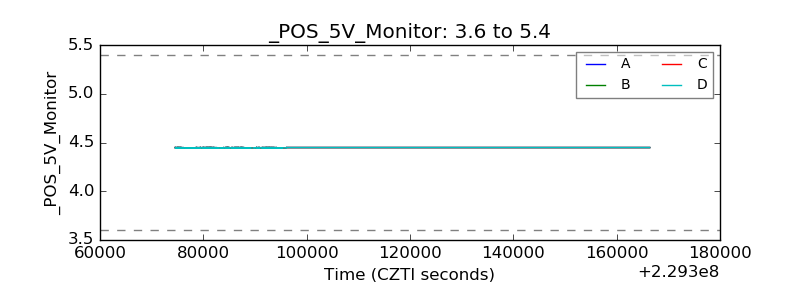 |
| _ROLL_ROT |  |
| _Roll_DEC | 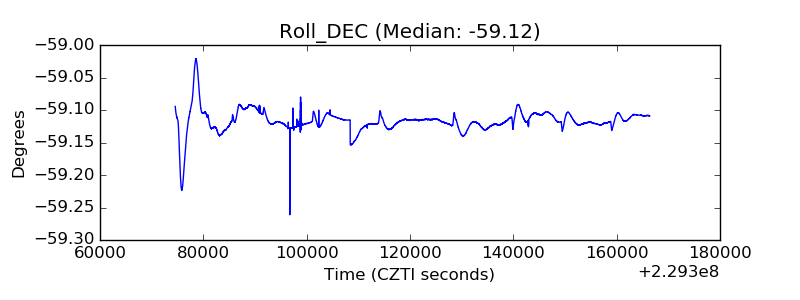 |
| _Roll_RA |  |
| Veto Counter | 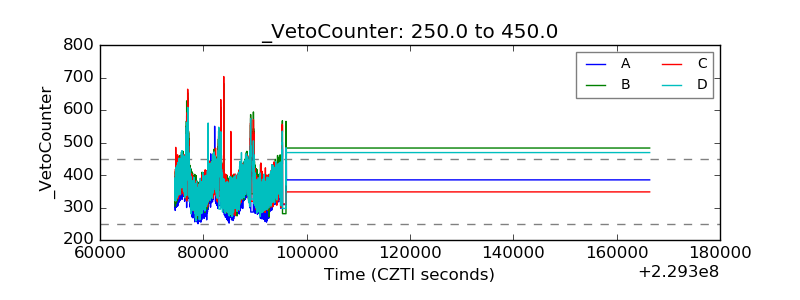 |