| Param | Original file | Final file |
|---|---|---|
| Filename | modeM0/AS1G07_065T02_9000001150_08269cztM0_level2.evt | modeM0/AS1G07_065T02_9000001150_08269cztM0_level2_quad_clean.evt |
| Size (bytes) | 263,459,520 | 45,040,320 |
| Size | 251.3 MB | 43.0 MB |
| Events in quadrant A | 1,833,375 | 272,243 |
| Events in quadrant B | 2,011,455 | 276,835 |
| Events in quadrant C | 1,789,657 | 275,083 |
| Events in quadrant D | 2,077,647 | 263,762 |
| Mode M9 | |||
|---|---|---|---|
| Quadrant | BADHDUFLAG | Total packets | Discarded packets |
| A | 0 | 2 | 0 |
| B | 0 | 2 | 0 |
| C | 0 | 2 | 0 |
| D | 0 | 2 | 0 |
| Mode M0 | |||
|---|---|---|---|
| Quadrant | BADHDUFLAG | Total packets | Discarded packets |
| A | 0 | 8064 | 2 |
| B | 0 | 8488 | 1 |
| C | 0 | 8014 | 1 |
| D | 0 | 8820 | 1 |
| Mode SS | |||
|---|---|---|---|
| Quadrant | BADHDUFLAG | Total packets | Discarded packets |
| A | 0 | 80 | 0 |
| B | 0 | 80 | 0 |
| C | 0 | 80 | 0 |
| D | 0 | 80 | 0 |
| Quadrant | Total seconds | Saturated seconds | Saturation percentage |
|---|---|---|---|
| A | 3901 | 21 | 0.538324% |
| B | 3901 | 58 | 1.486798% |
| C | 3901 | 7 | 0.179441% |
| D | 3901 | 46 | 1.179185% |
Noise dominated data is calculated using 1-second bins in cleaned event files. If a bin has >2000 counts, and if more than 50% of those come from <1% of pixels, then it is considered to be noise-dominated and hence unusable.
| Quadrant | # 1 sec bins | Bins with >0 counts | Bins with >2000 counts | High rate bins dominated by noise | Noise dominated (total time) | Noise dominated (detector-on time) | Marked lightcurve |
|---|---|---|---|---|---|---|---|
| A | 4101 | 3903 | 0 | 0 | 0.00% | 0.00% | 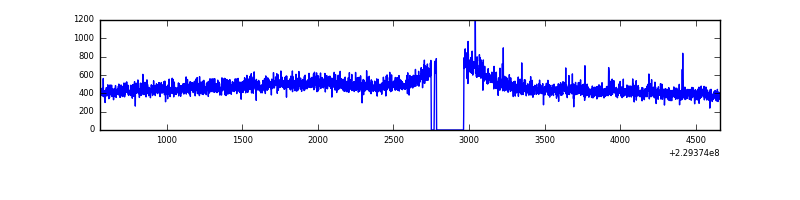 |
| B | 4101 | 3903 | 3 | 3 | 0.07% | 0.08% | 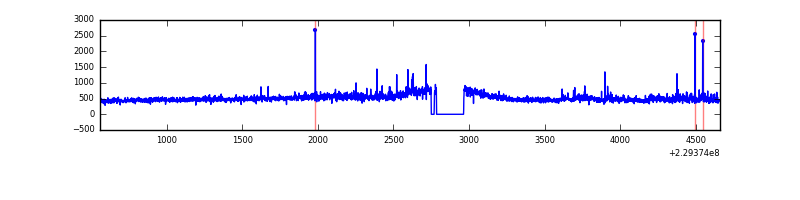 |
| C | 4101 | 3903 | 0 | 0 | 0.00% | 0.00% | 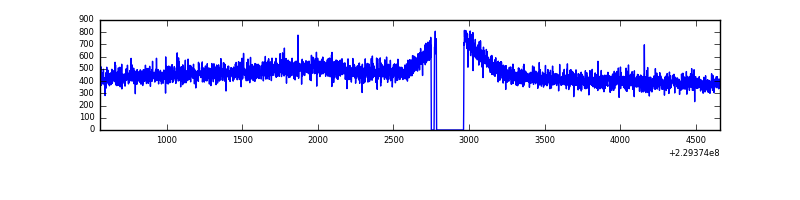 |
| D | 4101 | 3903 | 22 | 22 | 0.54% | 0.56% | 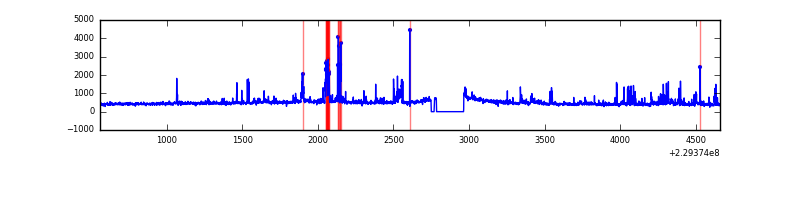 |
Top three noisy pixels from each quadrant. If the there are fewer than three noisy pixels in the level2.evt file, extra rows are filled as -1
| Pixel properties | Quadrant properties | ||||||
|---|---|---|---|---|---|---|---|
| Quadrant | DetID | PixID | Counts | Sigma | Mean | Median | Sigma |
| A | 0 | 254 | 5957 | 55.74 | 474 | 464 | 98.5 |
| A | 15 | 234 | 5132 | 47.37 | 474 | 464 | 98.5 |
| A | 0 | 226 | 4582 | 41.79 | 474 | 464 | 98.5 |
| B | 0 | 214 | 58312 | 627.37 | 476 | 463 | 92.2 |
| B | 11 | 51 | 48415 | 520.03 | 476 | 463 | 92.2 |
| B | 0 | 219 | 44423 | 476.74 | 476 | 463 | 92.2 |
| C | 13 | 61 | 3452 | 27.83 | 458 | 457 | 107.6 |
| C | 3 | 202 | 1157 | 6.5 | 458 | 457 | 107.6 |
| C | 12 | 4 | 1043 | 5.44 | 458 | 457 | 107.6 |
| D | 1 | 52 | 174038 | 1499.7 | 456 | 441 | 115.8 |
| D | 12 | 233 | 62469 | 535.86 | 456 | 441 | 115.8 |
| D | 7 | 71 | 32825 | 279.77 | 456 | 441 | 115.8 |
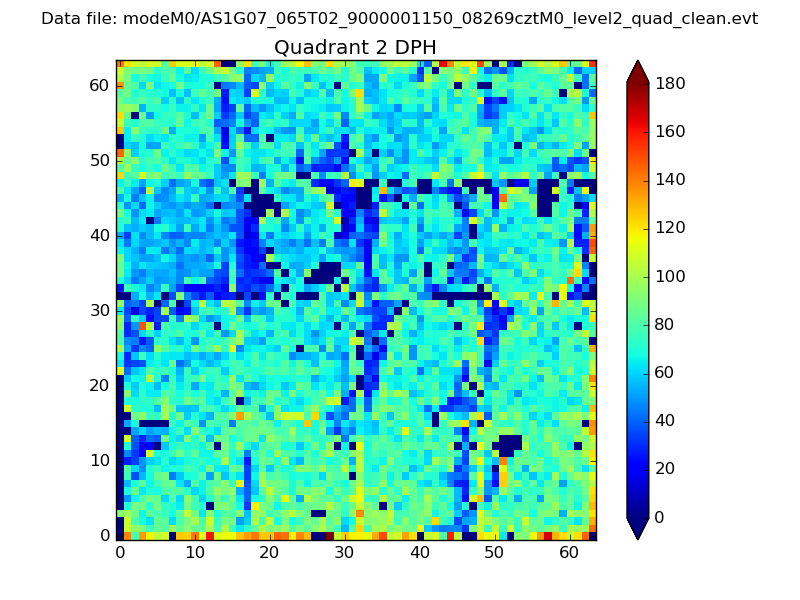
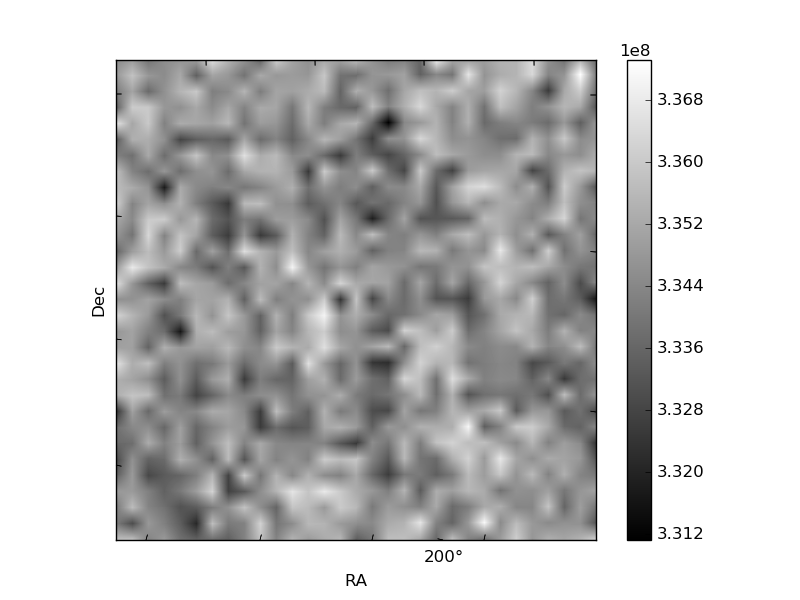
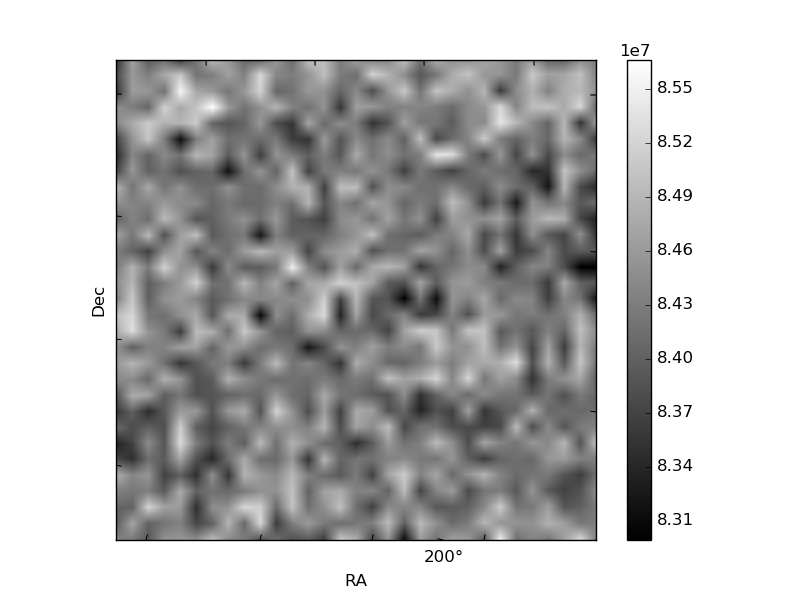
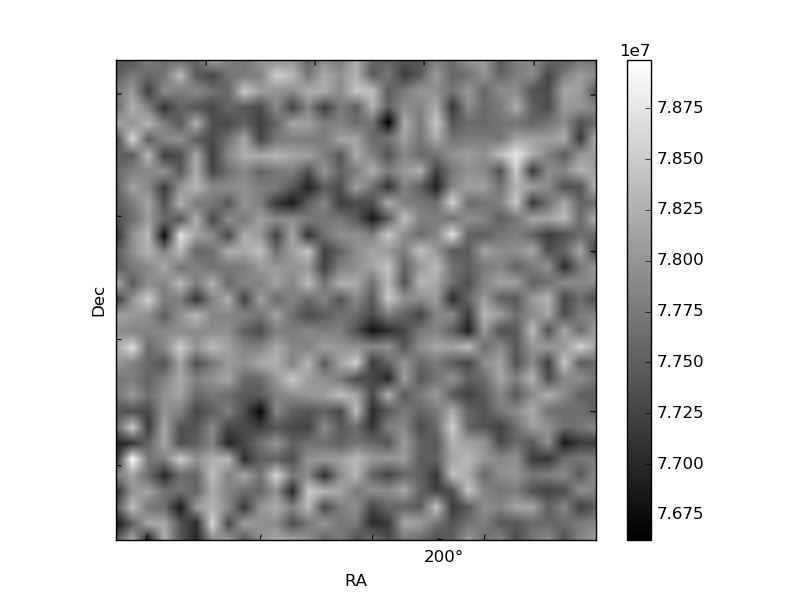
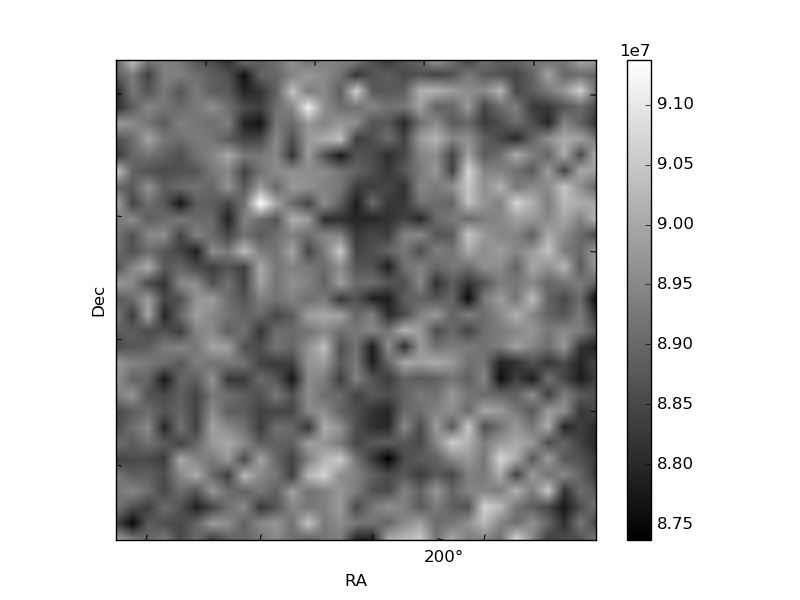
Histogram calculated using DETX and DETY for each event in the final _common_clean file
| Quadrant A | 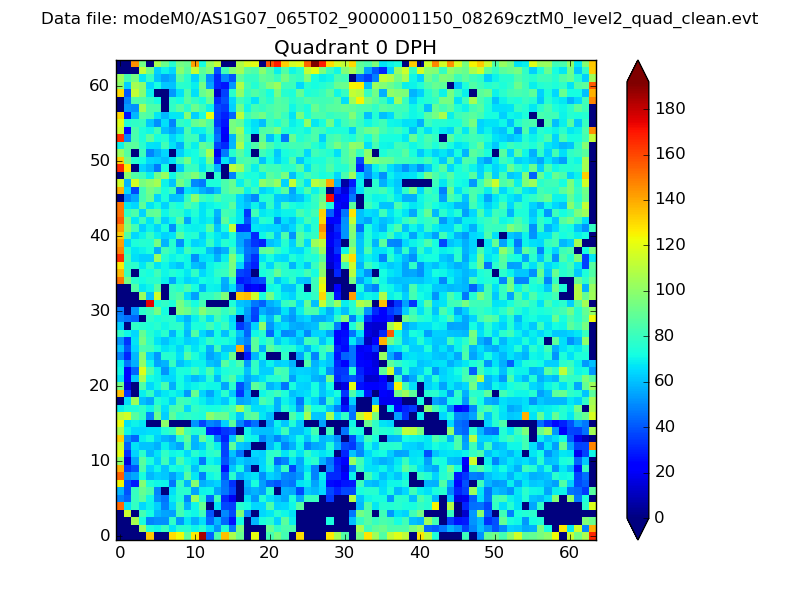 |
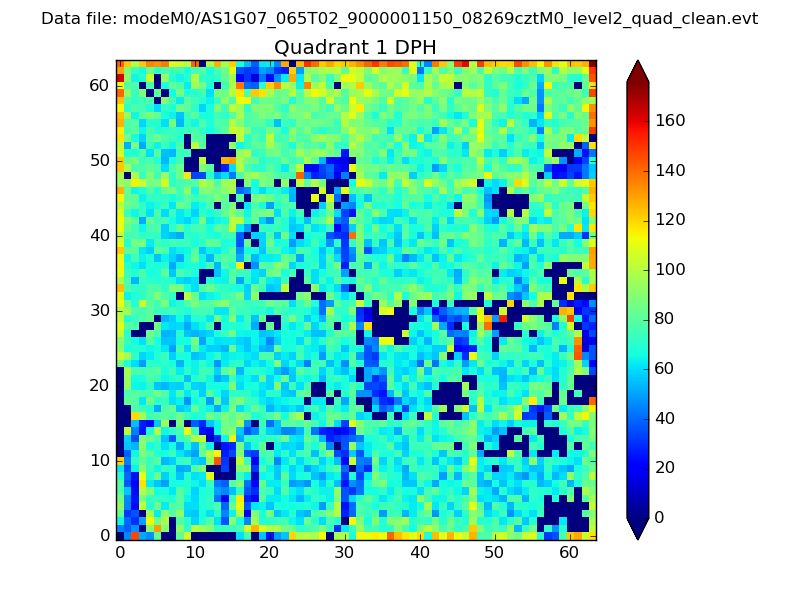 |
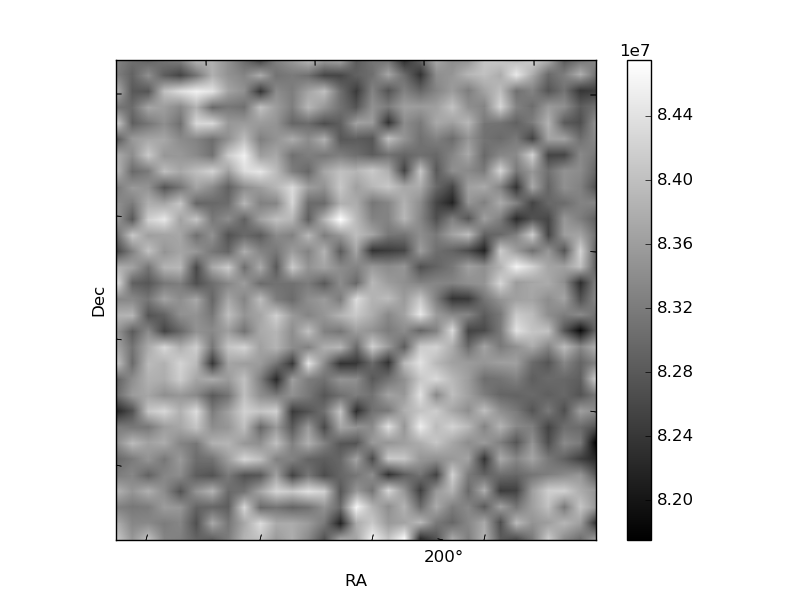
Quadrant B |
|---|---|---|---|
| Quadrant D | 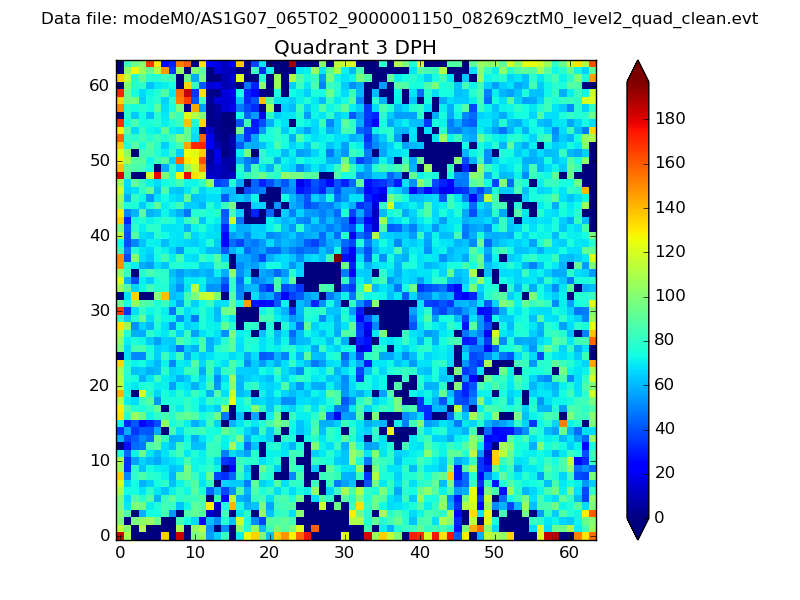 |
 |
Quadrant C |
| Plot type | Count rate plots | Images |
|---|---|---|
| Comparison with Poisson distribution Blue bars denote a histogram of data divided into 1 sec bins. Red curve is a Poisson curve with rate = median count rate of data. |
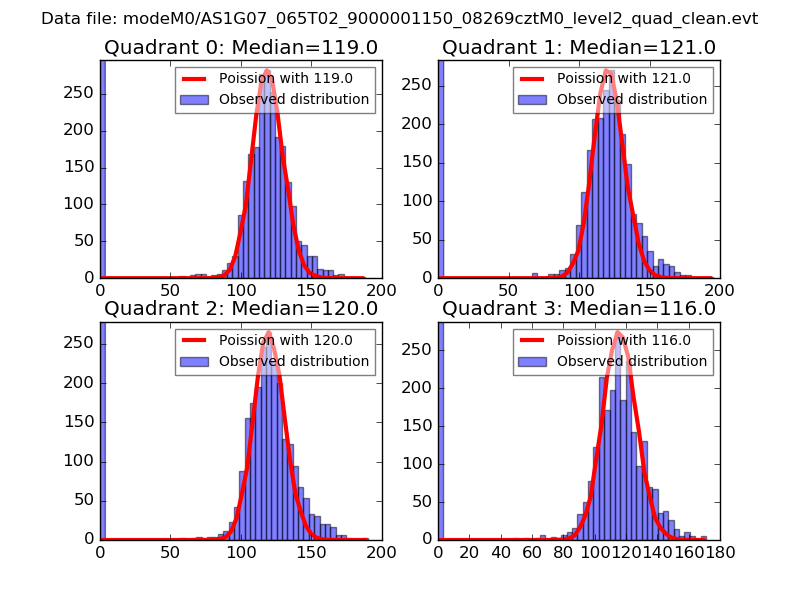 |
 |
| Quadrant-wise count rates Data is divided into 100 sec bins |
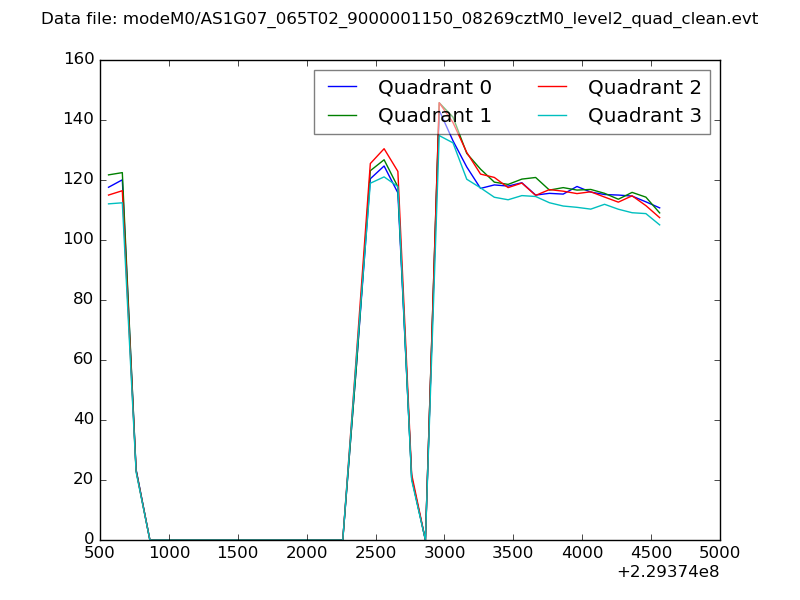 |
|
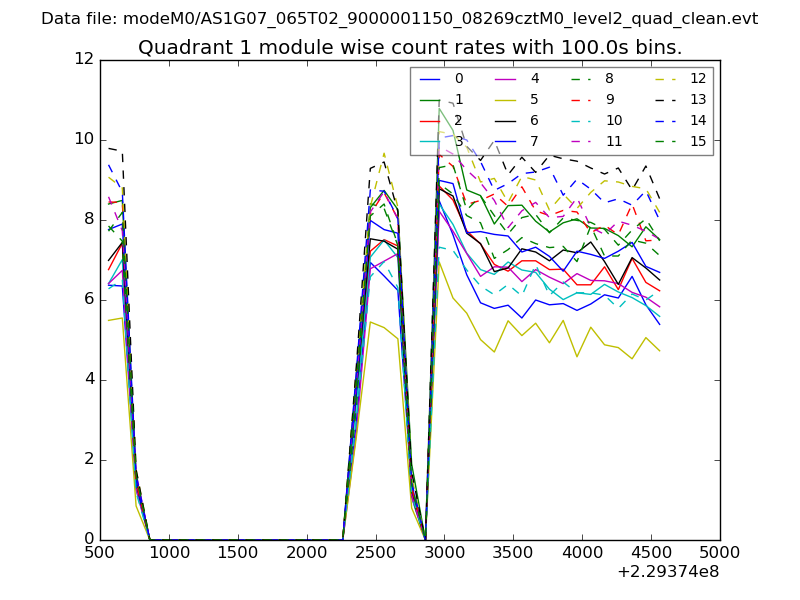
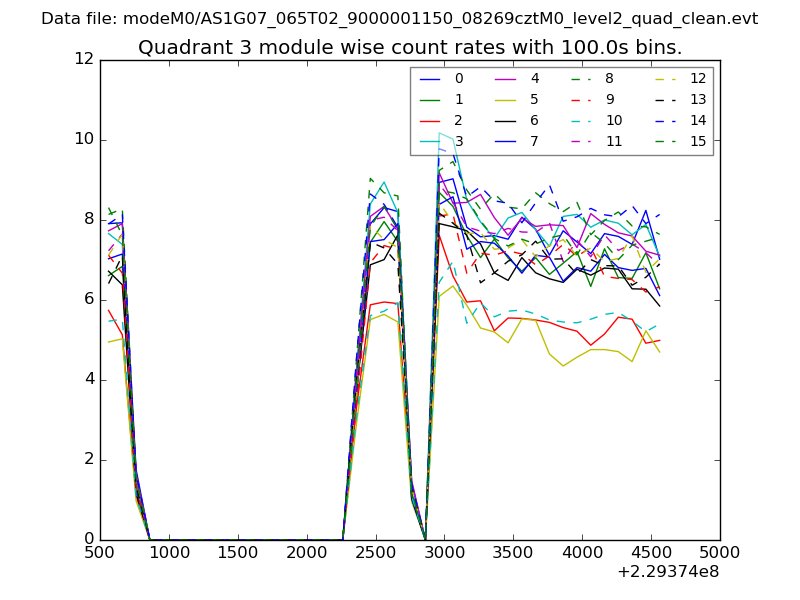
| Module-wise count rates for Quadrant A Data is divided into 100 sec bins |
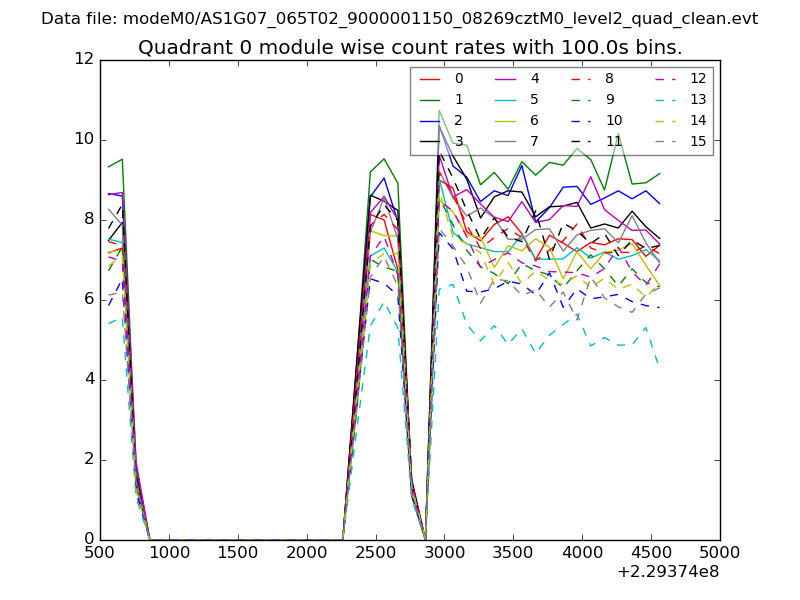 |
 |
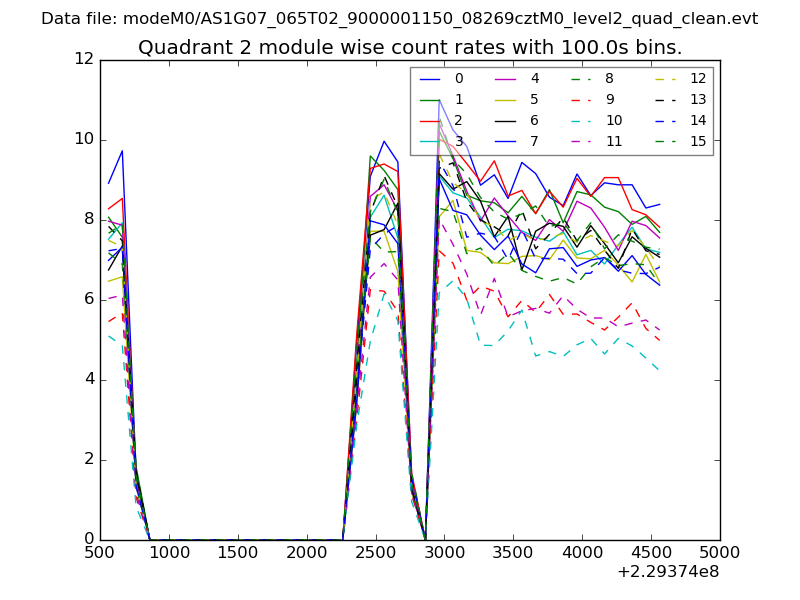
| Module-wise count rates for Quadrant B Data is divided into 100 sec bins |
 |
 |
| Module-wise count rates for Quadrant C Data is divided into 100 sec bins |
 |
 |
| Module-wise count rates for Quadrant D Data is divided into 100 sec bins |
 |
 |
| Parameter | Plot |
|---|---|
| CZT HV Monitor | 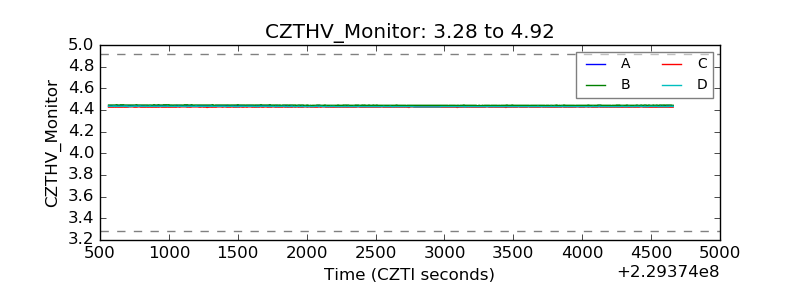 |
| D_VDD | 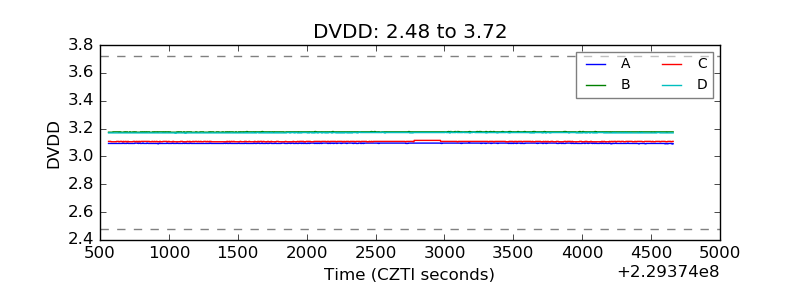 |
| Temperature 1 | 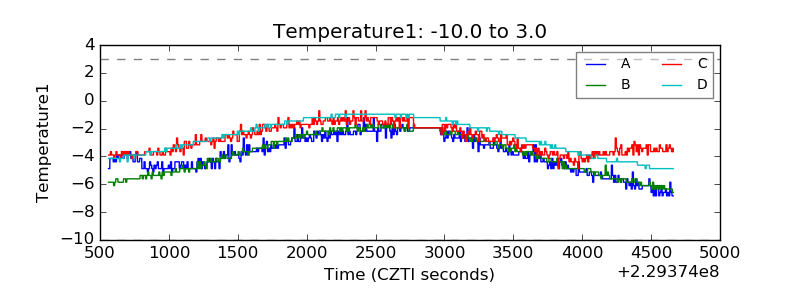 |
| Veto HV Monitor | 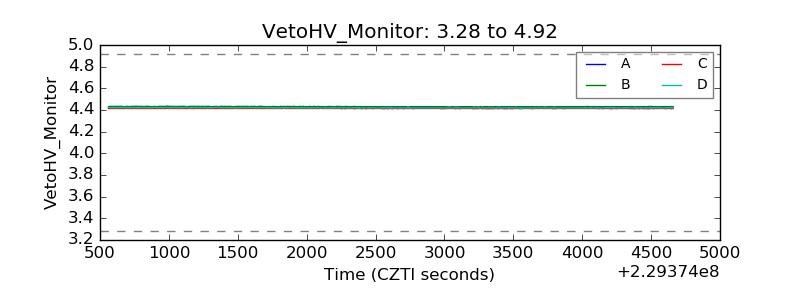 |
| Veto LLD | 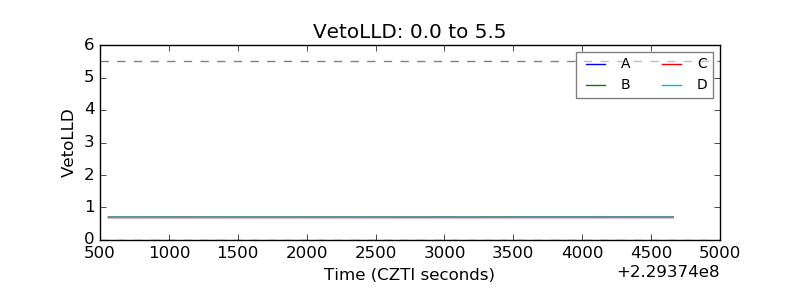 |
| Alpha Counter | 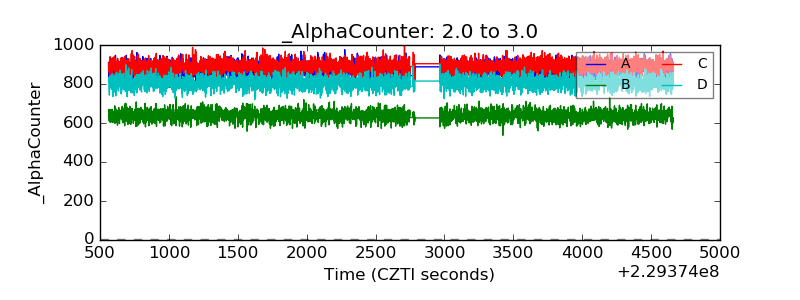 |
| _CPM_Rate | 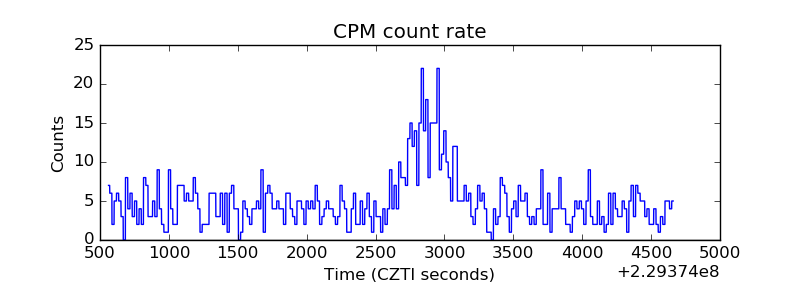 |
| CZT Counter | 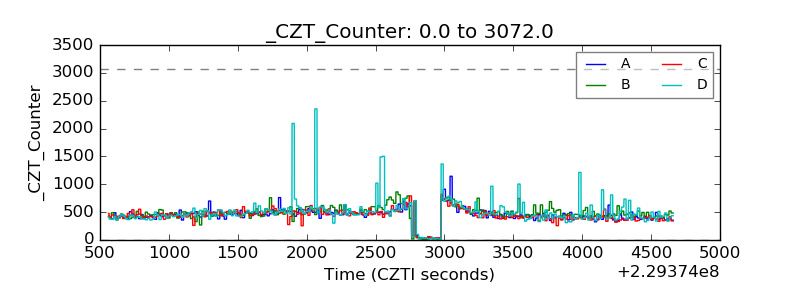 |
| +2.5 Volts monitor |  |
| +5 Volts monitor |  |
| _ROLL_ROT | 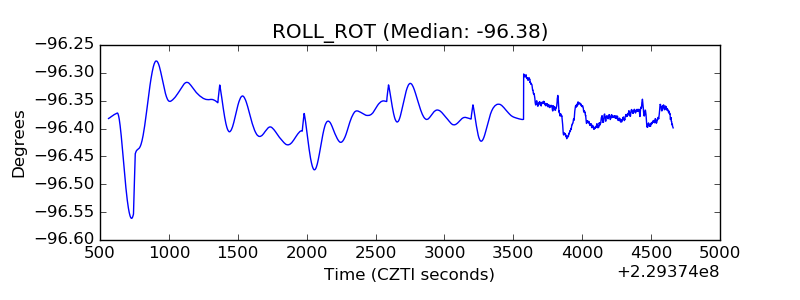 |
| _Roll_DEC | 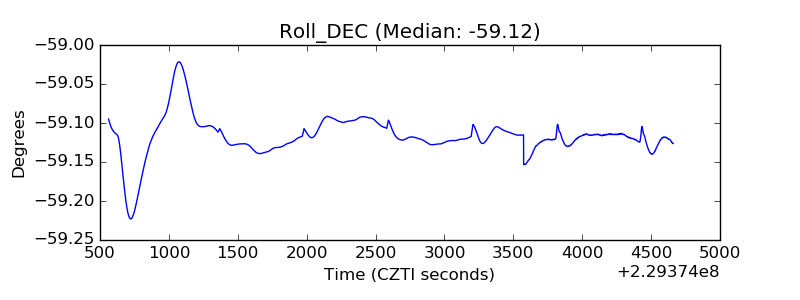 |
| _Roll_RA | 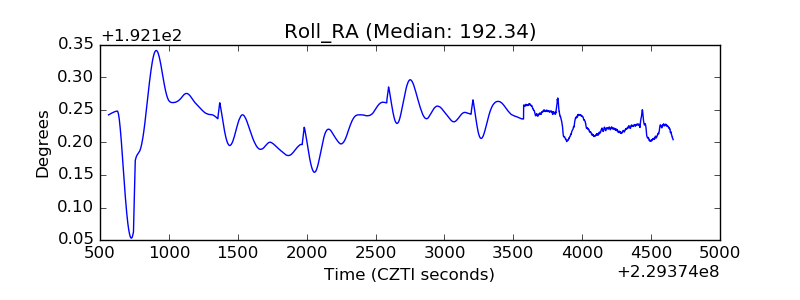 |
| Veto Counter | 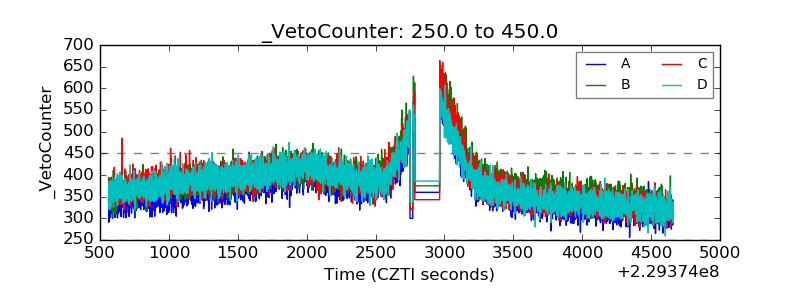 |