| Param | Original file | Final file |
|---|---|---|
| Filename | modeM0/AS1G07_065T02_9000001150_08273cztM0_level2.evt | modeM0/AS1G07_065T02_9000001150_08273cztM0_level2_quad_clean.evt |
| Size (bytes) | 1,526,760,000 | 323,933,760 |
| Size | 1.4 GB | 308.9 MB |
| Events in quadrant A | 10,471,307 | 2,073,708 |
| Events in quadrant B | 11,390,263 | 2,093,263 |
| Events in quadrant C | 10,551,333 | 2,037,286 |
| Events in quadrant D | 12,202,449 | 1,956,718 |
| Mode M9 | |||
|---|---|---|---|
| Quadrant | BADHDUFLAG | Total packets | Discarded packets |
| A | 0 | 24 | 0 |
| B | 0 | 24 | 0 |
| C | 0 | 24 | 0 |
| D | 0 | 24 | 0 |
| Mode M0 | |||
|---|---|---|---|
| Quadrant | BADHDUFLAG | Total packets | Discarded packets |
| A | 0 | 48399 | 5 |
| B | 0 | 50407 | 4 |
| C | 0 | 48844 | 4 |
| D | 0 | 53337 | 4 |
| Mode SS | |||
|---|---|---|---|
| Quadrant | BADHDUFLAG | Total packets | Discarded packets |
| A | 0 | 488 | 0 |
| B | 0 | 488 | 0 |
| C | 0 | 488 | 0 |
| D | 0 | 488 | 0 |
| Quadrant | Total seconds | Saturated seconds | Saturation percentage |
|---|---|---|---|
| A | 23993 | 46 | 0.191723% |
| B | 23993 | 115 | 0.479306% |
| C | 23993 | 90 | 0.375109% |
| D | 23993 | 180 | 0.750219% |
Noise dominated data is calculated using 1-second bins in cleaned event files. If a bin has >2000 counts, and if more than 50% of those come from <1% of pixels, then it is considered to be noise-dominated and hence unusable.
| Quadrant | # 1 sec bins | Bins with >0 counts | Bins with >2000 counts | High rate bins dominated by noise | Noise dominated (total time) | Noise dominated (detector-on time) | Marked lightcurve |
|---|---|---|---|---|---|---|---|
| A | 26453 | 23997 | 0 | 0 | 0.00% | 0.00% | 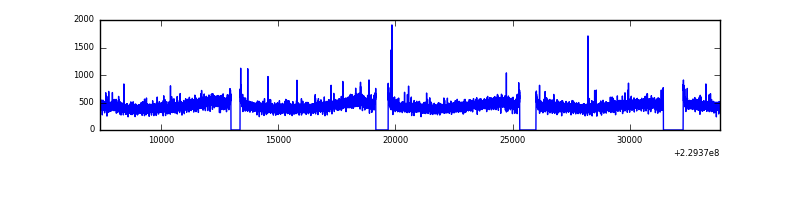 |
| B | 26453 | 23997 | 31 | 31 | 0.12% | 0.13% | 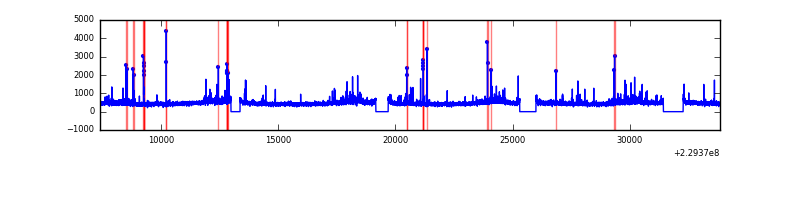 |
| C | 26453 | 23997 | 47 | 47 | 0.18% | 0.20% | 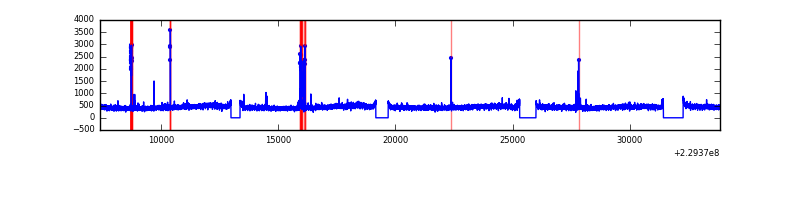 |
| D | 26453 | 23997 | 139 | 139 | 0.53% | 0.58% | 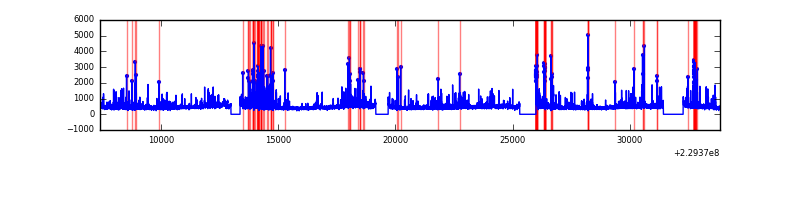 |
Top three noisy pixels from each quadrant. If the there are fewer than three noisy pixels in the level2.evt file, extra rows are filled as -1
| Pixel properties | Quadrant properties | ||||||
|---|---|---|---|---|---|---|---|
| Quadrant | DetID | PixID | Counts | Sigma | Mean | Median | Sigma |
| A | 0 | 254 | 30610 | 51.06 | 2711 | 2646 | 547.7 |
| A | 0 | 226 | 25279 | 41.32 | 2711 | 2646 | 547.7 |
| A | 12 | 194 | 24404 | 39.73 | 2711 | 2646 | 547.7 |
| B | 0 | 214 | 329057 | 632.99 | 2738 | 2664 | 515.6 |
| B | 11 | 51 | 127672 | 242.43 | 2738 | 2664 | 515.6 |
| B | 10 | 16 | 108125 | 204.53 | 2738 | 2664 | 515.6 |
| C | 9 | 54 | 231370 | 374.99 | 2645 | 2652 | 609.9 |
| C | 13 | 61 | 20257 | 28.86 | 2645 | 2652 | 609.9 |
| C | 3 | 202 | 6600 | 6.47 | 2645 | 2652 | 609.9 |
| D | 1 | 52 | 1153504 | 1677.41 | 2613 | 2552 | 686.1 |
| D | 13 | 105 | 309423 | 447.24 | 2613 | 2552 | 686.1 |
| D | 2 | 152 | 188225 | 270.6 | 2613 | 2552 | 686.1 |
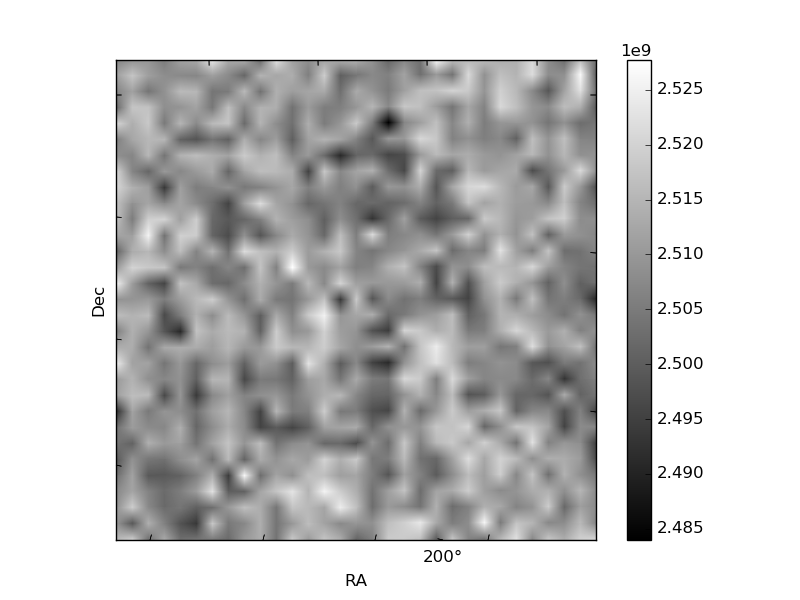
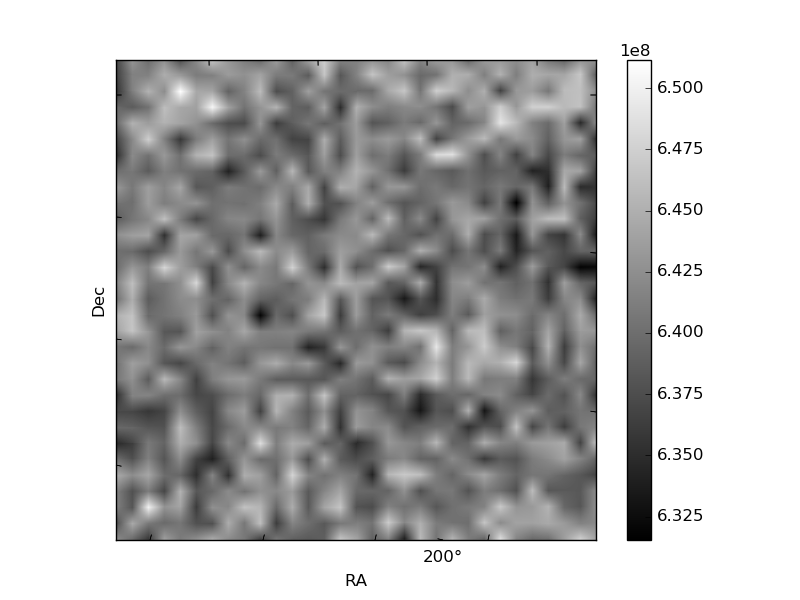
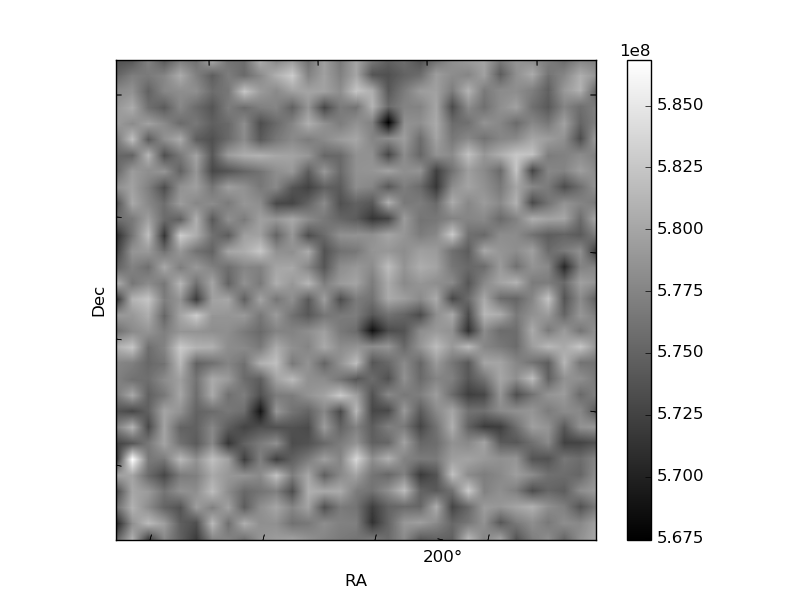
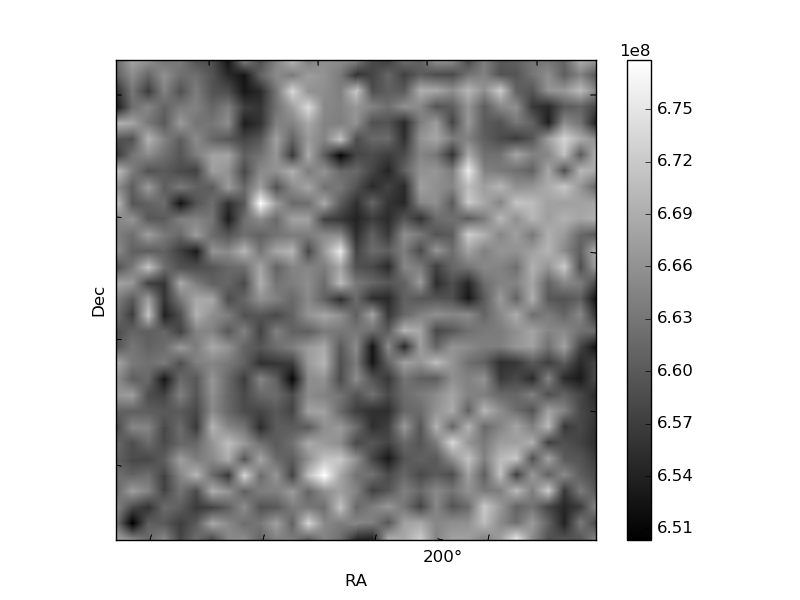
Histogram calculated using DETX and DETY for each event in the final _common_clean file
| Quadrant A | 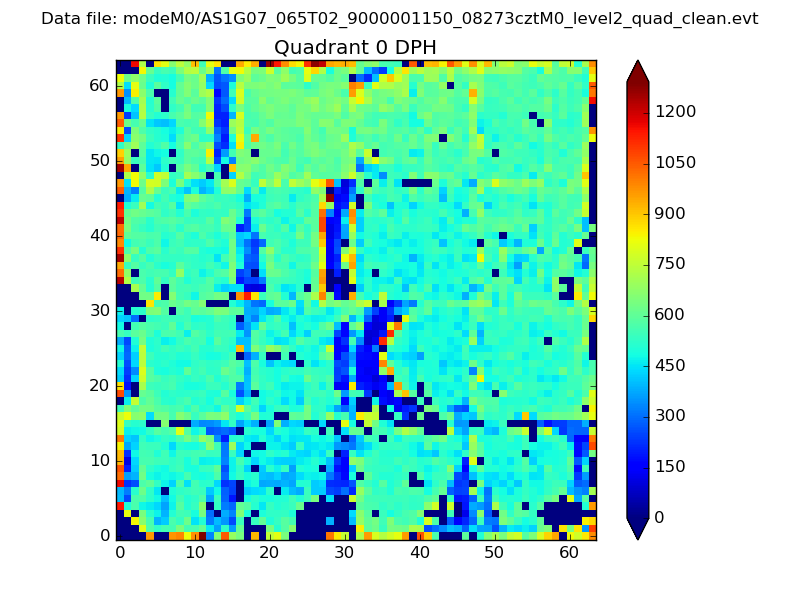 |
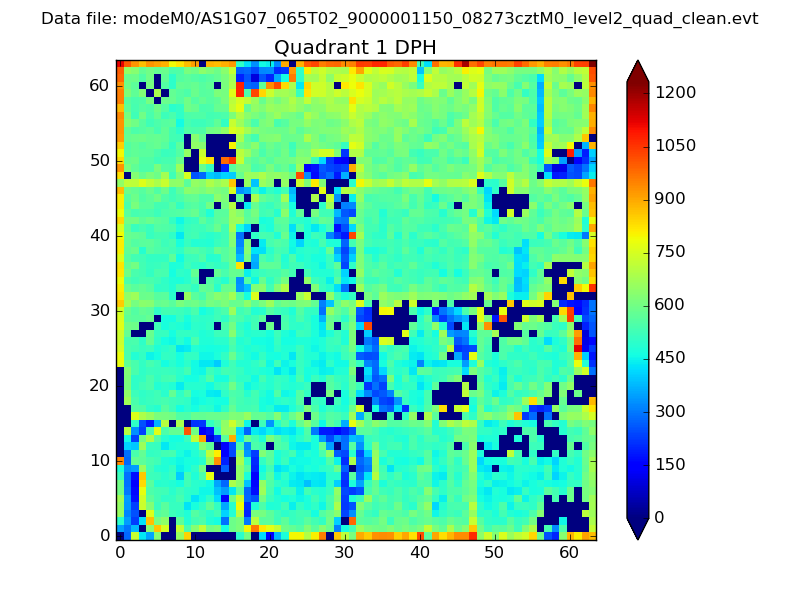 |
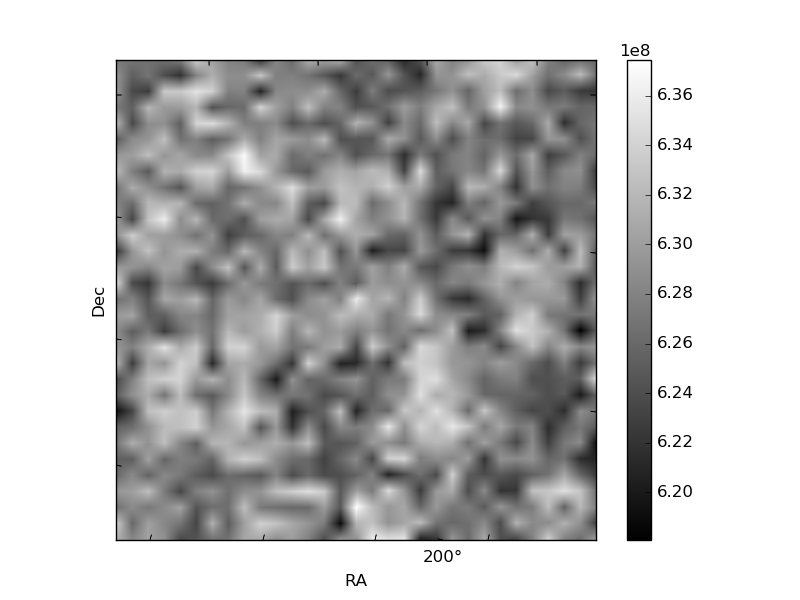
Quadrant B |
|---|---|---|---|
| Quadrant D | 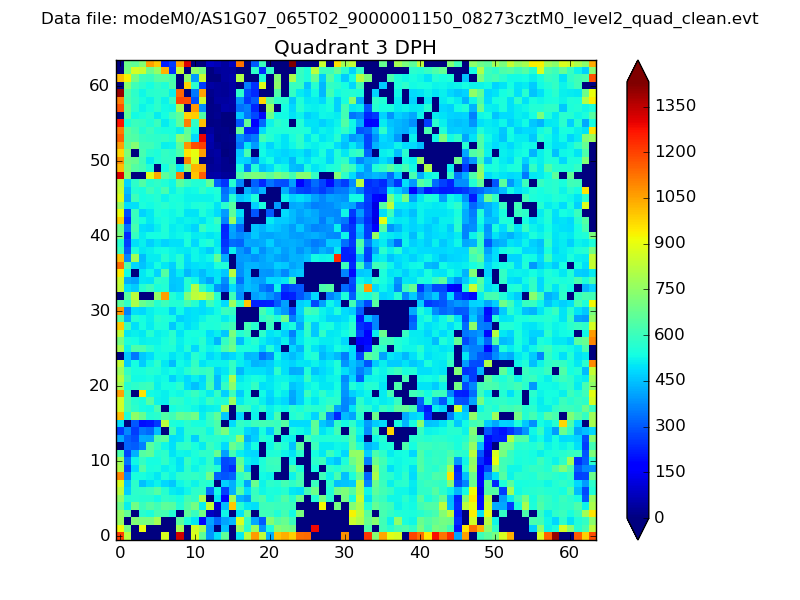 |
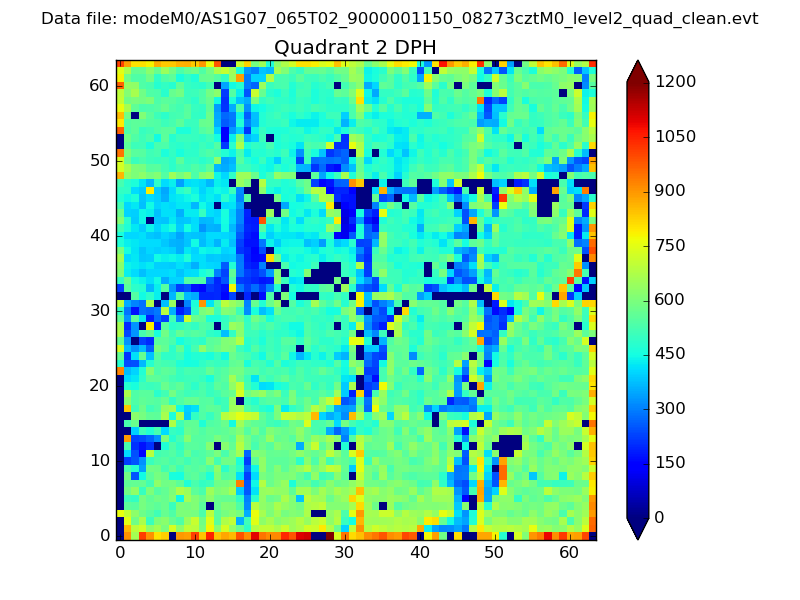 |
Quadrant C |
| Plot type | Count rate plots | Images |
|---|---|---|
| Comparison with Poisson distribution Blue bars denote a histogram of data divided into 1 sec bins. Red curve is a Poisson curve with rate = median count rate of data. |
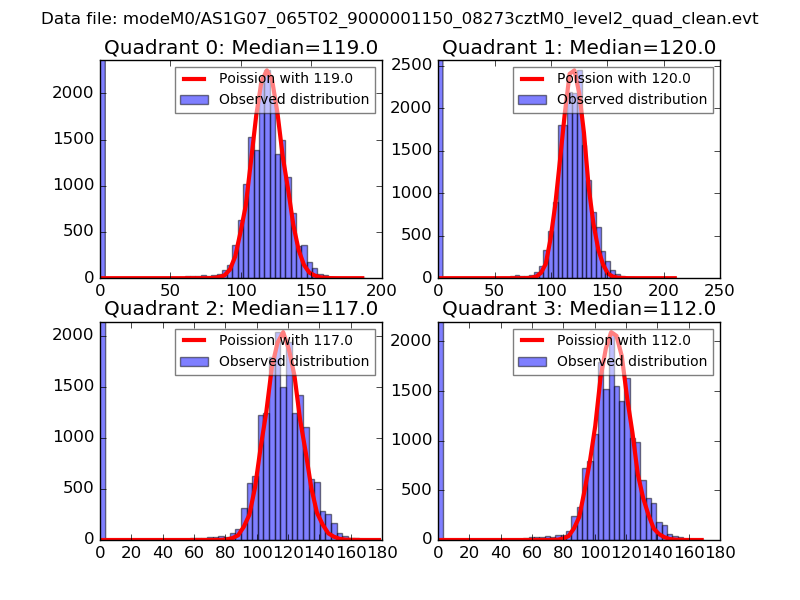 |
 |
| Quadrant-wise count rates Data is divided into 100 sec bins |
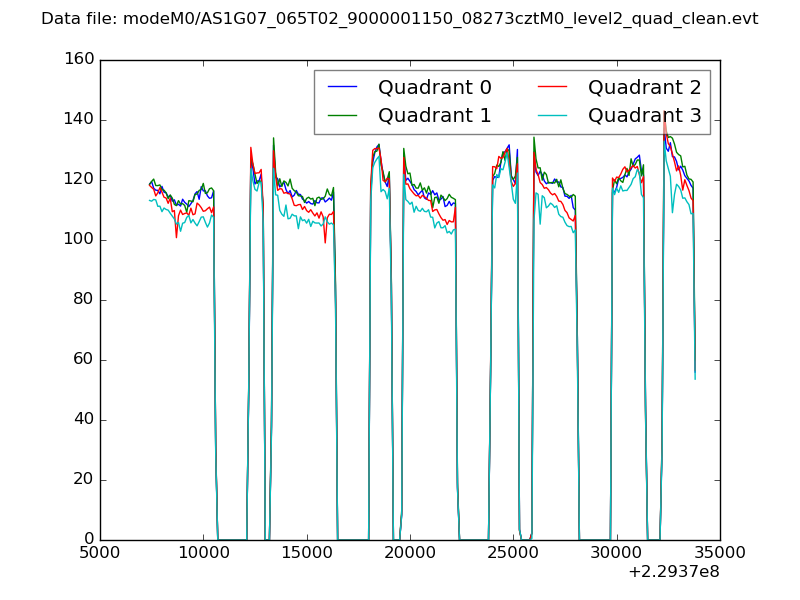 |
|
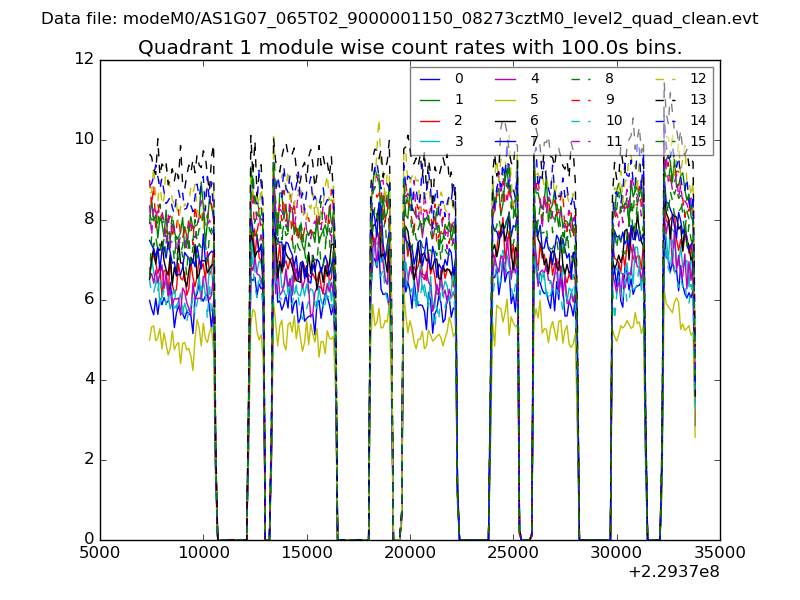
| Module-wise count rates for Quadrant A Data is divided into 100 sec bins |
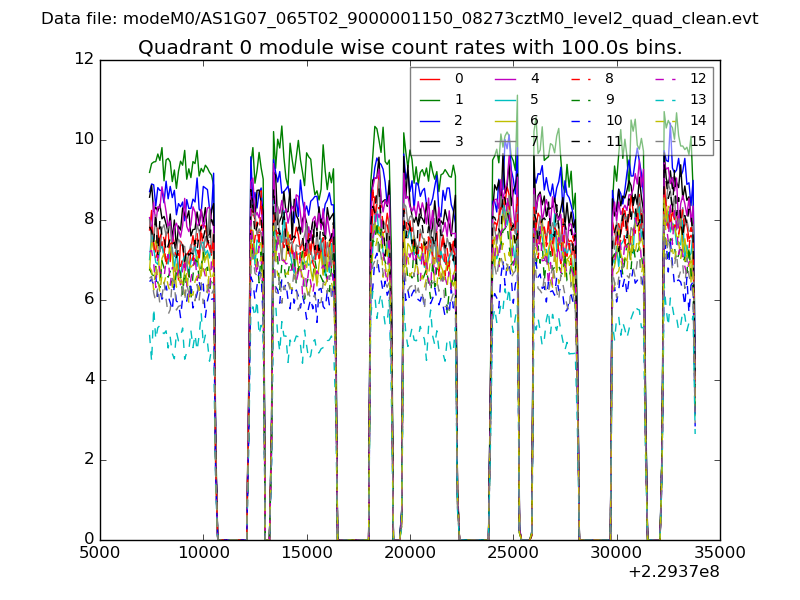 |
 |
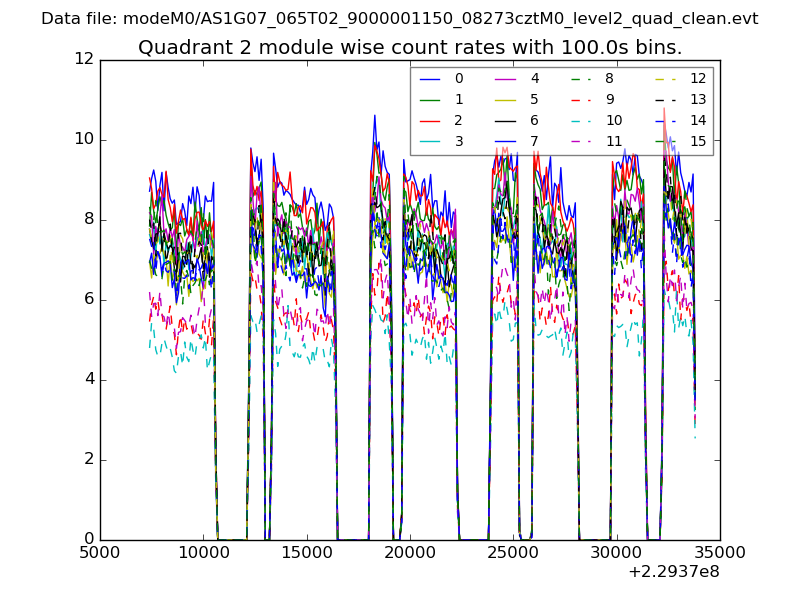
| Module-wise count rates for Quadrant B Data is divided into 100 sec bins |
 |
 |
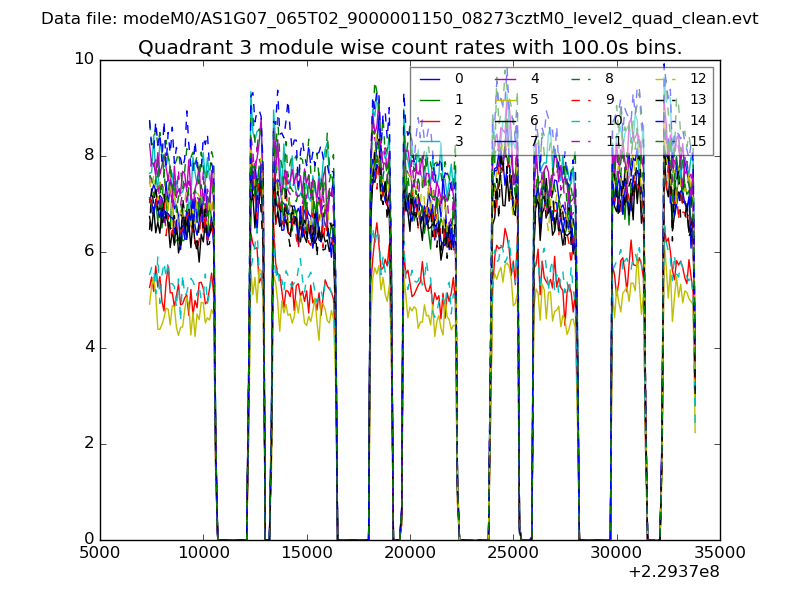
| Module-wise count rates for Quadrant C Data is divided into 100 sec bins |
 |
 |
| Module-wise count rates for Quadrant D Data is divided into 100 sec bins |
 |
 |
| Parameter | Plot |
|---|---|
| CZT HV Monitor |  |
| D_VDD | 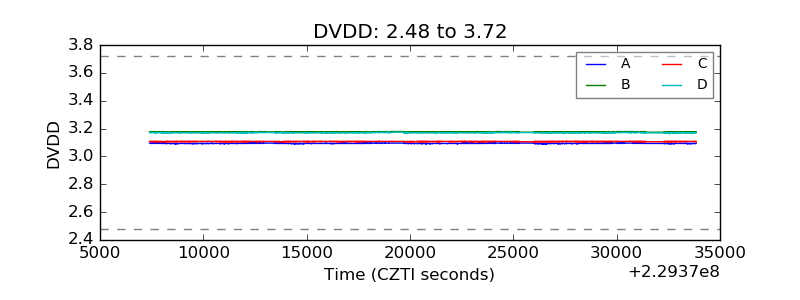 |
| Temperature 1 |  |
| Veto HV Monitor | 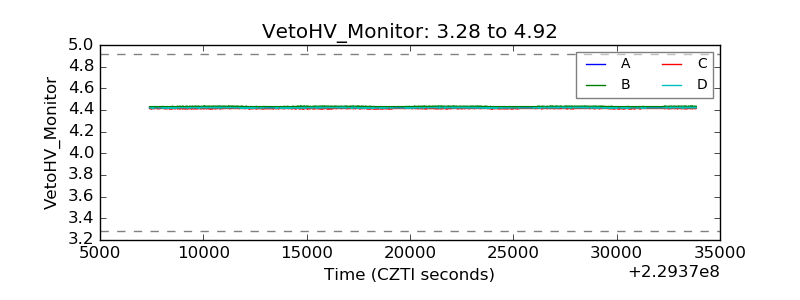 |
| Veto LLD | 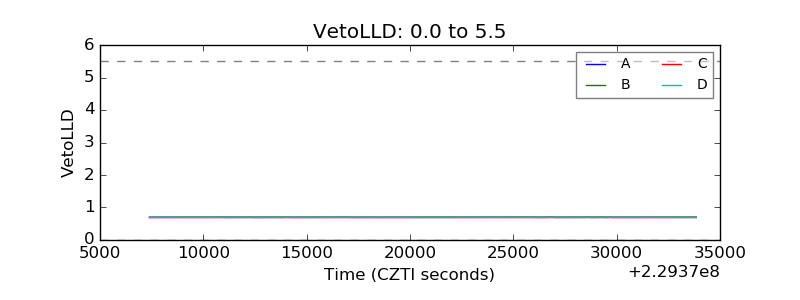 |
| Alpha Counter | 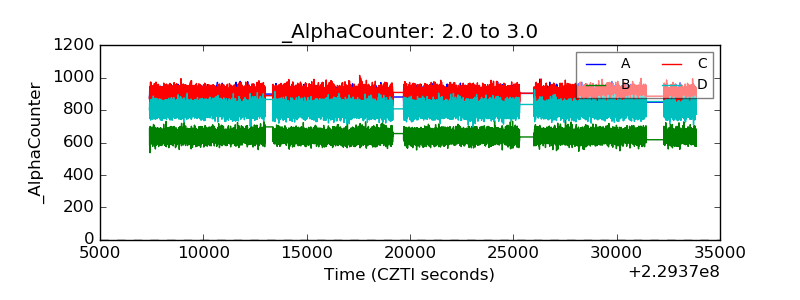 |
| _CPM_Rate | 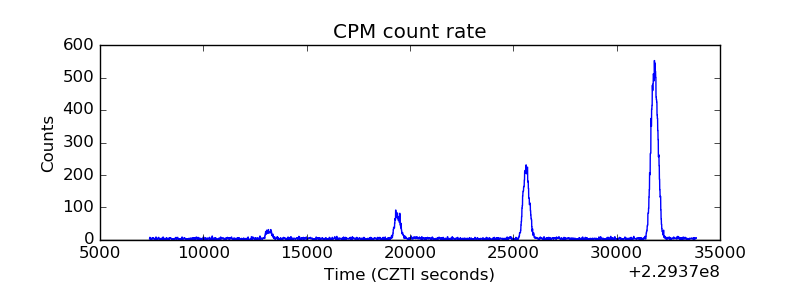 |
| CZT Counter | 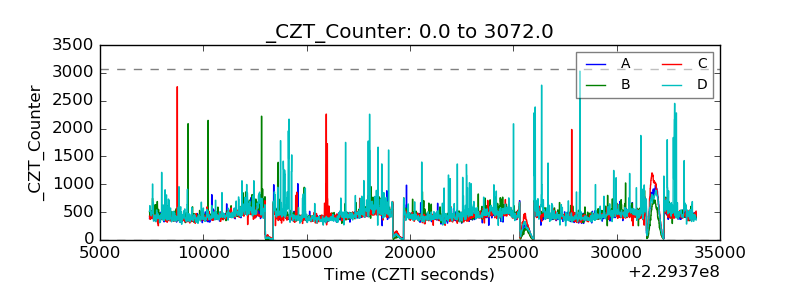 |
| +2.5 Volts monitor | 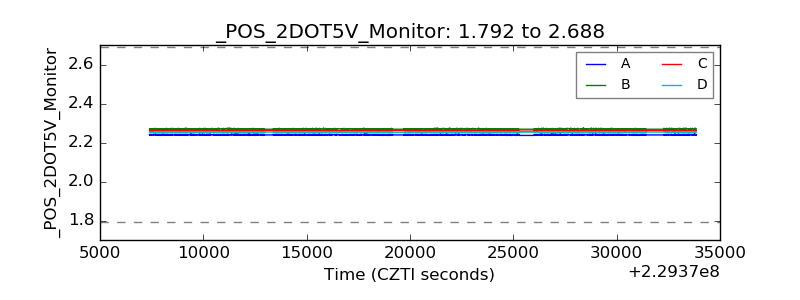 |
| +5 Volts monitor |  |
| _ROLL_ROT | 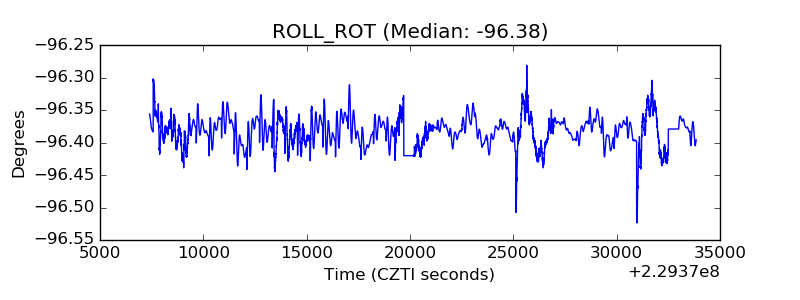 |
| _Roll_DEC | 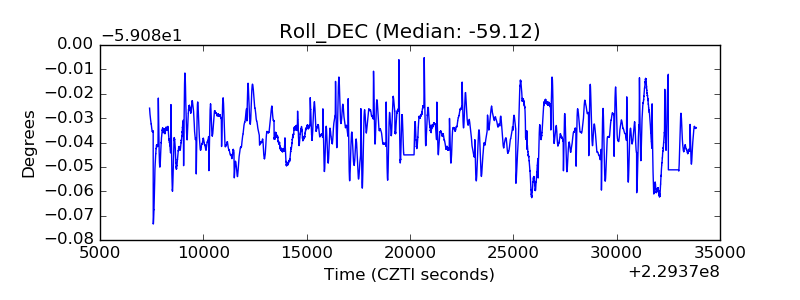 |
| _Roll_RA | 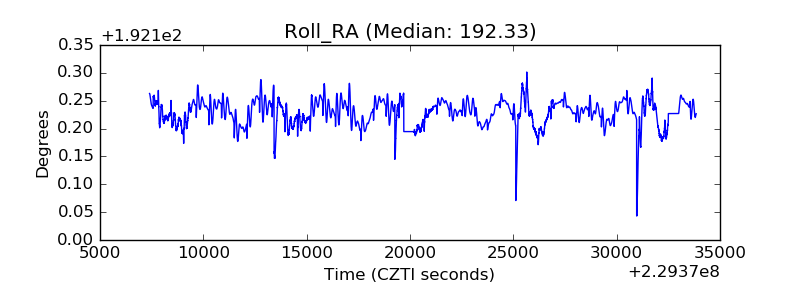 |
| Veto Counter | 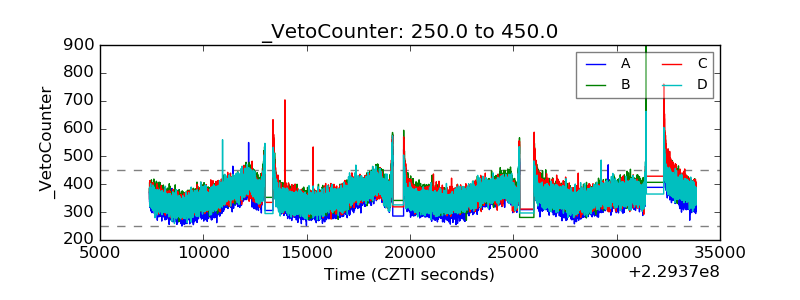 |