| Param | Original file | Final file |
|---|---|---|
| Filename | modeM0/AS1G07_065T02_9000001150_08274cztM0_level2.evt | modeM0/AS1G07_065T02_9000001150_08274cztM0_level2_quad_clean.evt |
| Size (bytes) | 456,088,320 | 97,539,840 |
| Size | 435.0 MB | 93.0 MB |
| Events in quadrant A | 3,066,936 | 626,183 |
| Events in quadrant B | 3,282,611 | 639,492 |
| Events in quadrant C | 3,018,671 | 627,551 |
| Events in quadrant D | 3,989,022 | 593,622 |
| Mode M9 | |||
|---|---|---|---|
| Quadrant | BADHDUFLAG | Total packets | Discarded packets |
| A | 0 | 15 | 0 |
| B | 0 | 15 | 0 |
| C | 0 | 15 | 0 |
| D | 0 | 16 | 0 |
| Mode M0 | |||
|---|---|---|---|
| Quadrant | BADHDUFLAG | Total packets | Discarded packets |
| A | 0 | 13742 | 9 |
| B | 0 | 14132 | 15 |
| C | 0 | 13639 | 10 |
| D | 0 | 16491 | 29 |
| Mode SS | |||
|---|---|---|---|
| Quadrant | BADHDUFLAG | Total packets | Discarded packets |
| A | 0 | 136 | 0 |
| B | 0 | 136 | 0 |
| C | 0 | 136 | 0 |
| D | 0 | 136 | 0 |
| Quadrant | Total seconds | Saturated seconds | Saturation percentage |
|---|---|---|---|
| A | 6704 | 66 | 0.984487% |
| B | 6701 | 57 | 0.850619% |
| C | 6703 | 40 | 0.596748% |
| D | 6698 | 153 | 2.284264% |
Noise dominated data is calculated using 1-second bins in cleaned event files. If a bin has >2000 counts, and if more than 50% of those come from <1% of pixels, then it is considered to be noise-dominated and hence unusable.
| Quadrant | # 1 sec bins | Bins with >0 counts | Bins with >2000 counts | High rate bins dominated by noise | Noise dominated (total time) | Noise dominated (detector-on time) | Marked lightcurve |
|---|---|---|---|---|---|---|---|
| A | 7682 | 6708 | 11 | 11 | 0.14% | 0.16% | 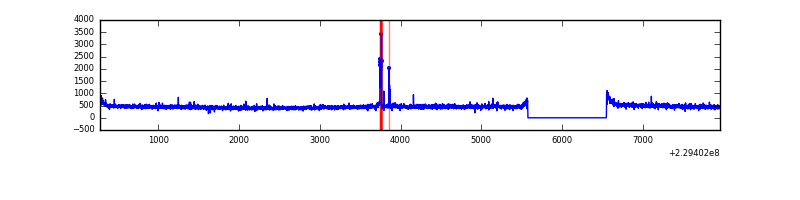 |
| B | 7682 | 6707 | 1 | 1 | 0.01% | 0.01% | 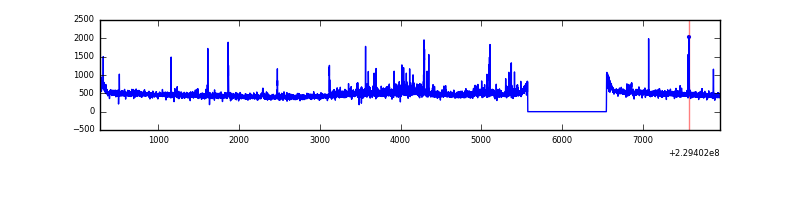 |
| C | 7682 | 6708 | 0 | 0 | 0.00% | 0.00% | 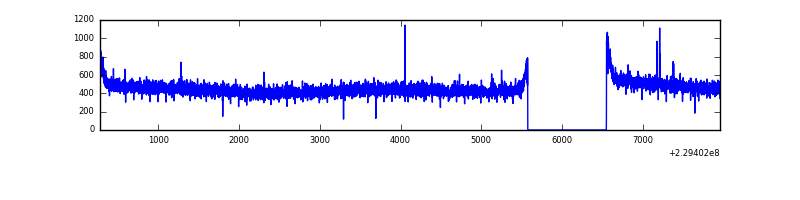 |
| D | 7682 | 6708 | 97 | 97 | 1.26% | 1.45% | 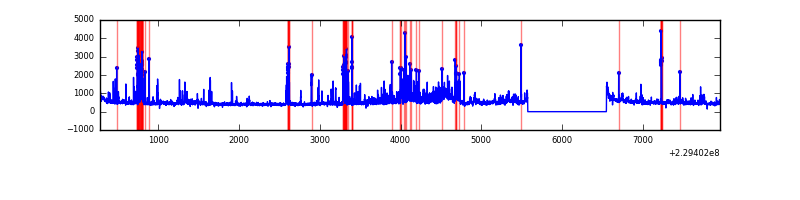 |
Top three noisy pixels from each quadrant. If the there are fewer than three noisy pixels in the level2.evt file, extra rows are filled as -1
| Pixel properties | Quadrant properties | ||||||
|---|---|---|---|---|---|---|---|
| Quadrant | DetID | PixID | Counts | Sigma | Mean | Median | Sigma |
| A | 15 | 234 | 49274 | 303.26 | 782 | 764 | 160.0 |
| A | 13 | 248 | 8885 | 50.77 | 782 | 764 | 160.0 |
| A | 0 | 226 | 7375 | 41.33 | 782 | 764 | 160.0 |
| B | 0 | 214 | 95404 | 631.62 | 791 | 772 | 149.8 |
| B | 11 | 51 | 52351 | 344.26 | 791 | 772 | 149.8 |
| B | 10 | 16 | 21632 | 139.23 | 791 | 772 | 149.8 |
| C | 9 | 54 | 7997 | 40.35 | 772 | 774 | 179.0 |
| C | 13 | 61 | 5889 | 28.57 | 772 | 774 | 179.0 |
| C | 3 | 202 | 1939 | 6.51 | 772 | 774 | 179.0 |
| D | 1 | 52 | 468549 | 2347.98 | 753 | 735 | 199.2 |
| D | 13 | 105 | 365819 | 1832.38 | 753 | 735 | 199.2 |
| D | 8 | 230 | 148731 | 742.8 | 753 | 735 | 199.2 |
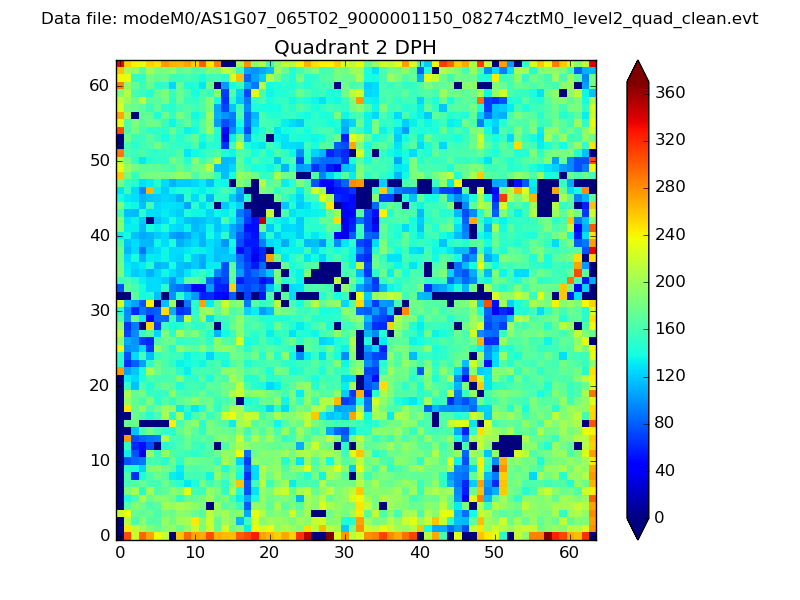
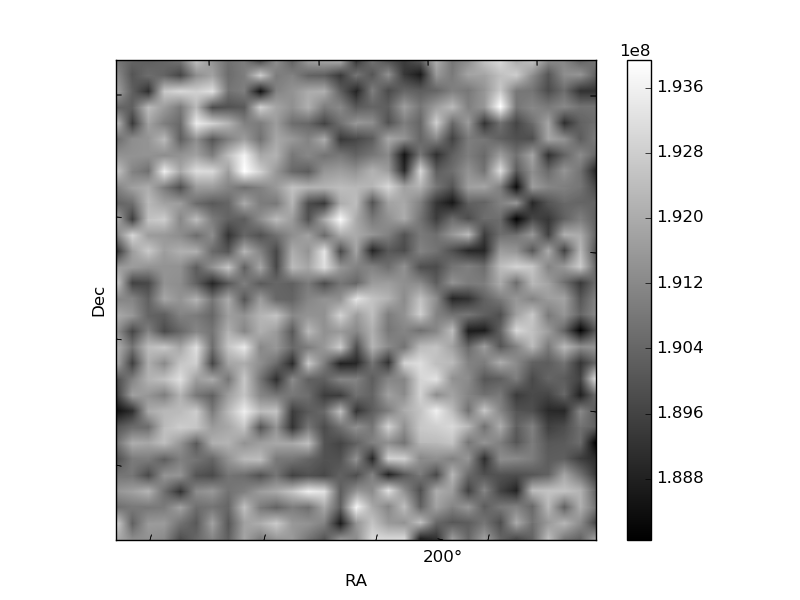
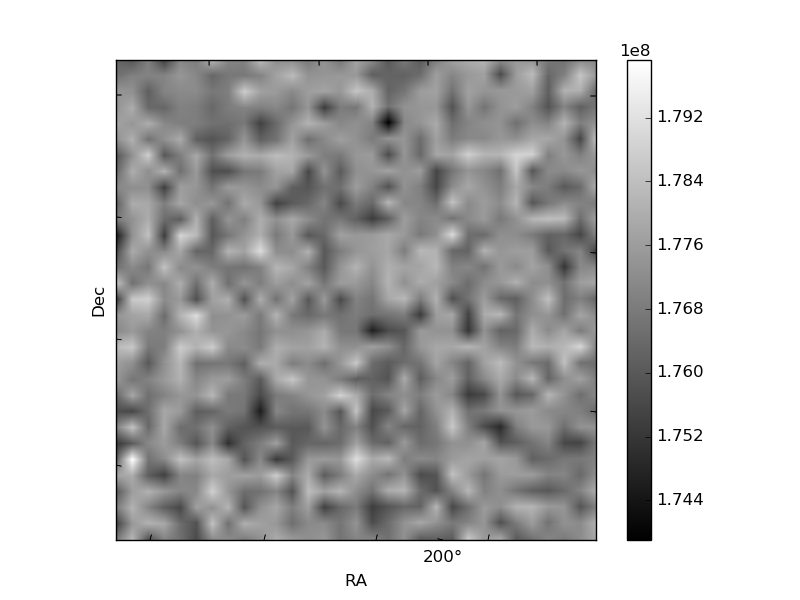
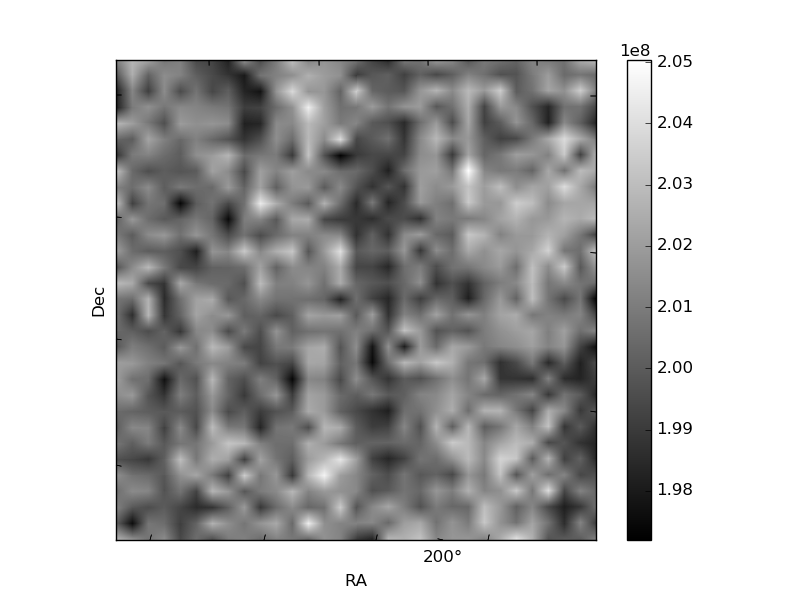
Histogram calculated using DETX and DETY for each event in the final _common_clean file
| Quadrant A | 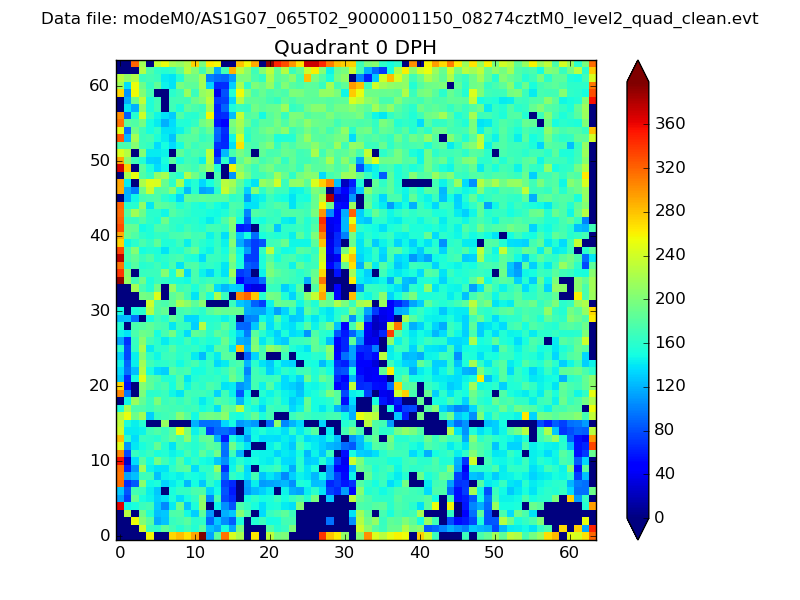 |
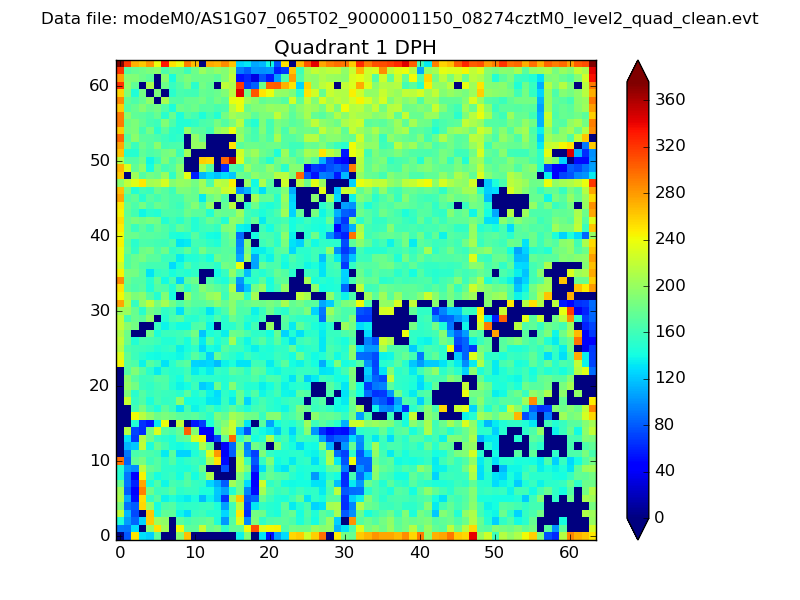 |
Quadrant B |
|---|---|---|---|
| Quadrant D | 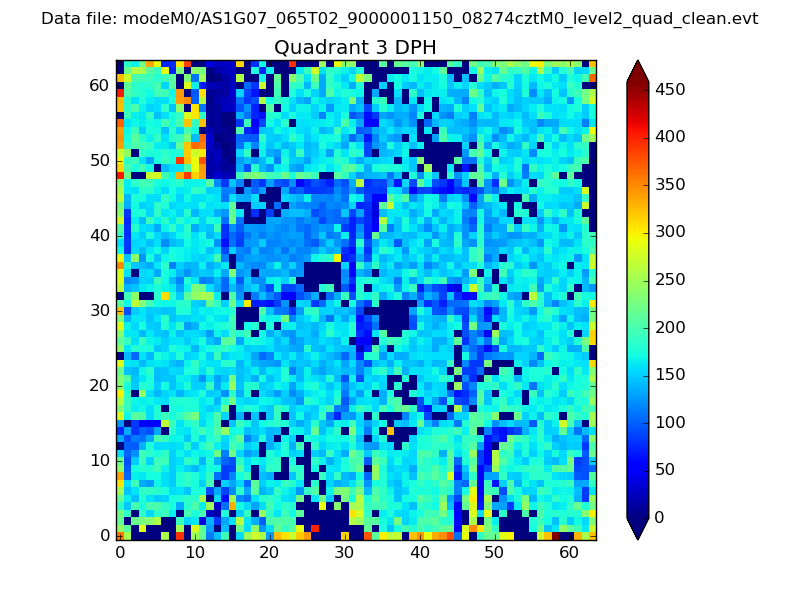 |
 |
Quadrant C |
| Plot type | Count rate plots | Images |
|---|---|---|
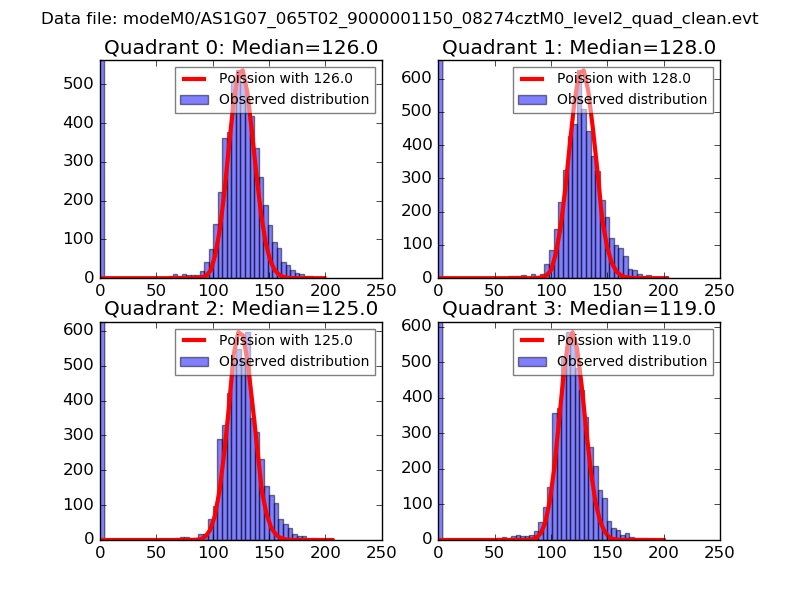
| Comparison with Poisson distribution Blue bars denote a histogram of data divided into 1 sec bins. Red curve is a Poisson curve with rate = median count rate of data. |
 |
 |
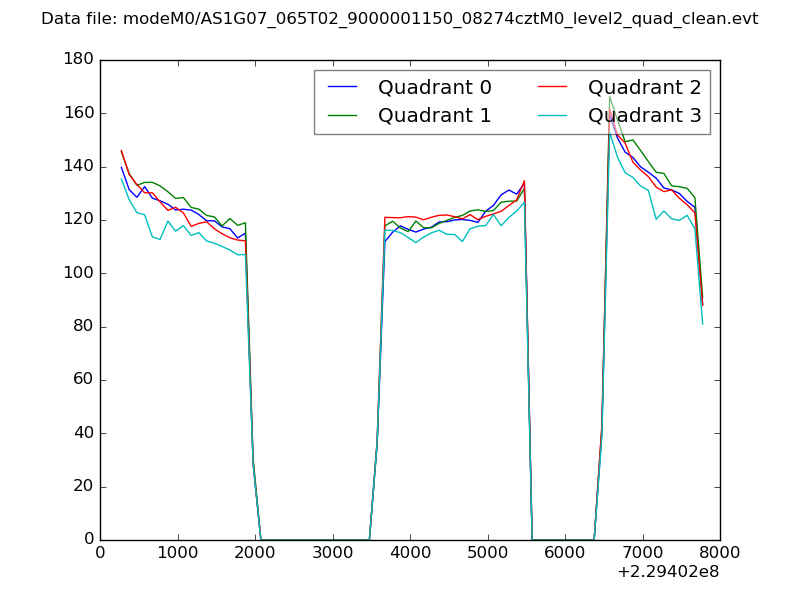
| Quadrant-wise count rates Data is divided into 100 sec bins |
 |
|
| Module-wise count rates for Quadrant A Data is divided into 100 sec bins |
 |
 |
| Module-wise count rates for Quadrant B Data is divided into 100 sec bins |
 |
 |
| Module-wise count rates for Quadrant C Data is divided into 100 sec bins |
 |
 |
| Module-wise count rates for Quadrant D Data is divided into 100 sec bins |
 |
 |
| Parameter | Plot |
|---|---|
| CZT HV Monitor | 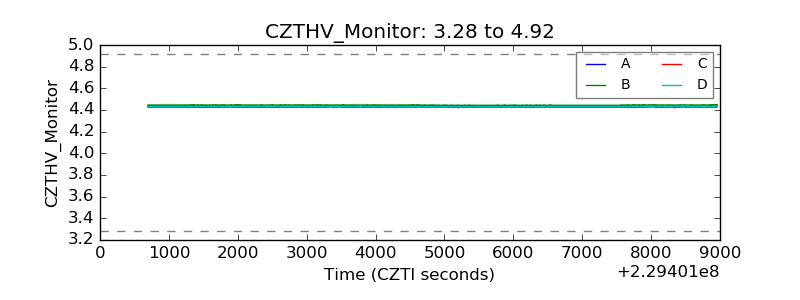 |
| D_VDD | 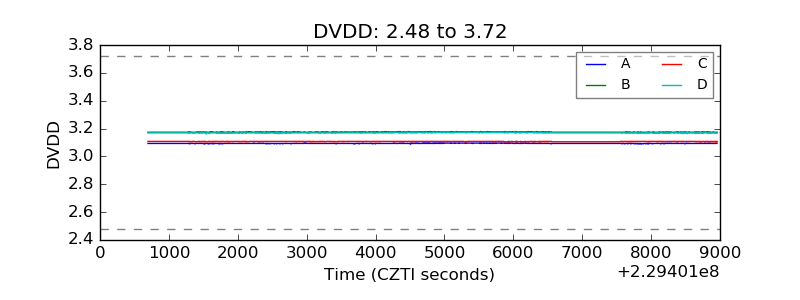 |
| Temperature 1 | 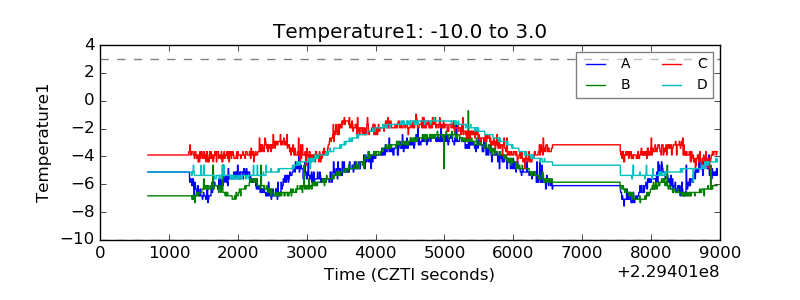 |
| Veto HV Monitor | 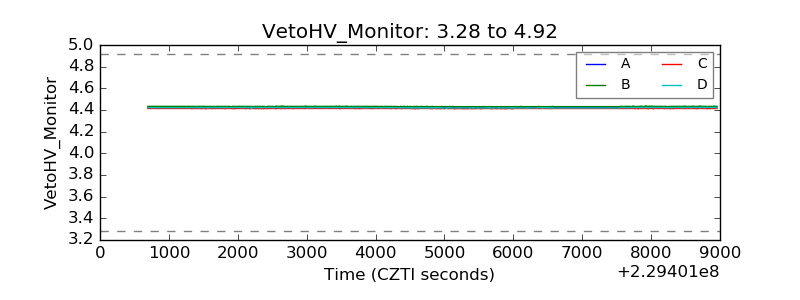 |
| Veto LLD | 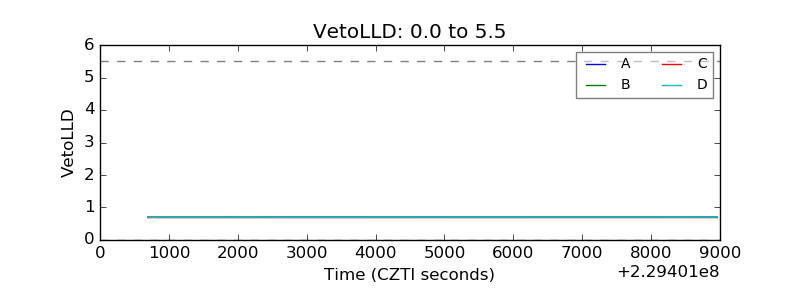 |
| Alpha Counter | 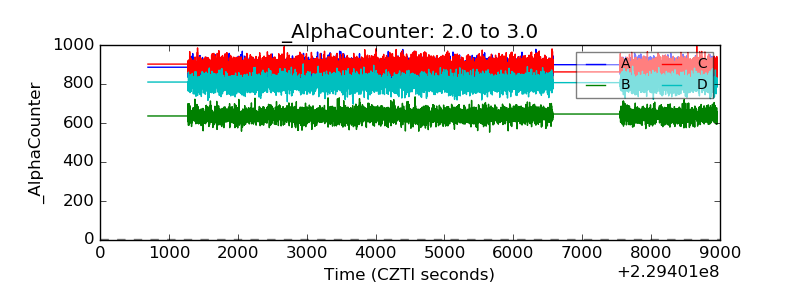 |
| _CPM_Rate | 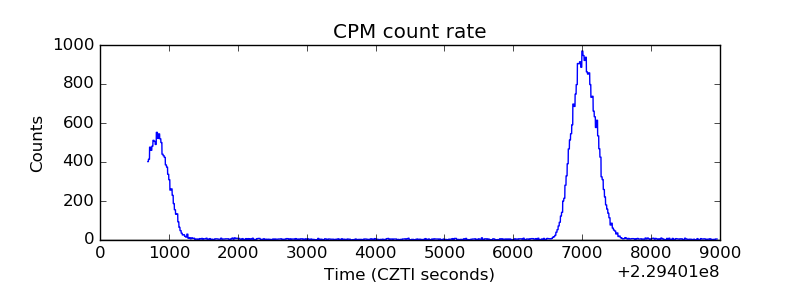 |
| CZT Counter | 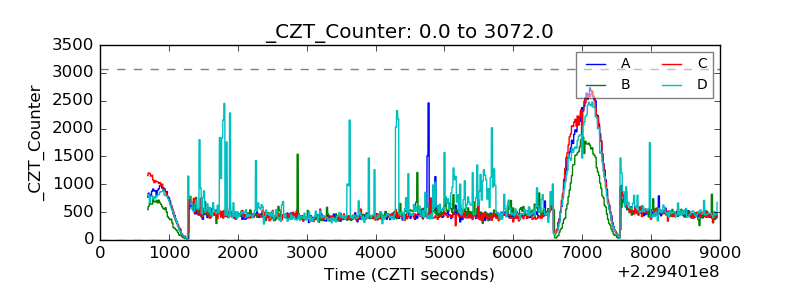 |
| +2.5 Volts monitor |  |
| +5 Volts monitor |  |
| _ROLL_ROT | 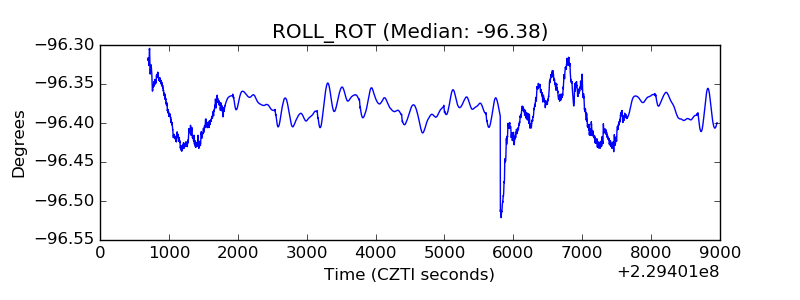 |
| _Roll_DEC |  |
| _Roll_RA | 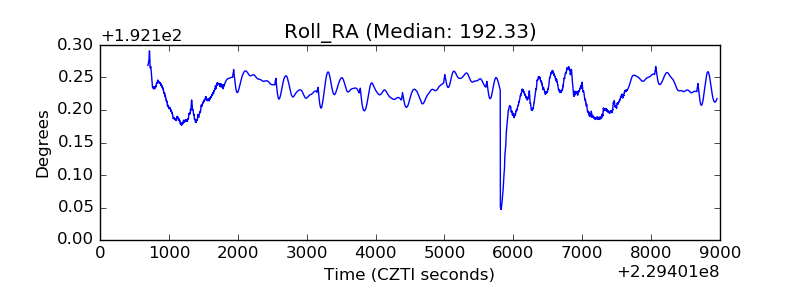 |
| Veto Counter |  |