| Param | Original file | Final file |
|---|---|---|
| Filename | modeM0/AS1G07_065T02_9000001150_08277cztM0_level2.evt | modeM0/AS1G07_065T02_9000001150_08277cztM0_level2_quad_clean.evt |
| Size (bytes) | 460,872,000 | 84,366,720 |
| Size | 439.5 MB | 80.5 MB |
| Events in quadrant A | 3,082,184 | 533,798 |
| Events in quadrant B | 3,304,517 | 541,117 |
| Events in quadrant C | 3,019,376 | 535,869 |
| Events in quadrant D | 4,125,535 | 506,235 |
| Mode M9 | |||
|---|---|---|---|
| Quadrant | BADHDUFLAG | Total packets | Discarded packets |
| A | 0 | 16 | 0 |
| B | 0 | 16 | 0 |
| C | 0 | 16 | 0 |
| D | 0 | 17 | 0 |
| Mode M0 | |||
|---|---|---|---|
| Quadrant | BADHDUFLAG | Total packets | Discarded packets |
| A | 0 | 13246 | 3 |
| B | 0 | 13667 | 2 |
| C | 0 | 13174 | 2 |
| D | 0 | 16294 | 2 |
| Mode SS | |||
|---|---|---|---|
| Quadrant | BADHDUFLAG | Total packets | Discarded packets |
| A | 0 | 128 | 0 |
| B | 0 | 128 | 0 |
| C | 0 | 128 | 0 |
| D | 0 | 128 | 0 |
| Quadrant | Total seconds | Saturated seconds | Saturation percentage |
|---|---|---|---|
| A | 6268 | 85 | 1.356094% |
| B | 6268 | 102 | 1.627313% |
| C | 6268 | 80 | 1.276324% |
| D | 6268 | 240 | 3.828973% |
Noise dominated data is calculated using 1-second bins in cleaned event files. If a bin has >2000 counts, and if more than 50% of those come from <1% of pixels, then it is considered to be noise-dominated and hence unusable.
| Quadrant | # 1 sec bins | Bins with >0 counts | Bins with >2000 counts | High rate bins dominated by noise | Noise dominated (total time) | Noise dominated (detector-on time) | Marked lightcurve |
|---|---|---|---|---|---|---|---|
| A | 7438 | 6268 | 3 | 3 | 0.04% | 0.05% | 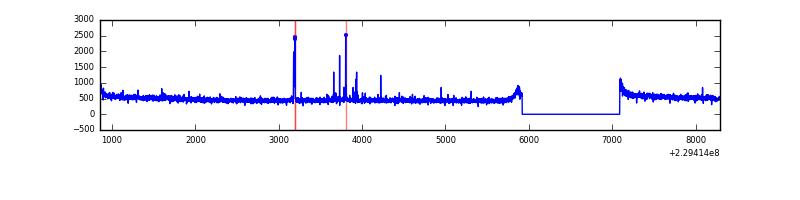 |
| B | 7438 | 6268 | 6 | 6 | 0.08% | 0.10% | 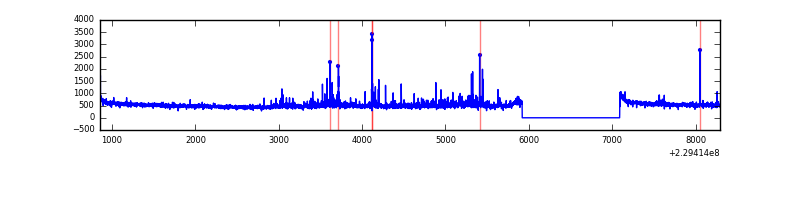 |
| C | 7438 | 6268 | 0 | 0 | 0.00% | 0.00% |  |
| D | 7438 | 6268 | 161 | 161 | 2.16% | 2.57% | 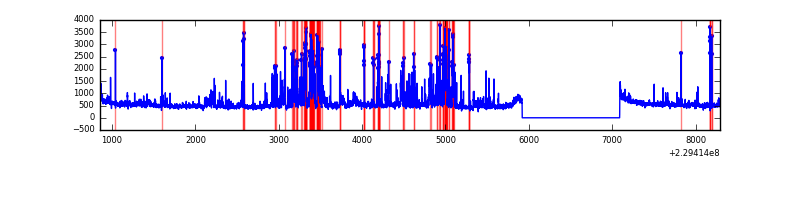 |
Top three noisy pixels from each quadrant. If the there are fewer than three noisy pixels in the level2.evt file, extra rows are filled as -1
| Pixel properties | Quadrant properties | ||||||
|---|---|---|---|---|---|---|---|
| Quadrant | DetID | PixID | Counts | Sigma | Mean | Median | Sigma |
| A | 0 | 254 | 52810 | 332.12 | 785 | 768 | 156.7 |
| A | 0 | 226 | 7479 | 42.83 | 785 | 768 | 156.7 |
| A | 12 | 194 | 7069 | 40.21 | 785 | 768 | 156.7 |
| B | 0 | 214 | 91113 | 615.71 | 786 | 768 | 146.7 |
| B | 11 | 51 | 63808 | 429.62 | 786 | 768 | 146.7 |
| B | 4 | 81 | 36060 | 240.52 | 786 | 768 | 146.7 |
| C | 13 | 61 | 5781 | 28.35 | 773 | 779 | 176.5 |
| C | 9 | 54 | 5535 | 26.95 | 773 | 779 | 176.5 |
| C | 3 | 202 | 2026 | 7.07 | 773 | 779 | 176.5 |
| D | 1 | 52 | 980268 | 5126.74 | 760 | 741 | 191.1 |
| D | 8 | 230 | 106316 | 552.57 | 760 | 741 | 191.1 |
| D | 13 | 169 | 43655 | 224.61 | 760 | 741 | 191.1 |
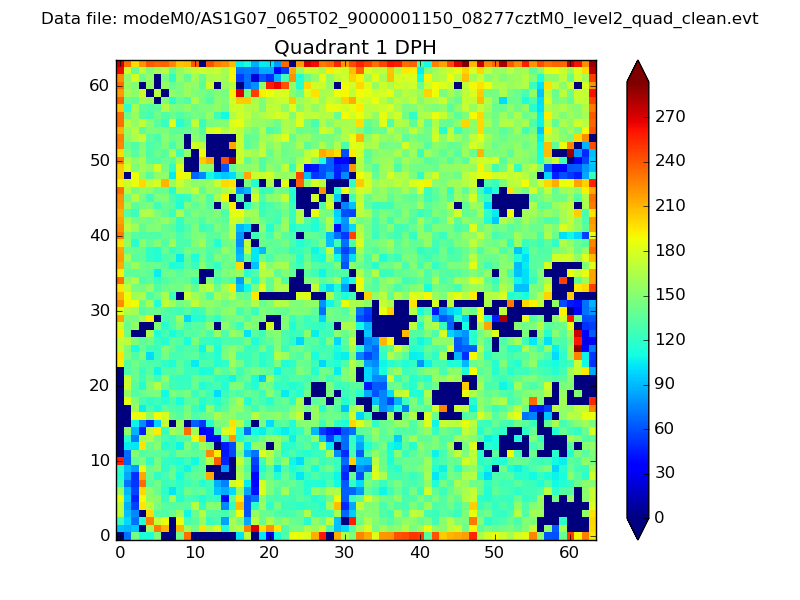
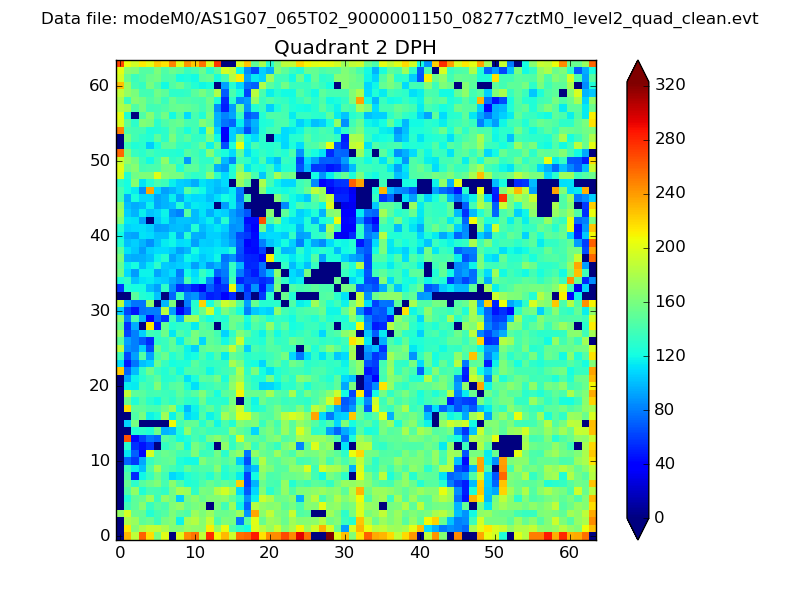
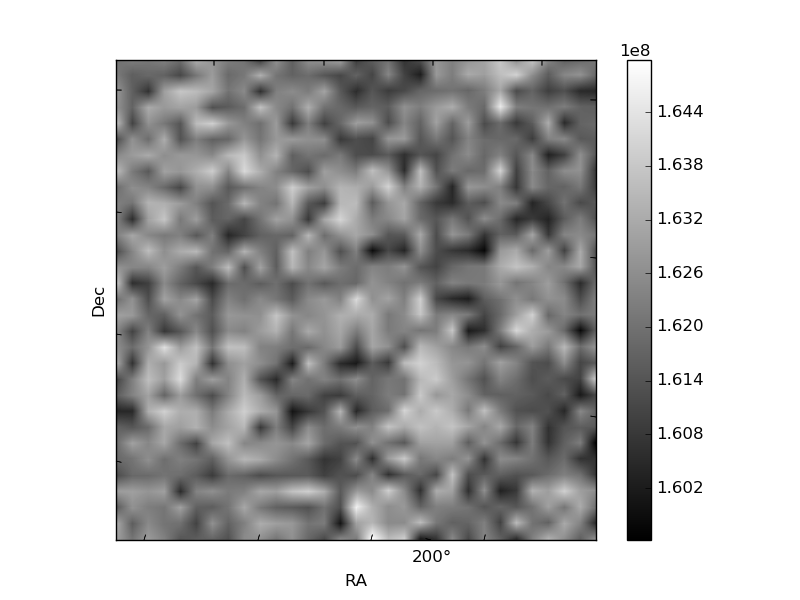
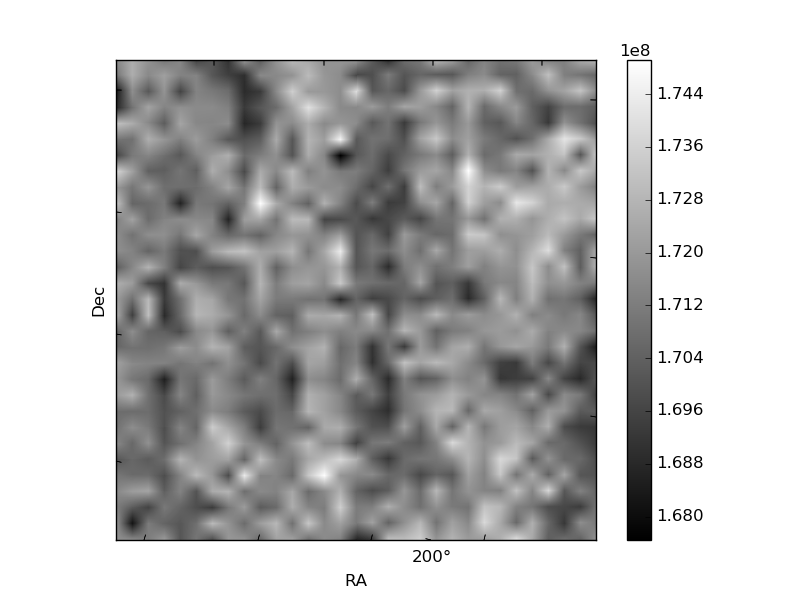
Histogram calculated using DETX and DETY for each event in the final _common_clean file
| Quadrant A | 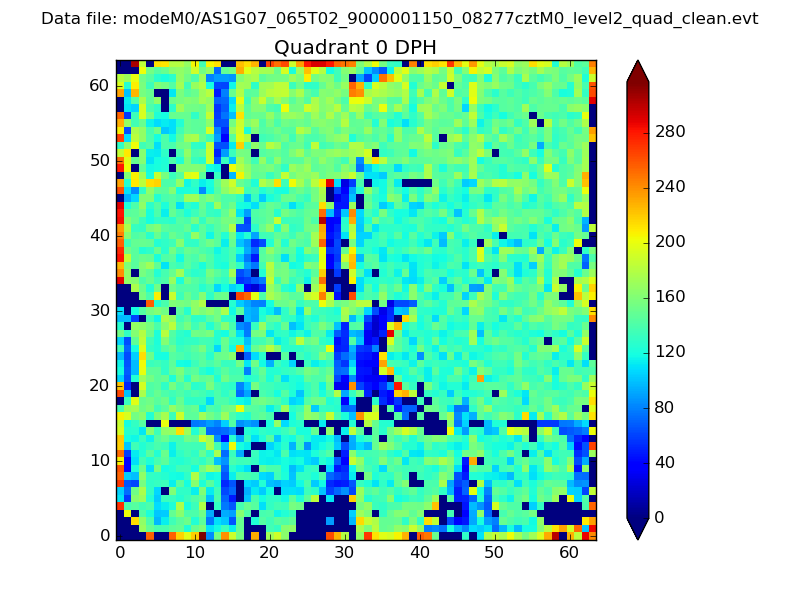 |
 |
Quadrant B |
|---|---|---|---|
| Quadrant D | 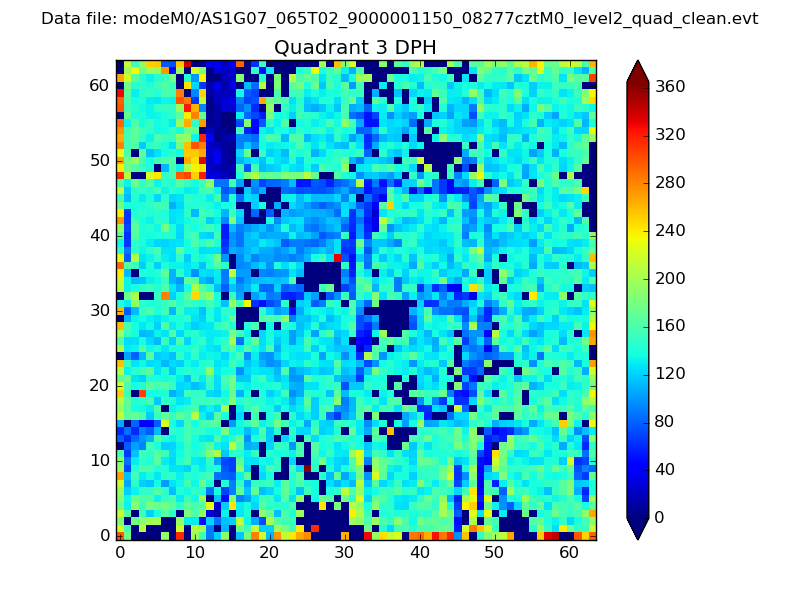 |
 |
Quadrant C |
| Plot type | Count rate plots | Images |
|---|---|---|
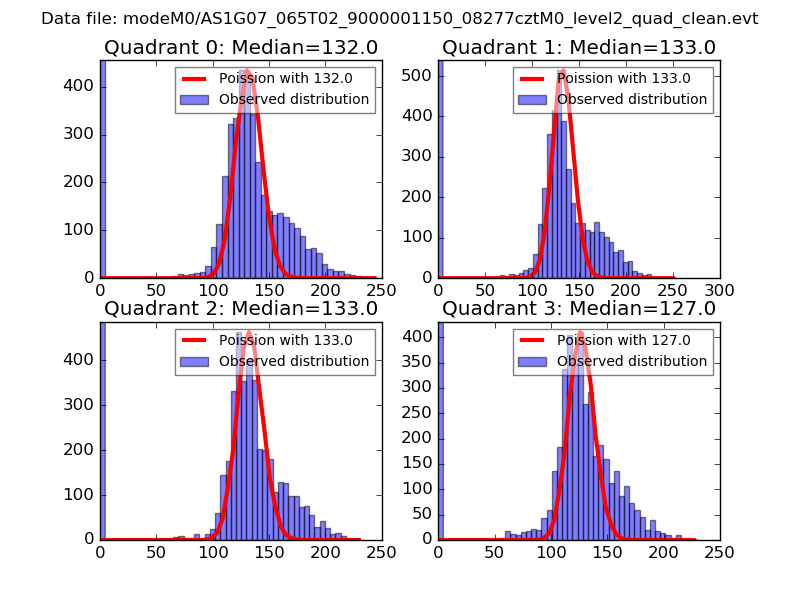
| Comparison with Poisson distribution Blue bars denote a histogram of data divided into 1 sec bins. Red curve is a Poisson curve with rate = median count rate of data. |
 |
 |
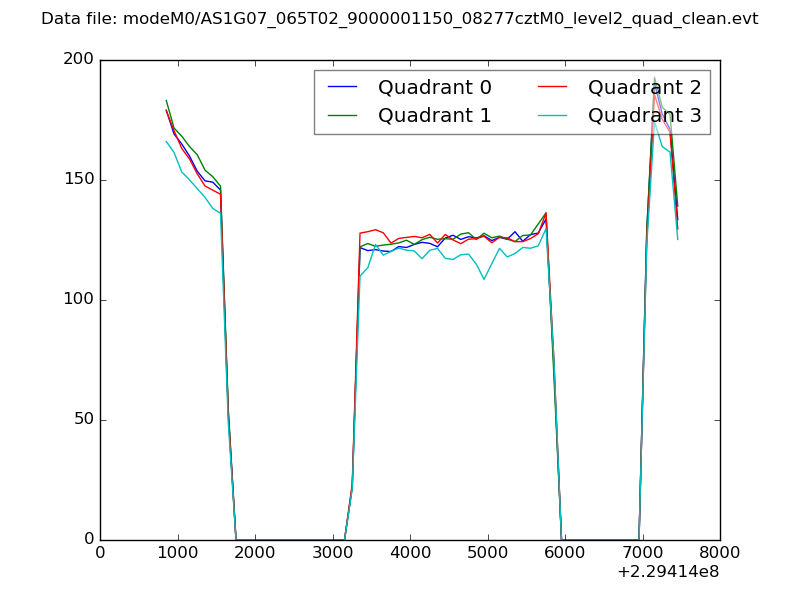
| Quadrant-wise count rates Data is divided into 100 sec bins |
 |
|
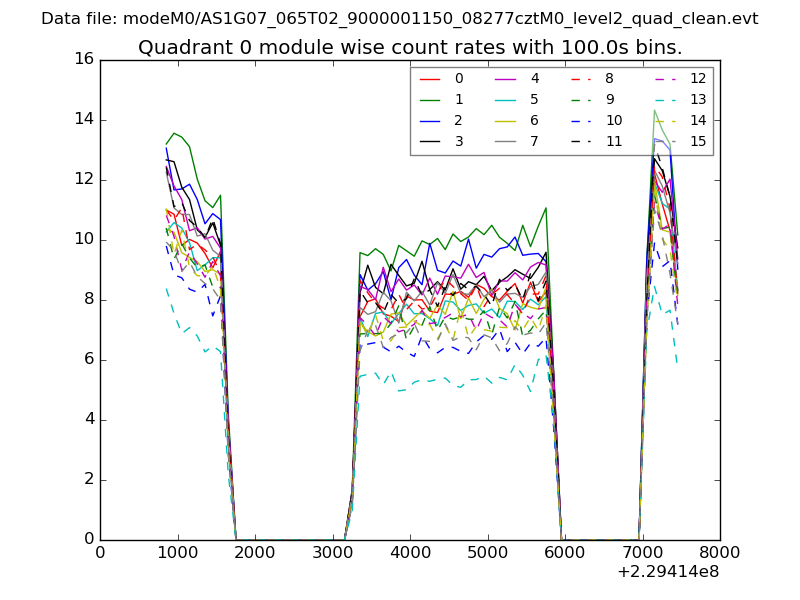
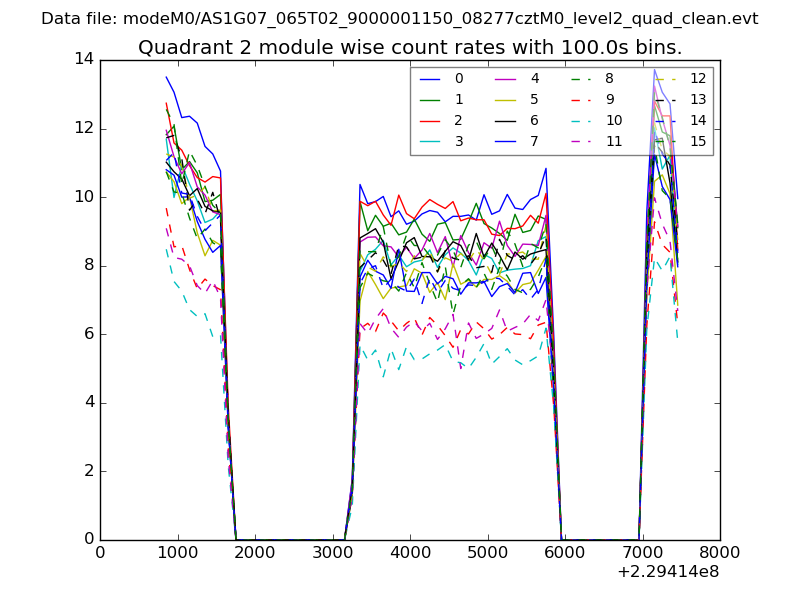
| Module-wise count rates for Quadrant A Data is divided into 100 sec bins |
 |
 |
| Module-wise count rates for Quadrant B Data is divided into 100 sec bins |
 |
 |
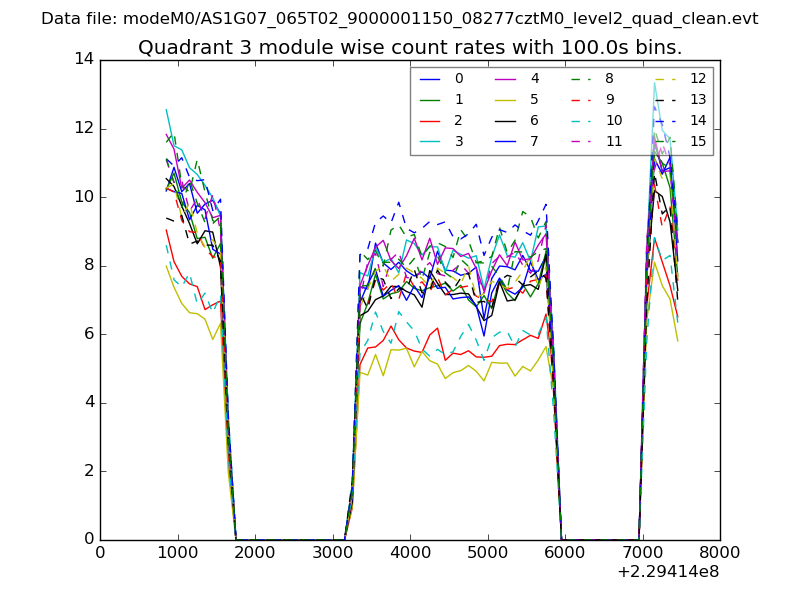
| Module-wise count rates for Quadrant C Data is divided into 100 sec bins |
 |
 |
| Module-wise count rates for Quadrant D Data is divided into 100 sec bins |
 |
 |
| Parameter | Plot |
|---|---|
| CZT HV Monitor | 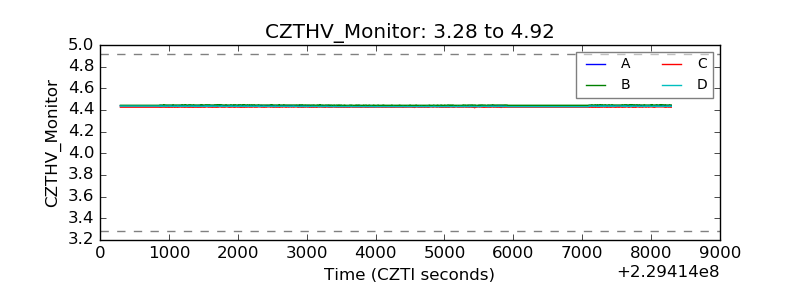 |
| D_VDD | 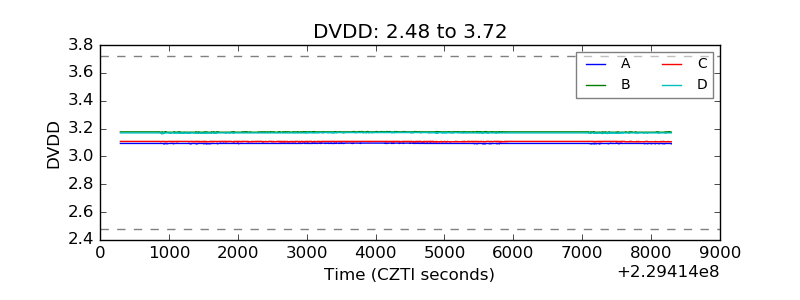 |
| Temperature 1 | 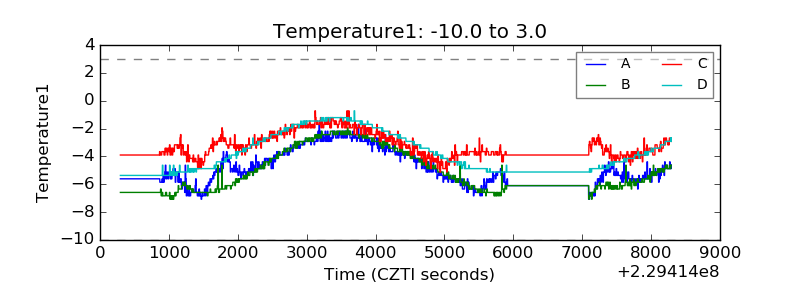 |
| Veto HV Monitor | 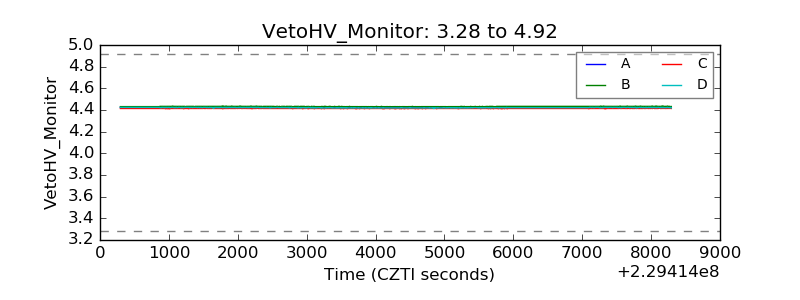 |
| Veto LLD | 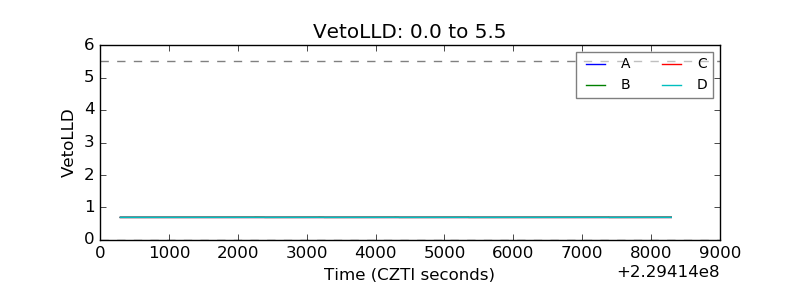 |
| Alpha Counter | 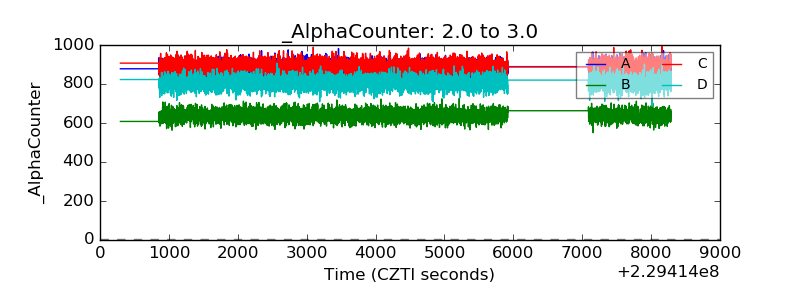 |
| _CPM_Rate | 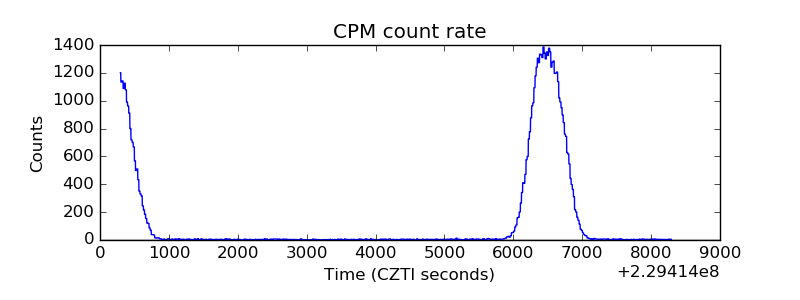 |
| CZT Counter | 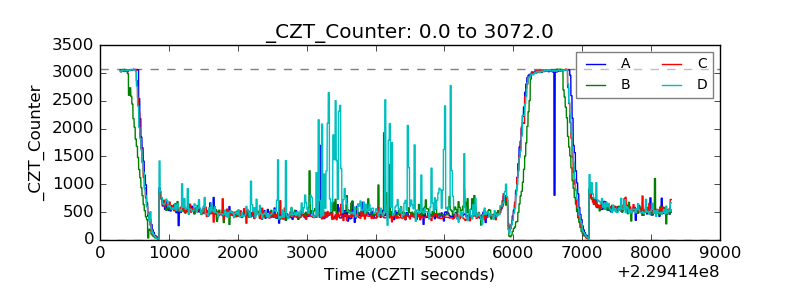 |
| +2.5 Volts monitor |  |
| +5 Volts monitor |  |
| _ROLL_ROT |  |
| _Roll_DEC | 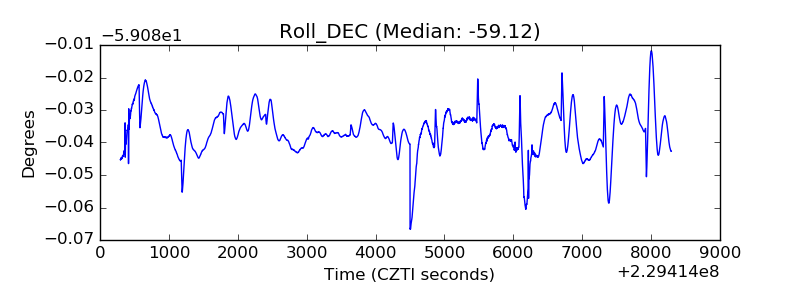 |
| _Roll_RA | 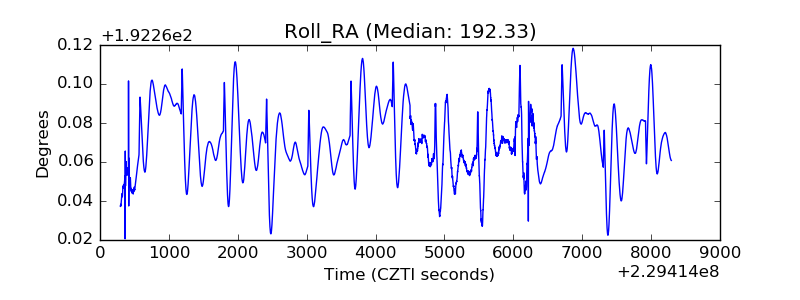 |
| Veto Counter | 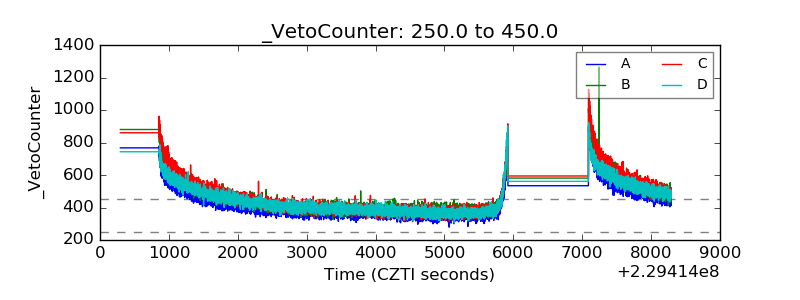 |