| Param | Original file | Final file |
|---|---|---|
| Filename | modeM0/AS1G07_065T02_9000001150_08278cztM0_level2.evt | modeM0/AS1G07_065T02_9000001150_08278cztM0_level2_quad_clean.evt |
| Size (bytes) | 484,240,320 | 74,335,680 |
| Size | 461.8 MB | 70.9 MB |
| Events in quadrant A | 3,116,731 | 465,114 |
| Events in quadrant B | 3,355,225 | 468,679 |
| Events in quadrant C | 3,112,783 | 464,439 |
| Events in quadrant D | 4,656,746 | 416,820 |
| Mode M9 | |||
|---|---|---|---|
| Quadrant | BADHDUFLAG | Total packets | Discarded packets |
| A | 0 | 18 | 0 |
| B | 0 | 18 | 0 |
| C | 0 | 18 | 1 |
| D | 0 | 19 | 0 |
| Mode M0 | |||
|---|---|---|---|
| Quadrant | BADHDUFLAG | Total packets | Discarded packets |
| A | 0 | 13204 | 3 |
| B | 0 | 13740 | 2 |
| C | 0 | 13361 | 2 |
| D | 0 | 17844 | 2 |
| Mode SS | |||
|---|---|---|---|
| Quadrant | BADHDUFLAG | Total packets | Discarded packets |
| A | 0 | 126 | 0 |
| B | 0 | 126 | 0 |
| C | 0 | 126 | 0 |
| D | 0 | 126 | 0 |
| Quadrant | Total seconds | Saturated seconds | Saturation percentage |
|---|---|---|---|
| A | 6244 | 91 | 1.457399% |
| B | 6244 | 117 | 1.873799% |
| C | 6244 | 83 | 1.329276% |
| D | 6244 | 548 | 8.776425% |
Noise dominated data is calculated using 1-second bins in cleaned event files. If a bin has >2000 counts, and if more than 50% of those come from <1% of pixels, then it is considered to be noise-dominated and hence unusable.
| Quadrant | # 1 sec bins | Bins with >0 counts | Bins with >2000 counts | High rate bins dominated by noise | Noise dominated (total time) | Noise dominated (detector-on time) | Marked lightcurve |
|---|---|---|---|---|---|---|---|
| A | 7489 | 6244 | 0 | 0 | 0.00% | 0.00% | 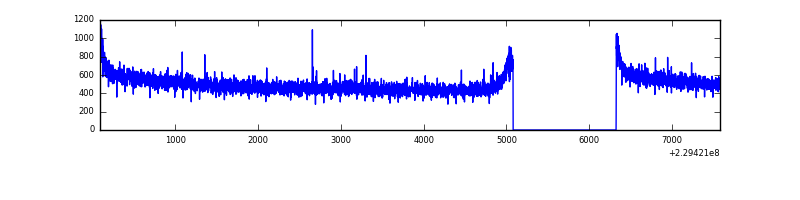 |
| B | 7489 | 6245 | 10 | 10 | 0.13% | 0.16% | 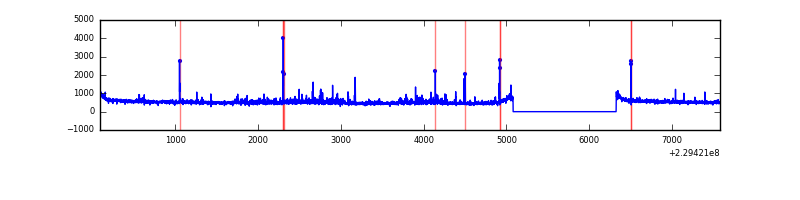 |
| C | 7489 | 6244 | 0 | 0 | 0.00% | 0.00% | 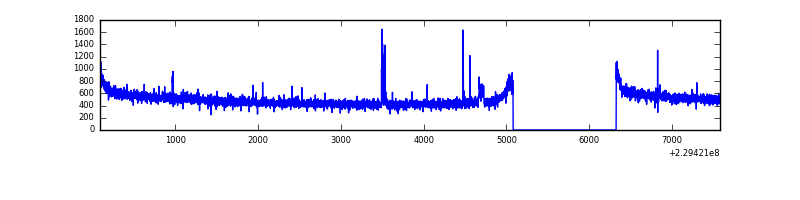 |
| D | 7489 | 6244 | 379 | 379 | 5.06% | 6.07% | 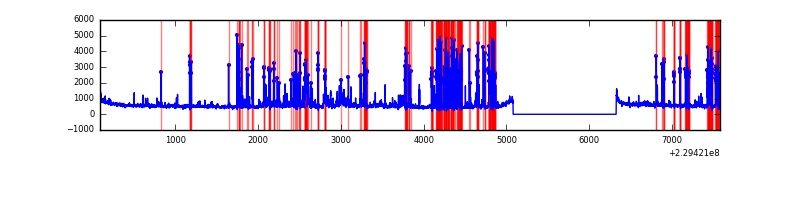 |
Top three noisy pixels from each quadrant. If the there are fewer than three noisy pixels in the level2.evt file, extra rows are filled as -1
| Pixel properties | Quadrant properties | ||||||
|---|---|---|---|---|---|---|---|
| Quadrant | DetID | PixID | Counts | Sigma | Mean | Median | Sigma |
| A | 13 | 14 | 18885 | 112.65 | 803 | 786 | 160.7 |
| A | 0 | 226 | 7614 | 42.5 | 803 | 786 | 160.7 |
| A | 13 | 248 | 7281 | 40.42 | 803 | 786 | 160.7 |
| B | 0 | 214 | 86533 | 578.52 | 801 | 783 | 148.2 |
| B | 11 | 51 | 59533 | 396.36 | 801 | 783 | 148.2 |
| B | 10 | 16 | 41792 | 276.67 | 801 | 783 | 148.2 |
| C | 5 | 128 | 28186 | 155.12 | 784 | 790 | 176.6 |
| C | 9 | 54 | 26290 | 144.39 | 784 | 790 | 176.6 |
| C | 13 | 61 | 5923 | 29.06 | 784 | 790 | 176.6 |
| D | 1 | 52 | 1468946 | 7938.11 | 748 | 729 | 185.0 |
| D | 13 | 169 | 75357 | 403.49 | 748 | 729 | 185.0 |
| D | 12 | 233 | 69826 | 373.58 | 748 | 729 | 185.0 |
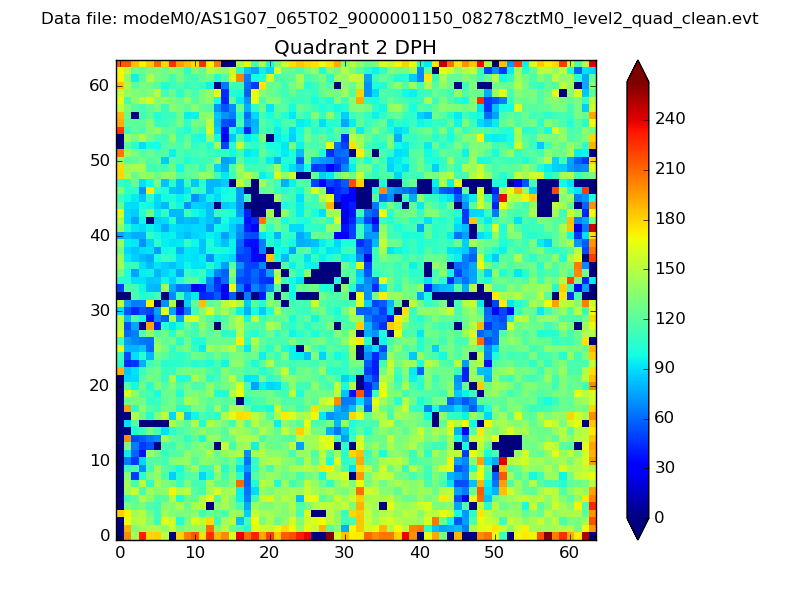
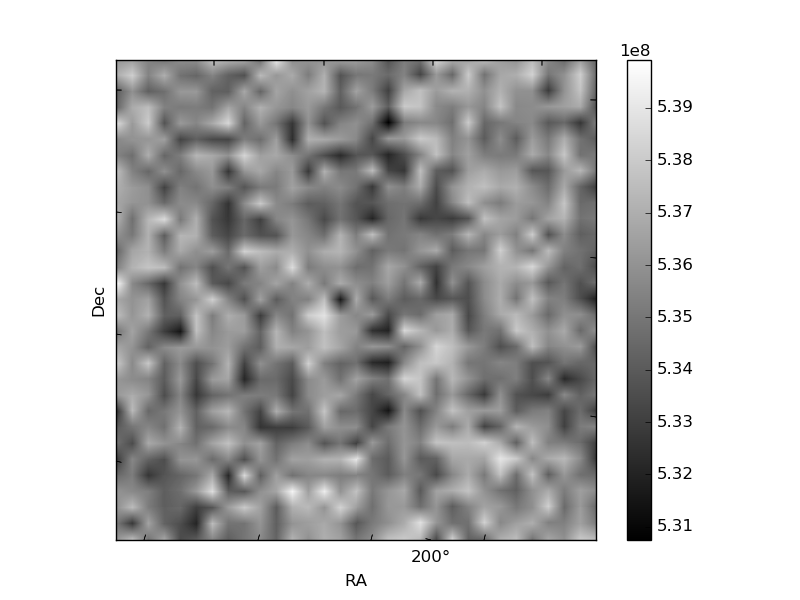
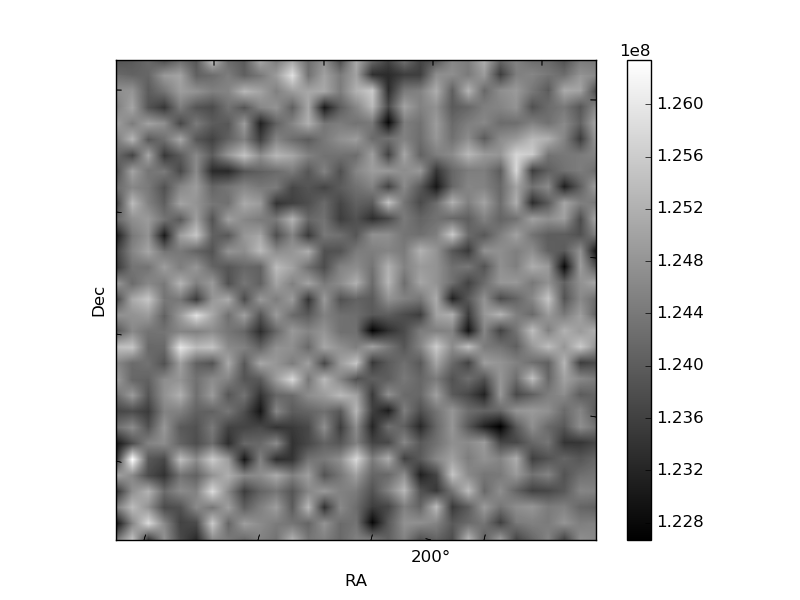
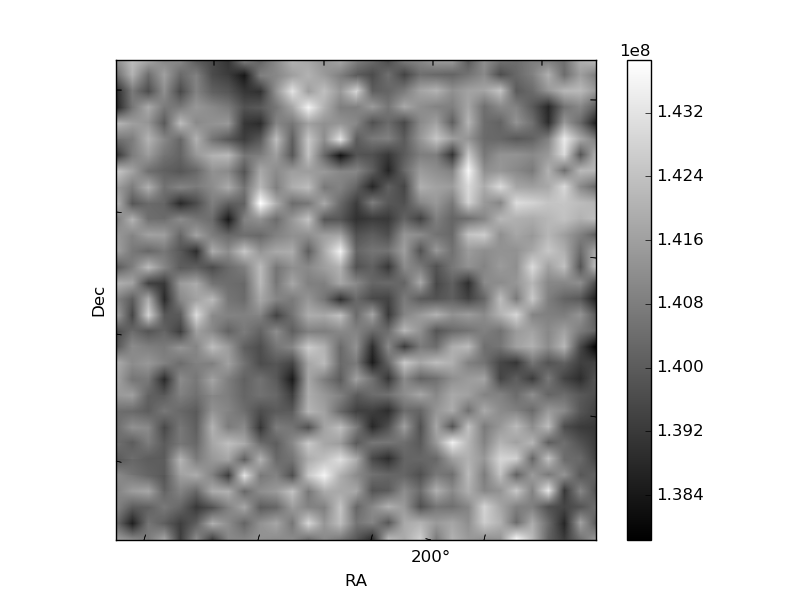
Histogram calculated using DETX and DETY for each event in the final _common_clean file
| Quadrant A | 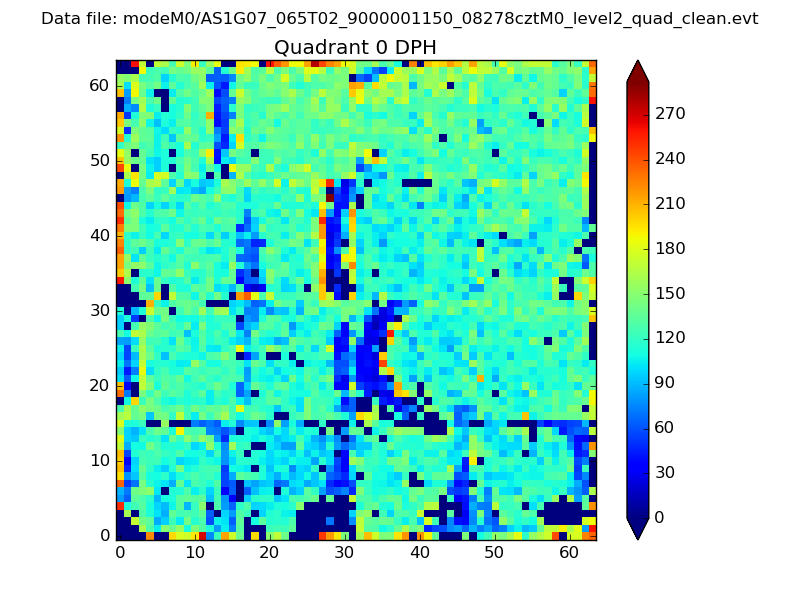 |
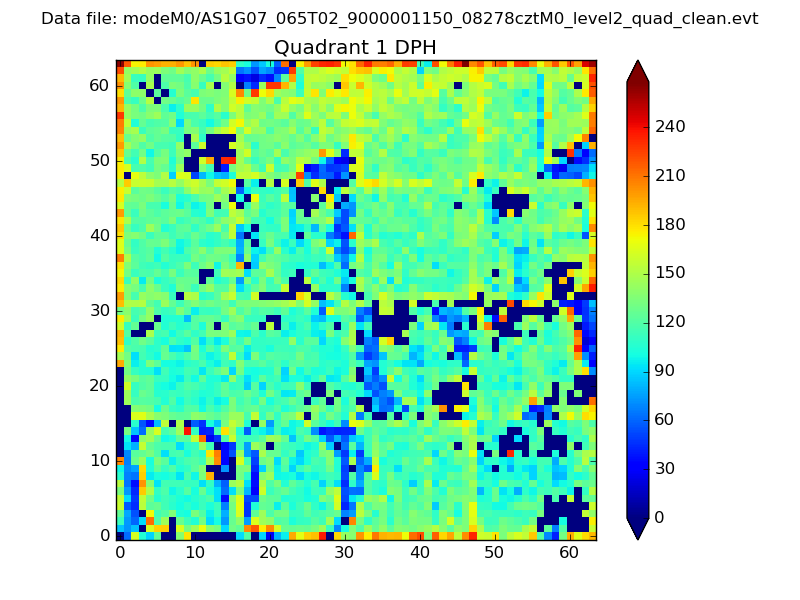 |
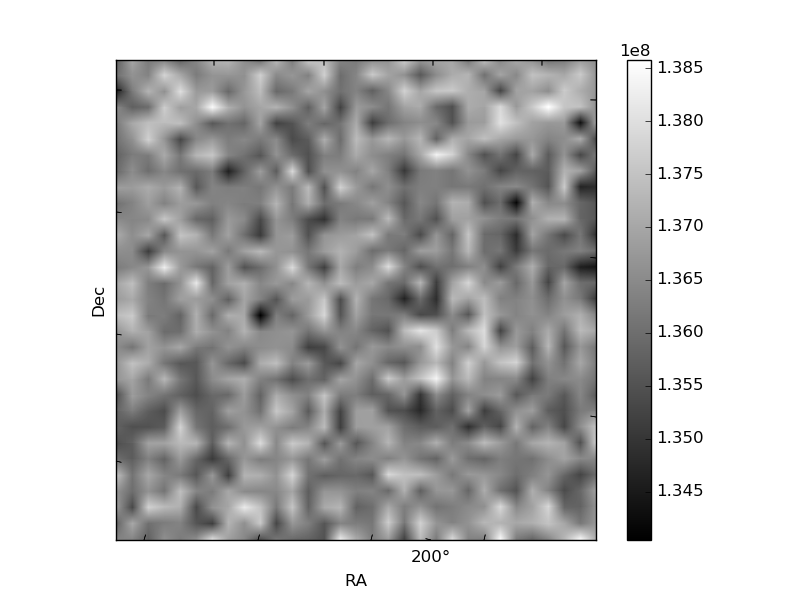
Quadrant B |
|---|---|---|---|
| Quadrant D | 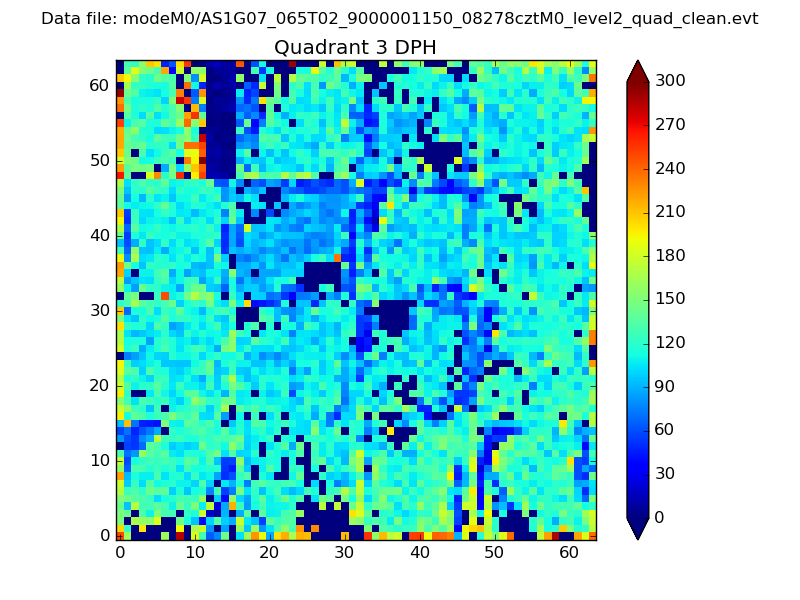 |
 |
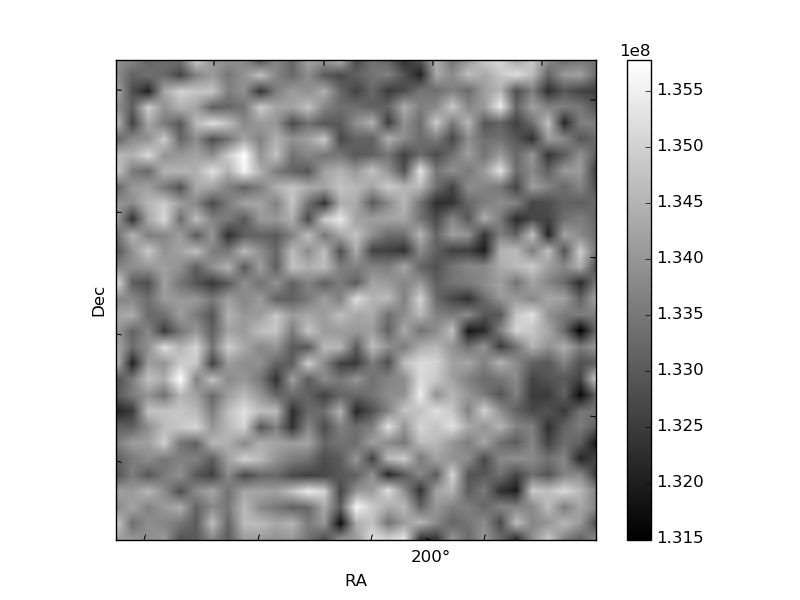
Quadrant C |
| Plot type | Count rate plots | Images |
|---|---|---|
| Comparison with Poisson distribution Blue bars denote a histogram of data divided into 1 sec bins. Red curve is a Poisson curve with rate = median count rate of data. |
 |
 |
| Quadrant-wise count rates Data is divided into 100 sec bins |
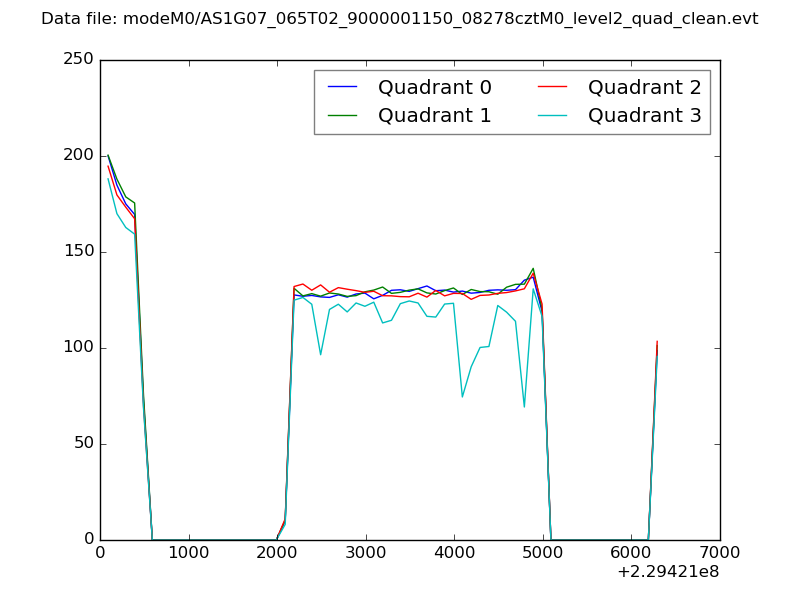 |
|
| Module-wise count rates for Quadrant A Data is divided into 100 sec bins |
 |
 |
| Module-wise count rates for Quadrant B Data is divided into 100 sec bins |
 |
 |
| Module-wise count rates for Quadrant C Data is divided into 100 sec bins |
 |
 |
| Module-wise count rates for Quadrant D Data is divided into 100 sec bins |
 |
 |
| Parameter | Plot |
|---|---|
| CZT HV Monitor |  |
| D_VDD | 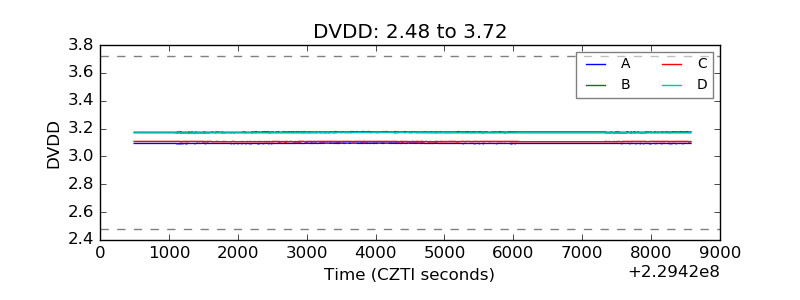 |
| Temperature 1 | 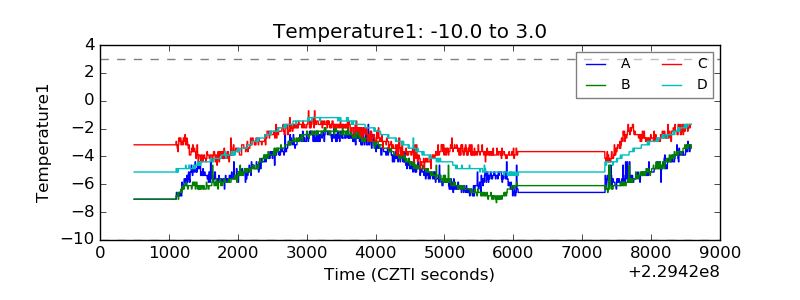 |
| Veto HV Monitor | 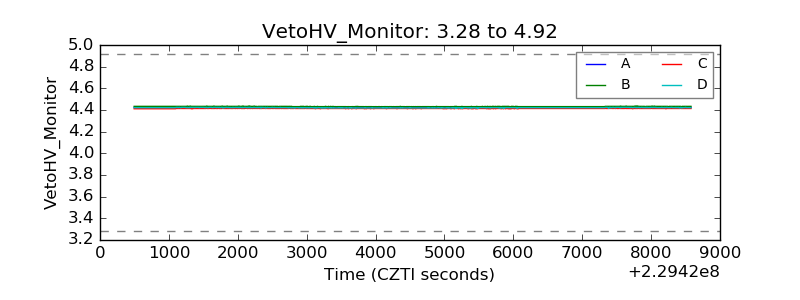 |
| Veto LLD | 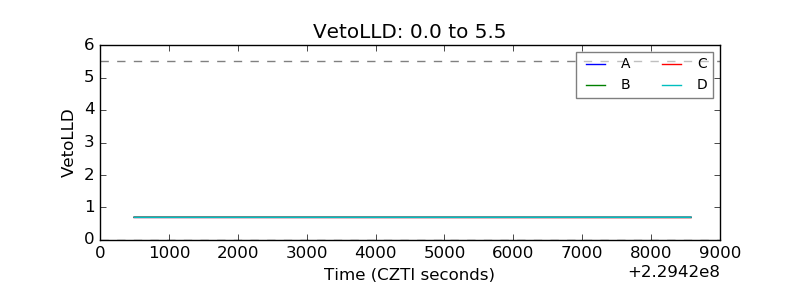 |
| Alpha Counter | 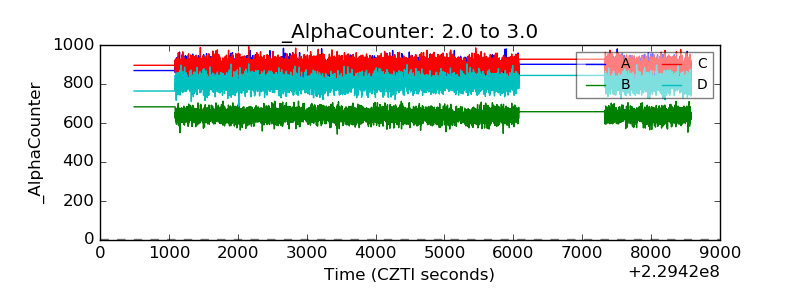 |
| _CPM_Rate | 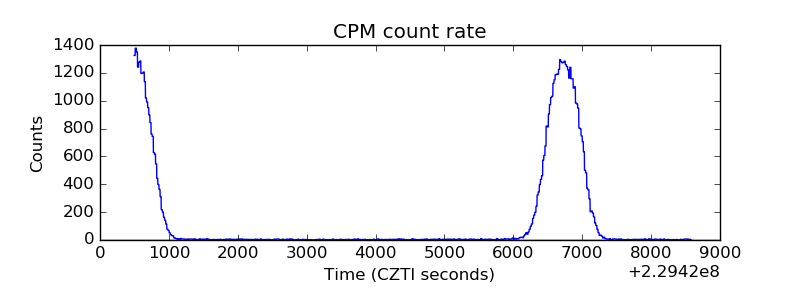 |
| CZT Counter | 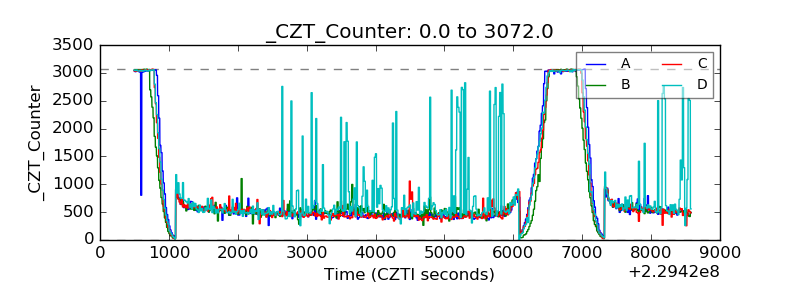 |
| +2.5 Volts monitor |  |
| +5 Volts monitor |  |
| _ROLL_ROT |  |
| _Roll_DEC |  |
| _Roll_RA | 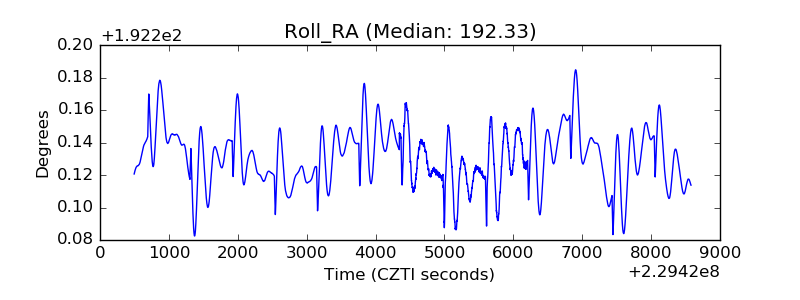 |
| Veto Counter |  |