| Param | Original file | Final file |
|---|---|---|
| Filename | modeM0/AS1G07_065T02_9000001150_08279cztM0_level2.evt | modeM0/AS1G07_065T02_9000001150_08279cztM0_level2_quad_clean.evt |
| Size (bytes) | 459,178,560 | 72,074,880 |
| Size | 437.9 MB | 68.7 MB |
| Events in quadrant A | 3,076,826 | 441,869 |
| Events in quadrant B | 3,412,125 | 442,342 |
| Events in quadrant C | 3,034,571 | 439,824 |
| Events in quadrant D | 3,959,416 | 423,542 |
| Mode M9 | |||
|---|---|---|---|
| Quadrant | BADHDUFLAG | Total packets | Discarded packets |
| A | 0 | 12 | 0 |
| B | 0 | 12 | 0 |
| C | 0 | 12 | 0 |
| D | 0 | 12 | 0 |
| Mode M0 | |||
|---|---|---|---|
| Quadrant | BADHDUFLAG | Total packets | Discarded packets |
| A | 0 | 13031 | 4 |
| B | 0 | 13947 | 1 |
| C | 0 | 13035 | 1 |
| D | 0 | 15738 | 1 |
| Mode SS | |||
|---|---|---|---|
| Quadrant | BADHDUFLAG | Total packets | Discarded packets |
| A | 0 | 128 | 0 |
| B | 0 | 128 | 0 |
| C | 0 | 128 | 0 |
| D | 0 | 128 | 0 |
| Quadrant | Total seconds | Saturated seconds | Saturation percentage |
|---|---|---|---|
| A | 6222 | 94 | 1.510768% |
| B | 6223 | 142 | 2.281858% |
| C | 6223 | 93 | 1.494456% |
| D | 6223 | 344 | 5.527880% |
Noise dominated data is calculated using 1-second bins in cleaned event files. If a bin has >2000 counts, and if more than 50% of those come from <1% of pixels, then it is considered to be noise-dominated and hence unusable.
| Quadrant | # 1 sec bins | Bins with >0 counts | Bins with >2000 counts | High rate bins dominated by noise | Noise dominated (total time) | Noise dominated (detector-on time) | Marked lightcurve |
|---|---|---|---|---|---|---|---|
| A | 7473 | 6223 | 1 | 1 | 0.01% | 0.02% | 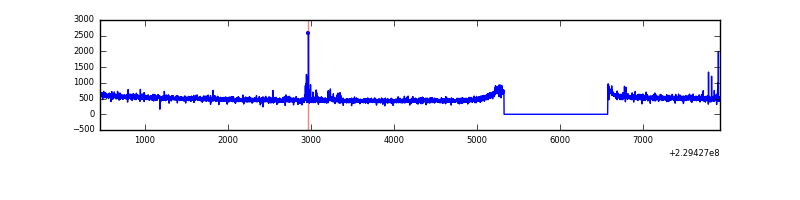 |
| B | 7473 | 6223 | 28 | 28 | 0.37% | 0.45% | 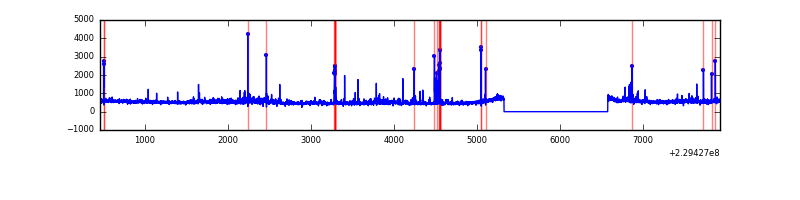 |
| C | 7473 | 6223 | 2 | 2 | 0.03% | 0.03% | 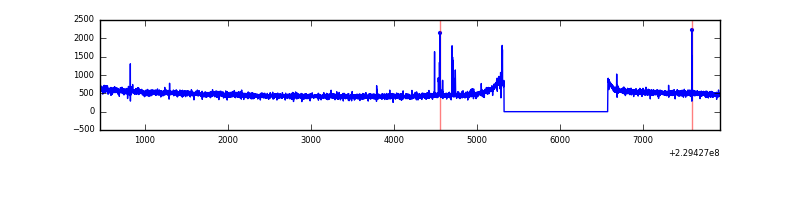 |
| D | 7473 | 6223 | 217 | 217 | 2.90% | 3.49% | 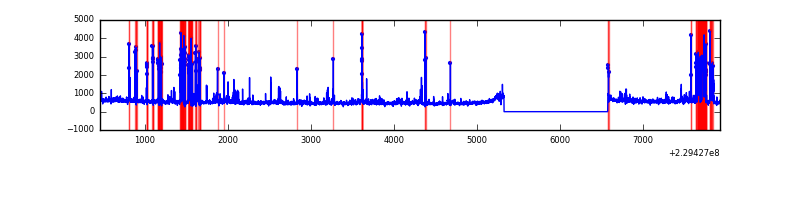 |
Top three noisy pixels from each quadrant. If the there are fewer than three noisy pixels in the level2.evt file, extra rows are filled as -1
| Pixel properties | Quadrant properties | ||||||
|---|---|---|---|---|---|---|---|
| Quadrant | DetID | PixID | Counts | Sigma | Mean | Median | Sigma |
| A | 0 | 254 | 33224 | 205.12 | 790 | 774 | 158.2 |
| A | 0 | 226 | 7619 | 43.27 | 790 | 774 | 158.2 |
| A | 12 | 194 | 7077 | 39.84 | 790 | 774 | 158.2 |
| B | 0 | 214 | 132948 | 915.38 | 787 | 769 | 144.4 |
| B | 10 | 16 | 66011 | 451.82 | 787 | 769 | 144.4 |
| B | 11 | 51 | 62078 | 424.58 | 787 | 769 | 144.4 |
| C | 9 | 54 | 44813 | 254.33 | 765 | 767 | 173.2 |
| C | 13 | 61 | 5880 | 29.52 | 765 | 767 | 173.2 |
| C | 1 | 3 | 4365 | 20.78 | 765 | 767 | 173.2 |
| D | 1 | 52 | 786140 | 4127.17 | 747 | 731 | 190.3 |
| D | 8 | 195 | 83344 | 434.12 | 747 | 731 | 190.3 |
| D | 8 | 230 | 41321 | 213.29 | 747 | 731 | 190.3 |
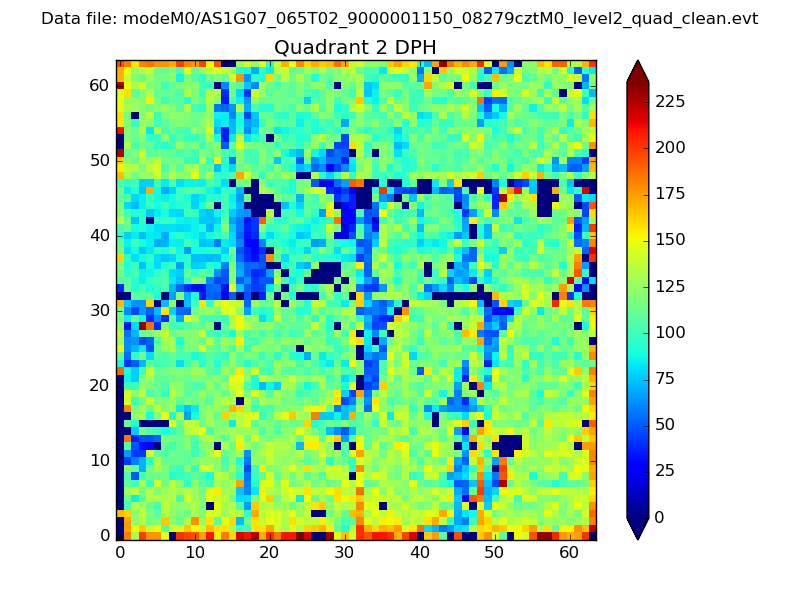
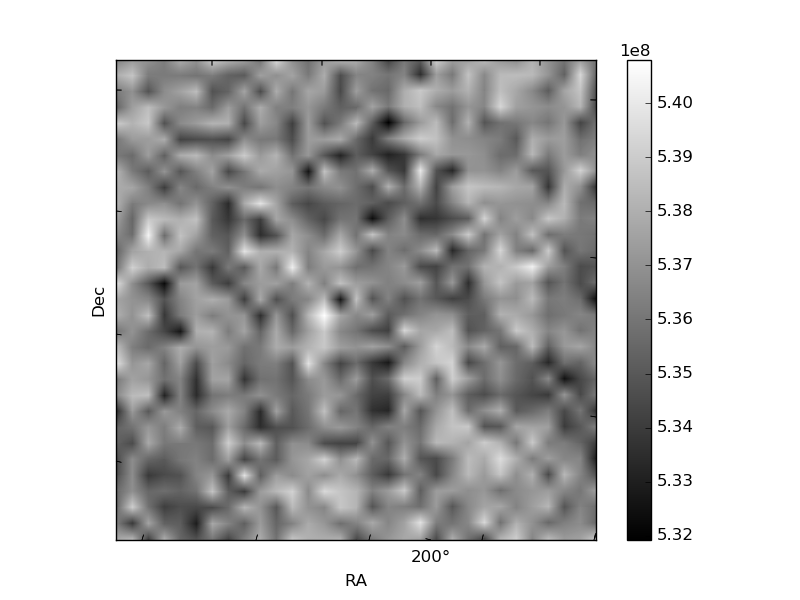
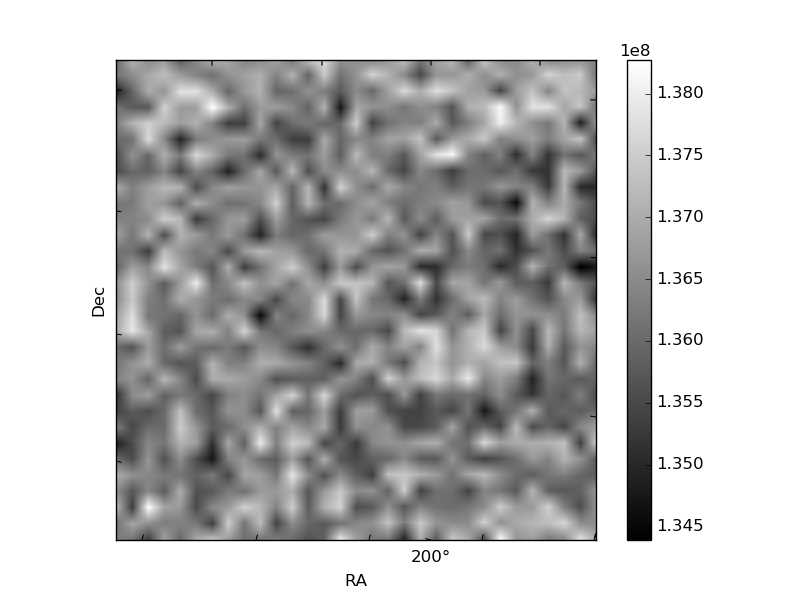
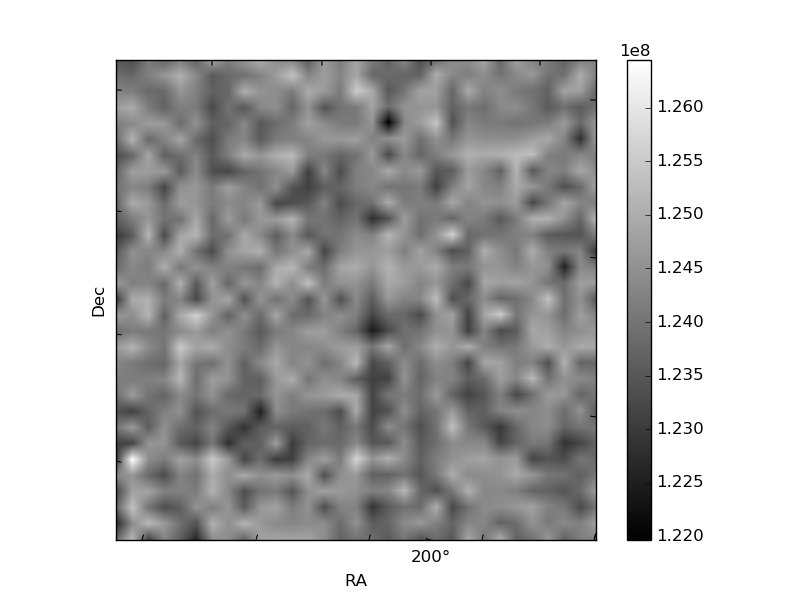
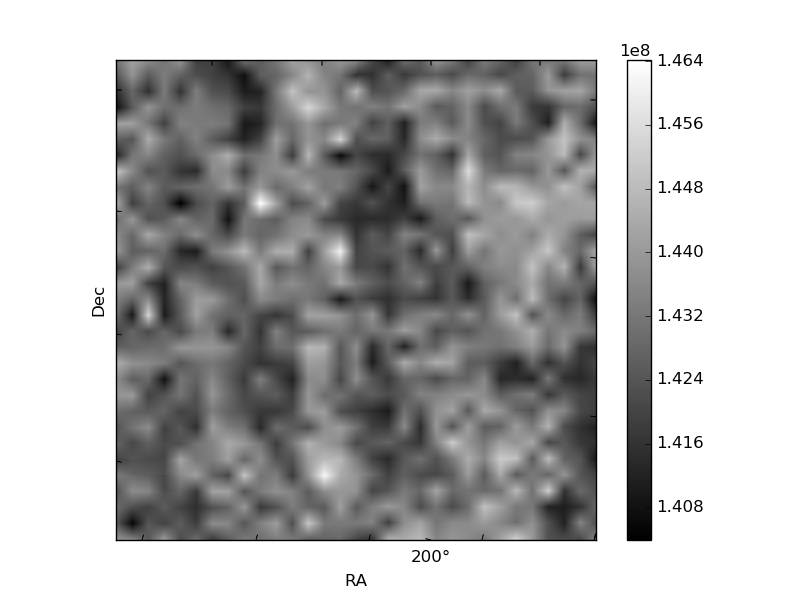
Histogram calculated using DETX and DETY for each event in the final _common_clean file
| Quadrant A | 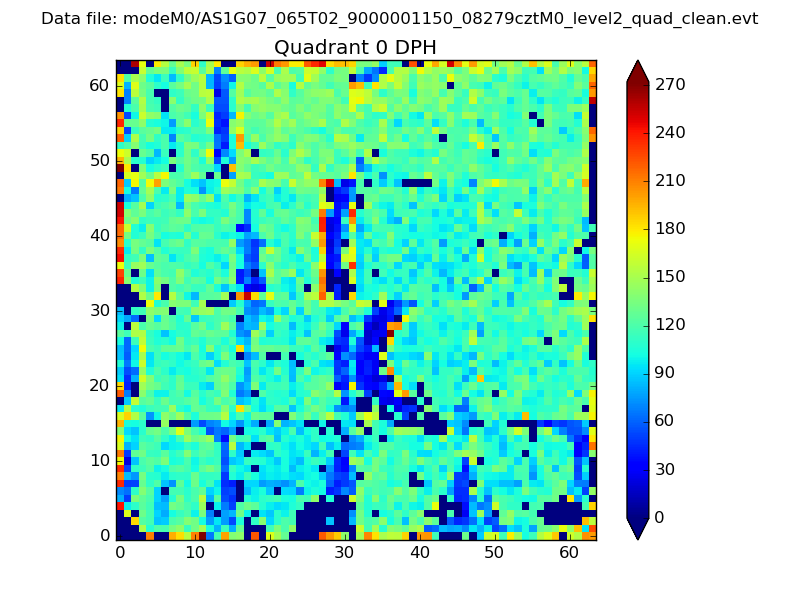 |
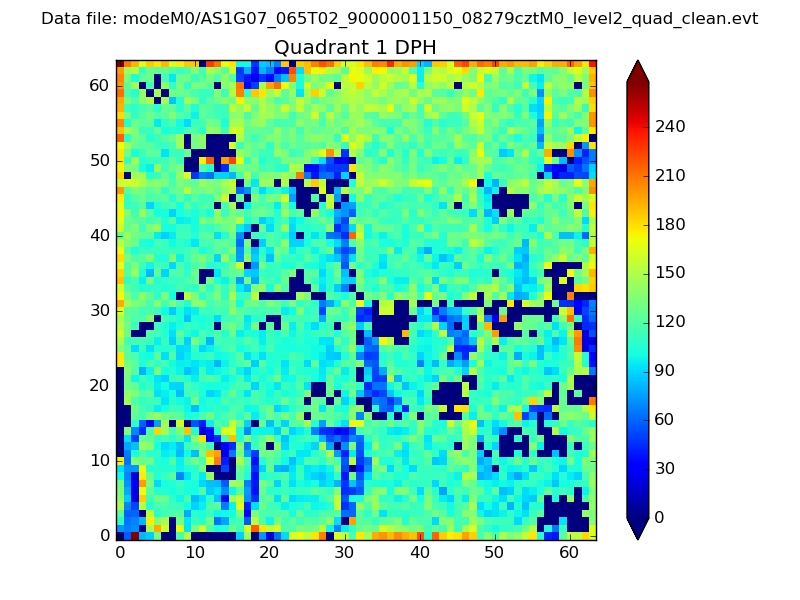 |
Quadrant B |
|---|---|---|---|
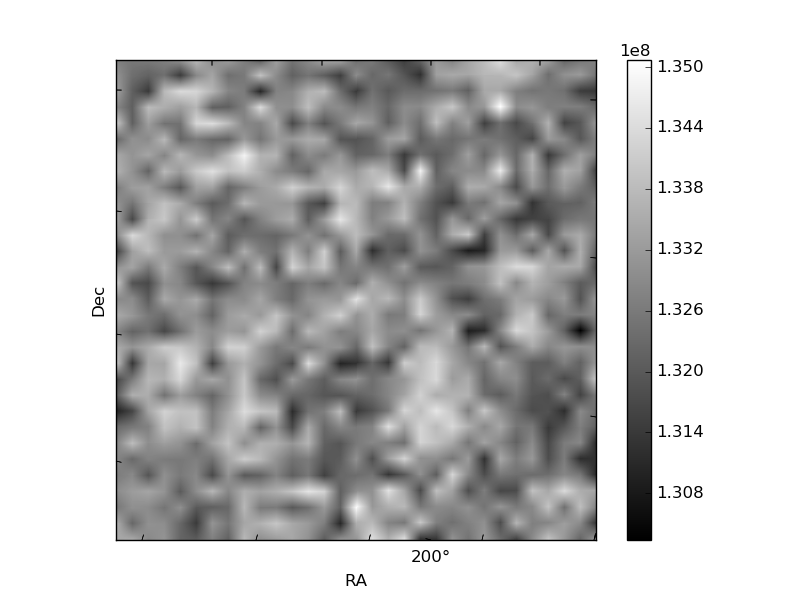
| Quadrant D | 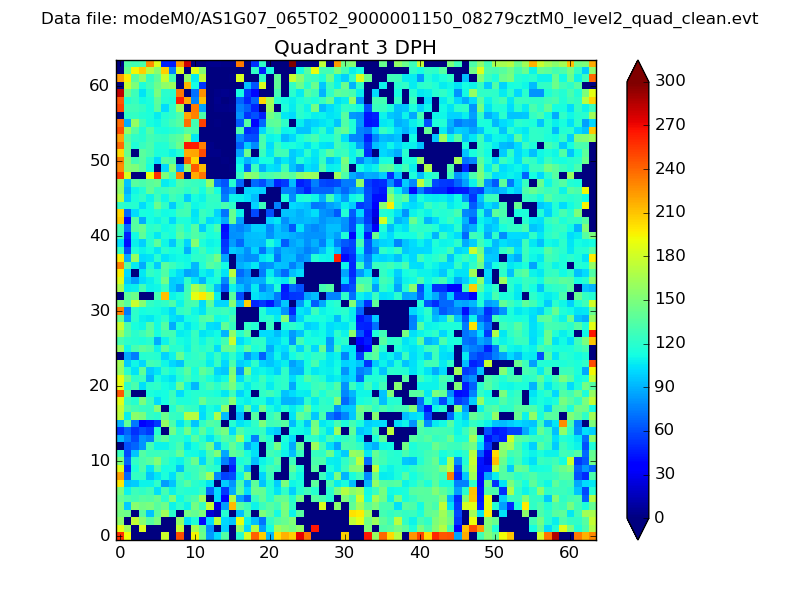 |
 |
Quadrant C |
| Plot type | Count rate plots | Images |
|---|---|---|
| Comparison with Poisson distribution Blue bars denote a histogram of data divided into 1 sec bins. Red curve is a Poisson curve with rate = median count rate of data. |
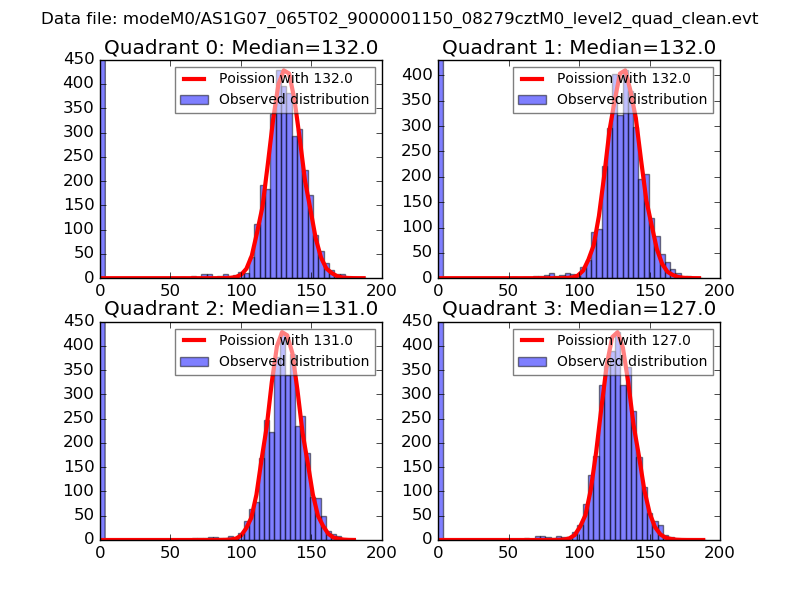 |
 |
| Quadrant-wise count rates Data is divided into 100 sec bins |
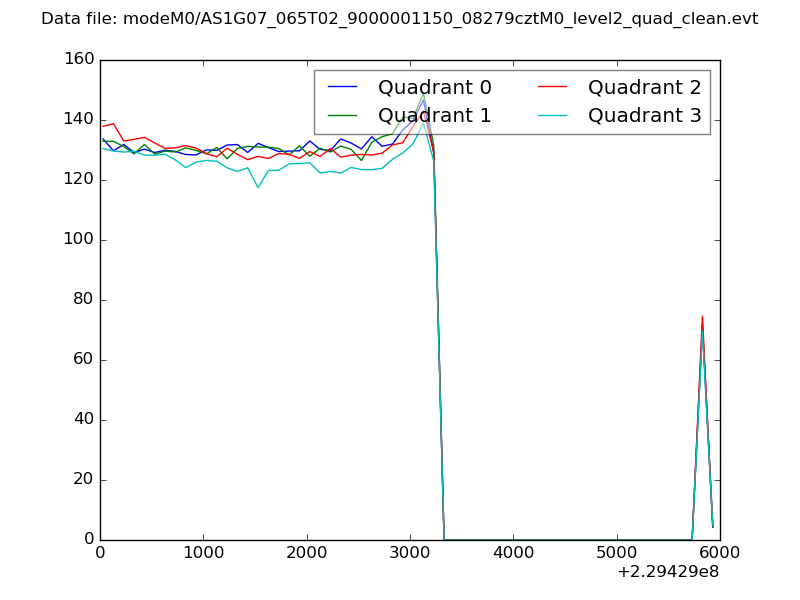 |
|
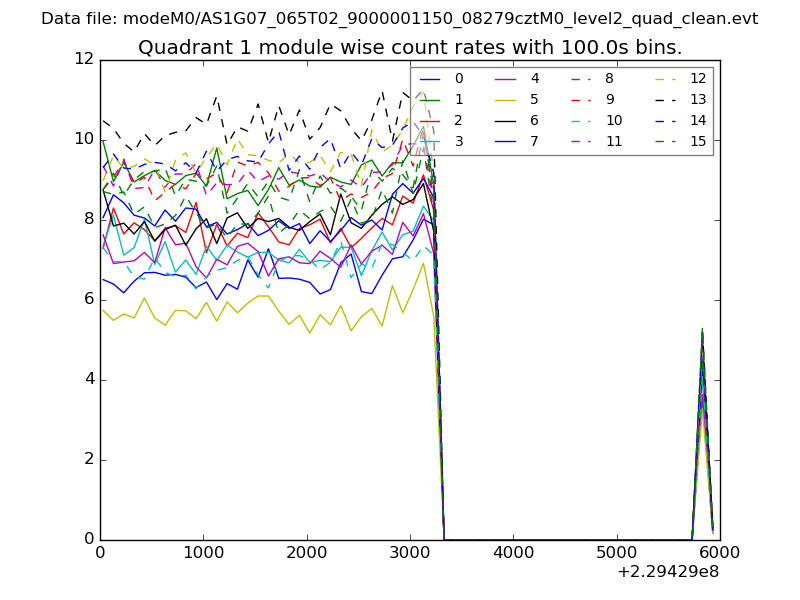
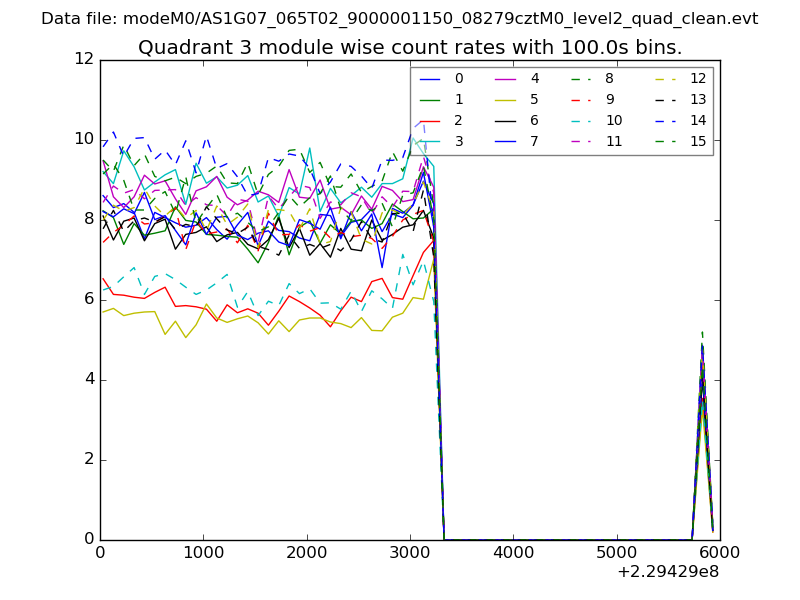
| Module-wise count rates for Quadrant A Data is divided into 100 sec bins |
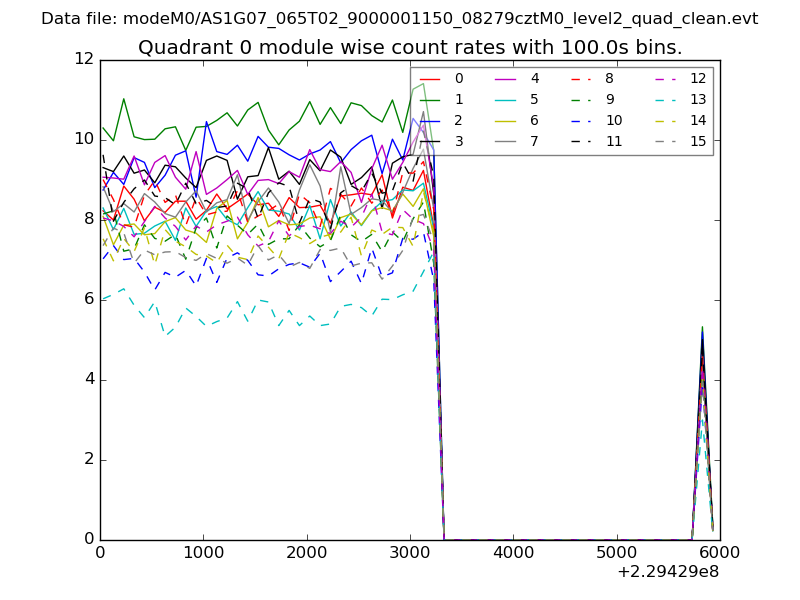 |
 |
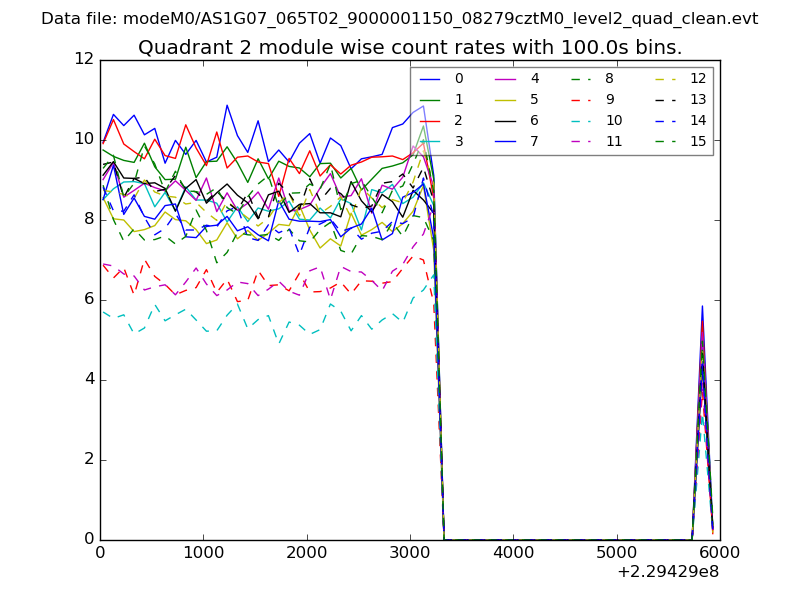
| Module-wise count rates for Quadrant B Data is divided into 100 sec bins |
 |
 |
| Module-wise count rates for Quadrant C Data is divided into 100 sec bins |
 |
 |
| Module-wise count rates for Quadrant D Data is divided into 100 sec bins |
 |
 |
| Parameter | Plot |
|---|---|
| CZT HV Monitor | 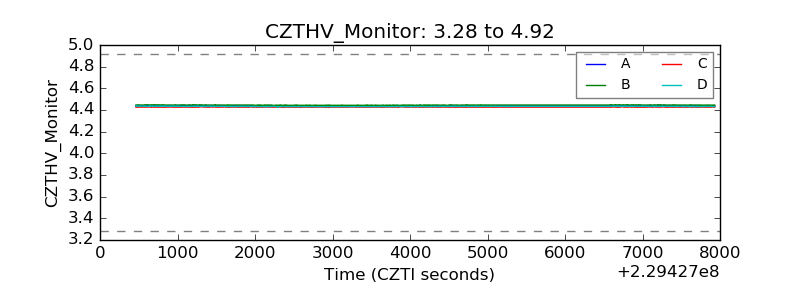 |
| D_VDD | 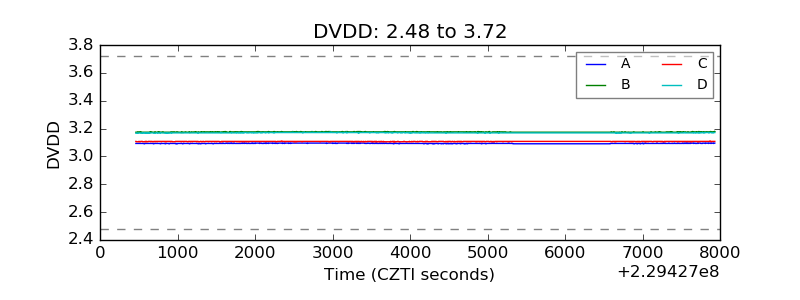 |
| Temperature 1 |  |
| Veto HV Monitor | 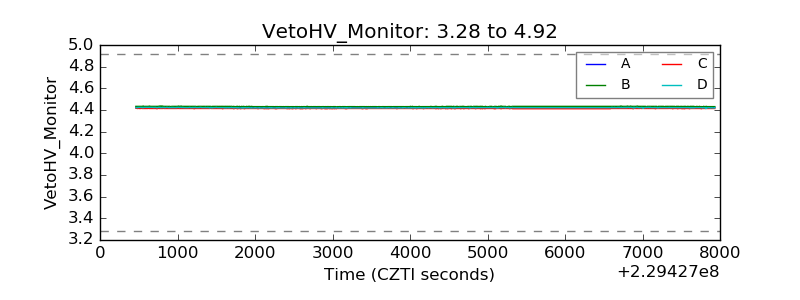 |
| Veto LLD | 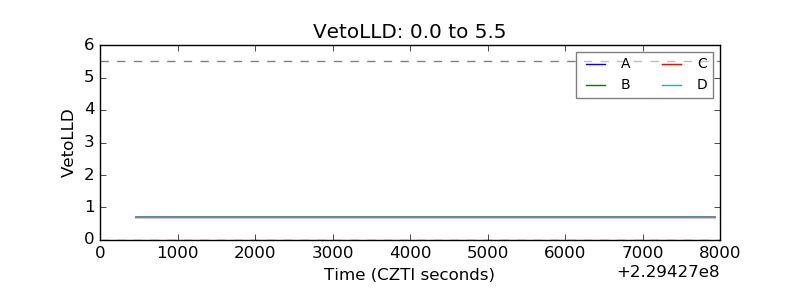 |
| Alpha Counter | 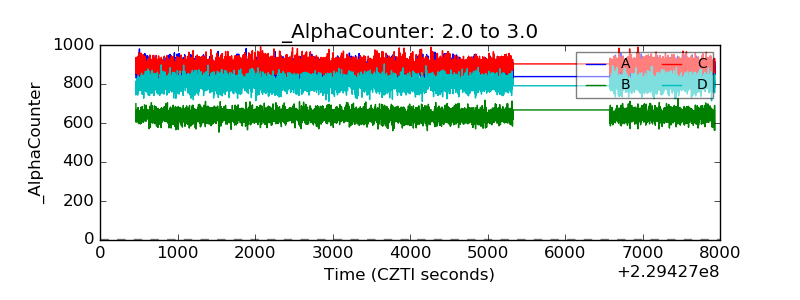 |
| _CPM_Rate | 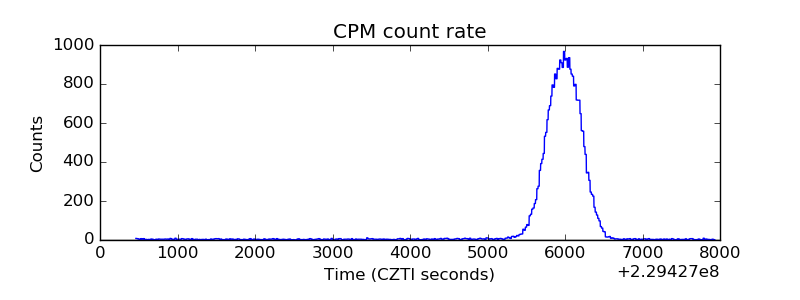 |
| CZT Counter | 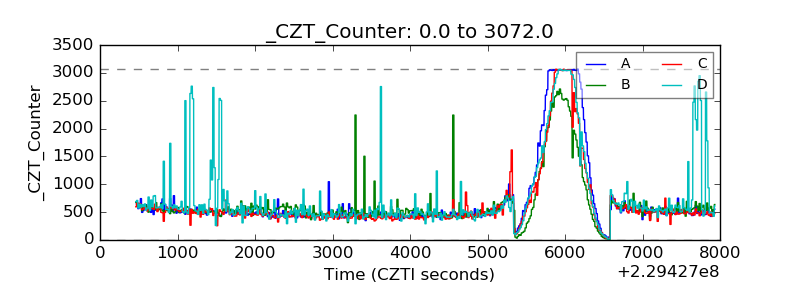 |
| +2.5 Volts monitor |  |
| +5 Volts monitor | 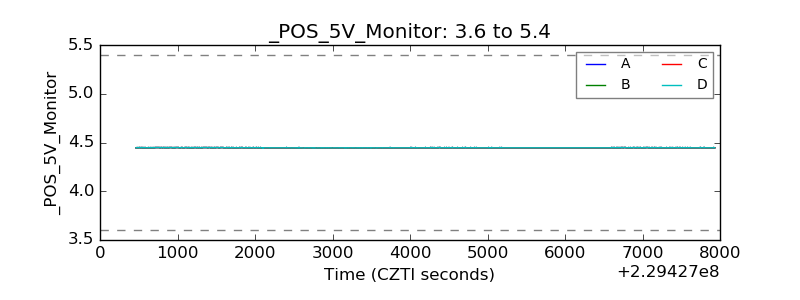 |
| _ROLL_ROT |  |
| _Roll_DEC | 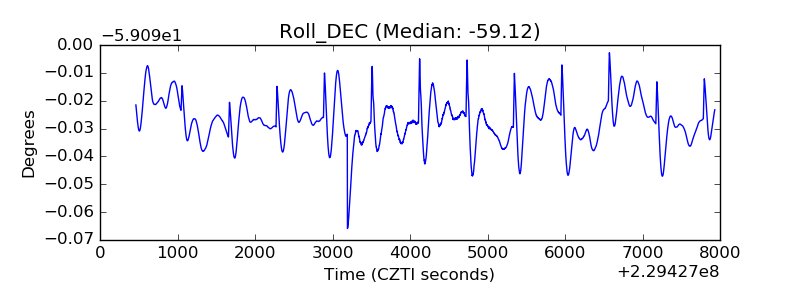 |
| _Roll_RA | 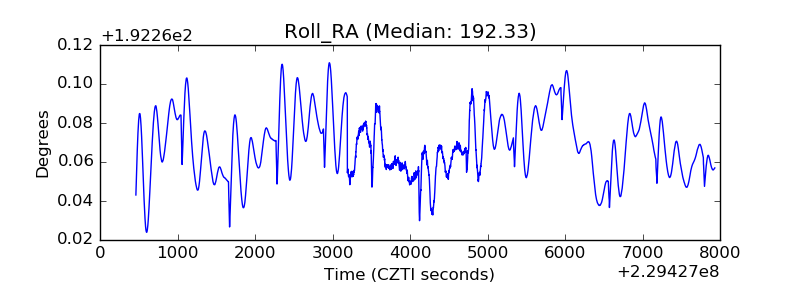 |
| Veto Counter | 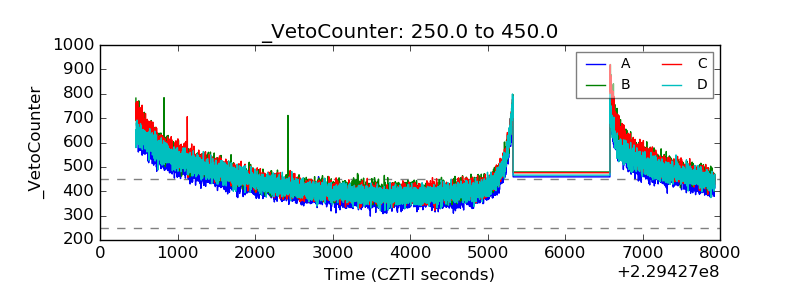 |