| Param | Original file | Final file |
|---|---|---|
| Filename | modeM0/AS1G07_065T02_9000001150_08285cztM0_level2.evt | modeM0/AS1G07_065T02_9000001150_08285cztM0_level2_quad_clean.evt |
| Size (bytes) | 198,659,520 | 54,918,720 |
| Size | 189.5 MB | 52.4 MB |
| Events in quadrant A | 1,288,913 | 367,908 |
| Events in quadrant B | 1,449,553 | 367,595 |
| Events in quadrant C | 1,282,570 | 357,537 |
| Events in quadrant D | 1,776,203 | 343,052 |
| Mode M0 | |||
|---|---|---|---|
| Quadrant | BADHDUFLAG | Total packets | Discarded packets |
| A | 0 | 6422 | 1 |
| B | 0 | 6722 | 0 |
| C | 0 | 6426 | 0 |
| D | 0 | 7690 | 0 |
| Mode SS | |||
|---|---|---|---|
| Quadrant | BADHDUFLAG | Total packets | Discarded packets |
| A | 0 | 64 | 0 |
| B | 0 | 64 | 0 |
| C | 0 | 64 | 0 |
| D | 0 | 64 | 0 |
| Quadrant | Total seconds | Saturated seconds | Saturation percentage |
|---|---|---|---|
| A | 3190 | 1 | 0.031348% |
| B | 3190 | 16 | 0.501567% |
| C | 3190 | 0 | 0.000000% |
| D | 3190 | 15 | 0.470219% |
Noise dominated data is calculated using 1-second bins in cleaned event files. If a bin has >2000 counts, and if more than 50% of those come from <1% of pixels, then it is considered to be noise-dominated and hence unusable.
| Quadrant | # 1 sec bins | Bins with >0 counts | Bins with >2000 counts | High rate bins dominated by noise | Noise dominated (total time) | Noise dominated (detector-on time) | Marked lightcurve |
|---|---|---|---|---|---|---|---|
| A | 3190 | 3190 | 0 | 0 | 0.00% | 0.00% | 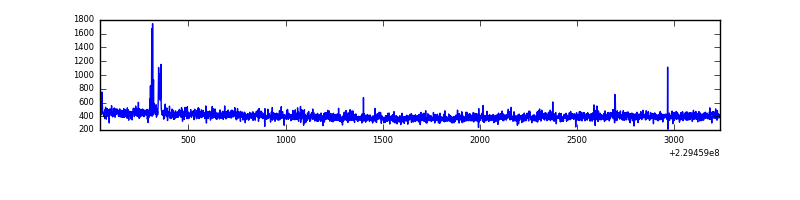 |
| B | 3190 | 3190 | 13 | 13 | 0.41% | 0.41% | 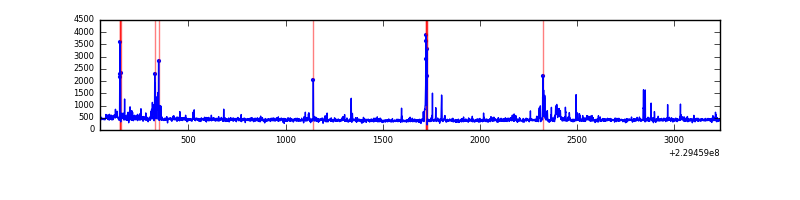 |
| C | 3190 | 3190 | 1 | 1 | 0.03% | 0.03% | 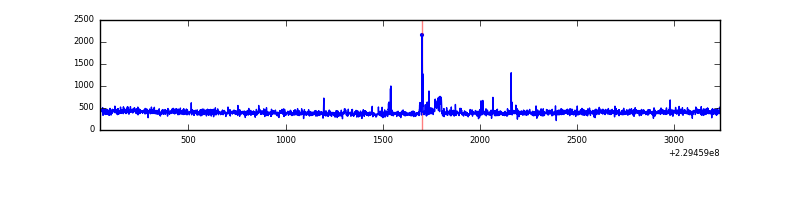 |
| D | 3190 | 3190 | 22 | 22 | 0.69% | 0.69% | 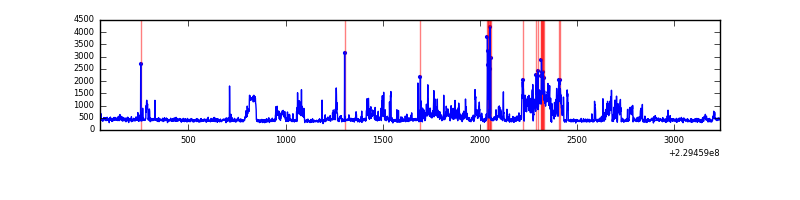 |
Top three noisy pixels from each quadrant. If the there are fewer than three noisy pixels in the level2.evt file, extra rows are filled as -1
| Pixel properties | Quadrant properties | ||||||
|---|---|---|---|---|---|---|---|
| Quadrant | DetID | PixID | Counts | Sigma | Mean | Median | Sigma |
| A | 0 | 254 | 15252 | 216.62 | 330 | 323 | 68.9 |
| A | 5 | 112 | 3148 | 40.99 | 330 | 323 | 68.9 |
| A | 0 | 226 | 3065 | 39.79 | 330 | 323 | 68.9 |
| B | 4 | 81 | 50229 | 767.23 | 334 | 326 | 65.0 |
| B | 11 | 51 | 27972 | 425.04 | 334 | 326 | 65.0 |
| B | 10 | 16 | 27032 | 410.59 | 334 | 326 | 65.0 |
| C | 10 | 9 | 14701 | 189.48 | 320 | 321 | 75.9 |
| C | 12 | 4 | 10525 | 134.46 | 320 | 321 | 75.9 |
| C | 9 | 54 | 8580 | 108.83 | 320 | 321 | 75.9 |
| D | 12 | 233 | 261257 | 3333.35 | 315 | 305 | 78.3 |
| D | 2 | 152 | 115291 | 1468.81 | 315 | 305 | 78.3 |
| D | 13 | 169 | 72233 | 918.79 | 315 | 305 | 78.3 |
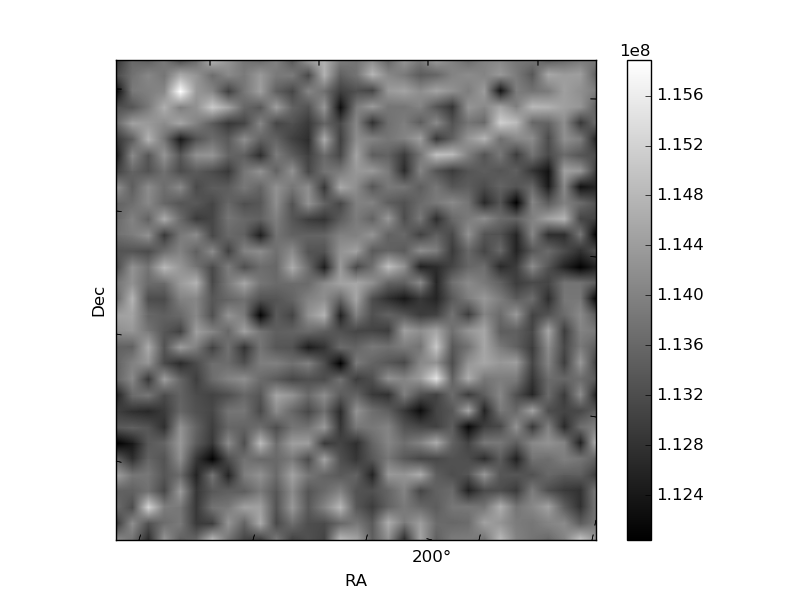
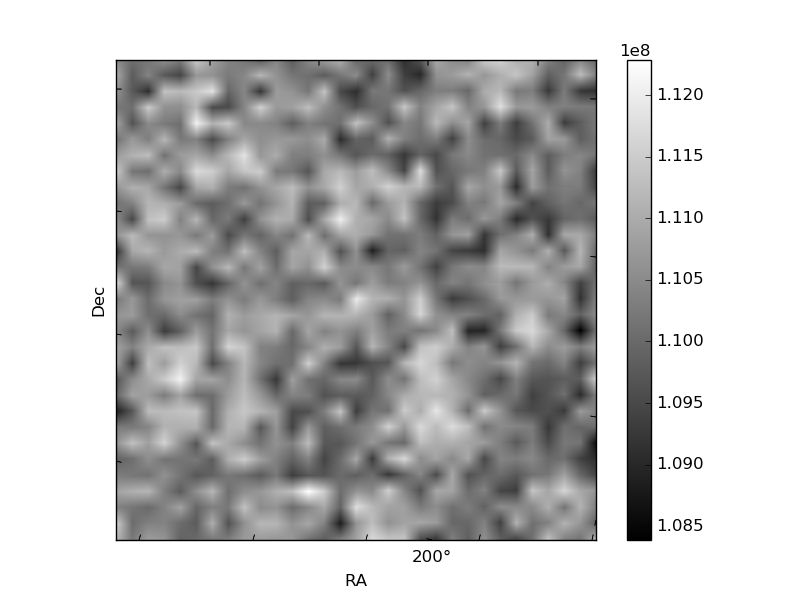
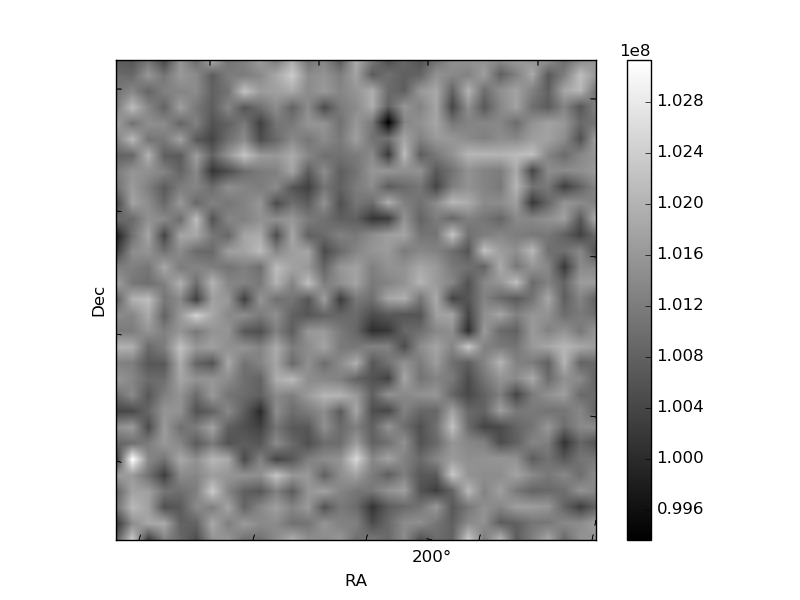
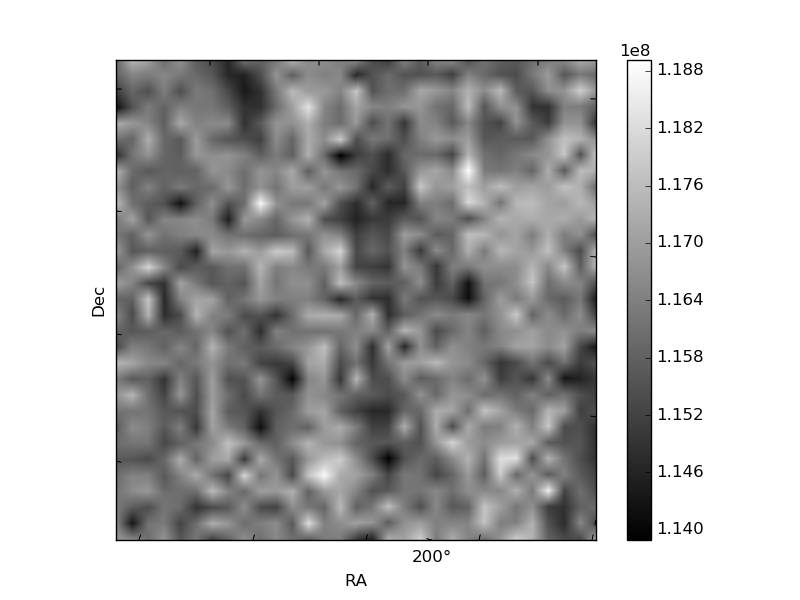
Histogram calculated using DETX and DETY for each event in the final _common_clean file
| Quadrant A | 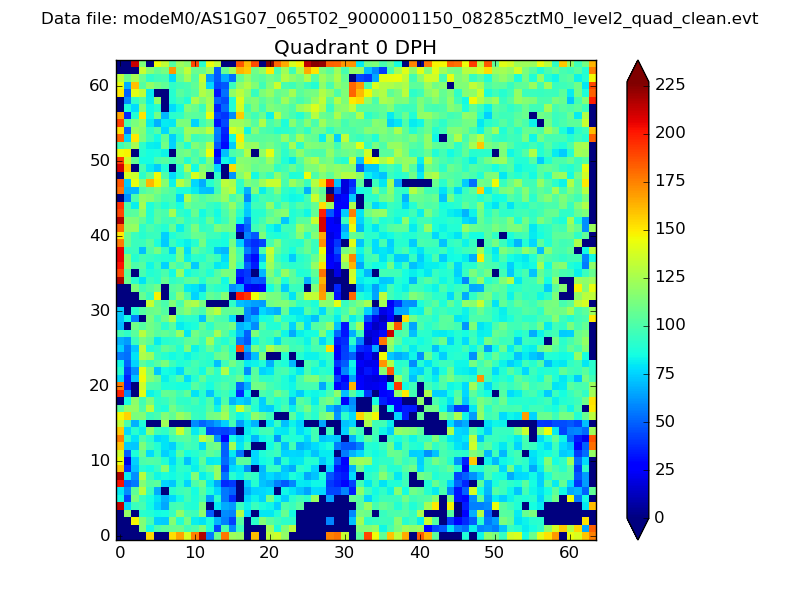 |
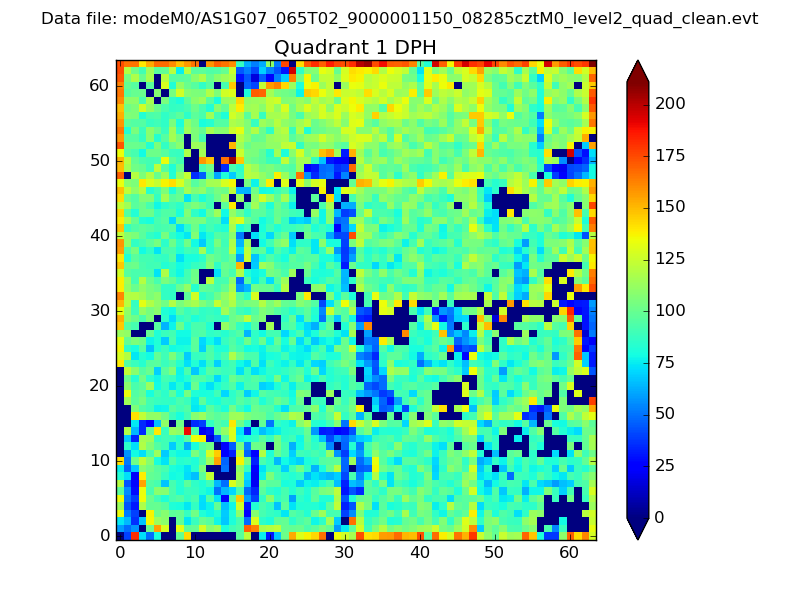 |
Quadrant B |
|---|---|---|---|
| Quadrant D | 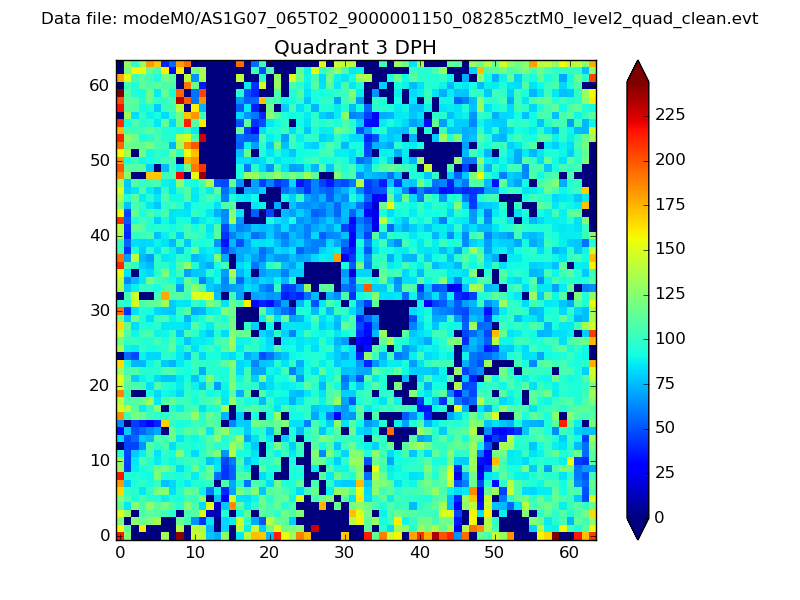 |
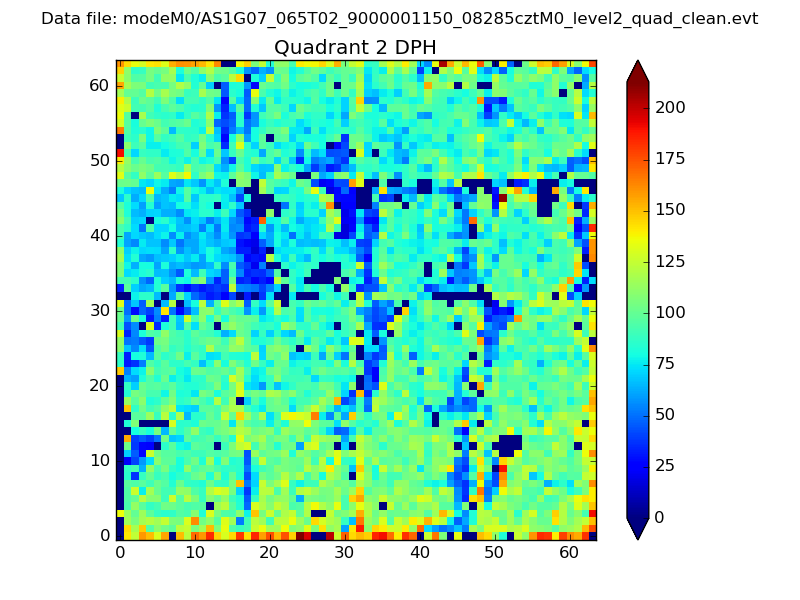 |
Quadrant C |
| Plot type | Count rate plots | Images |
|---|---|---|
| Comparison with Poisson distribution Blue bars denote a histogram of data divided into 1 sec bins. Red curve is a Poisson curve with rate = median count rate of data. |
 |
 |
| Quadrant-wise count rates Data is divided into 100 sec bins |
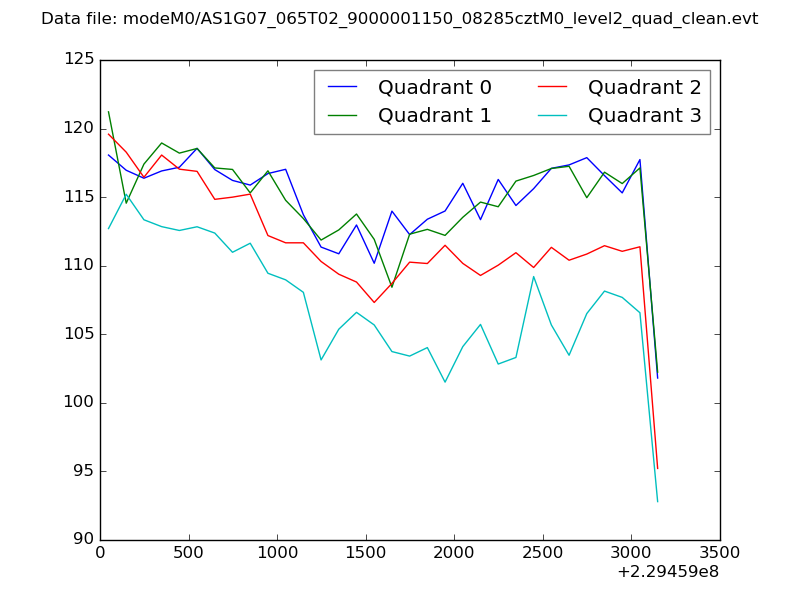 |
|
| Module-wise count rates for Quadrant A Data is divided into 100 sec bins |
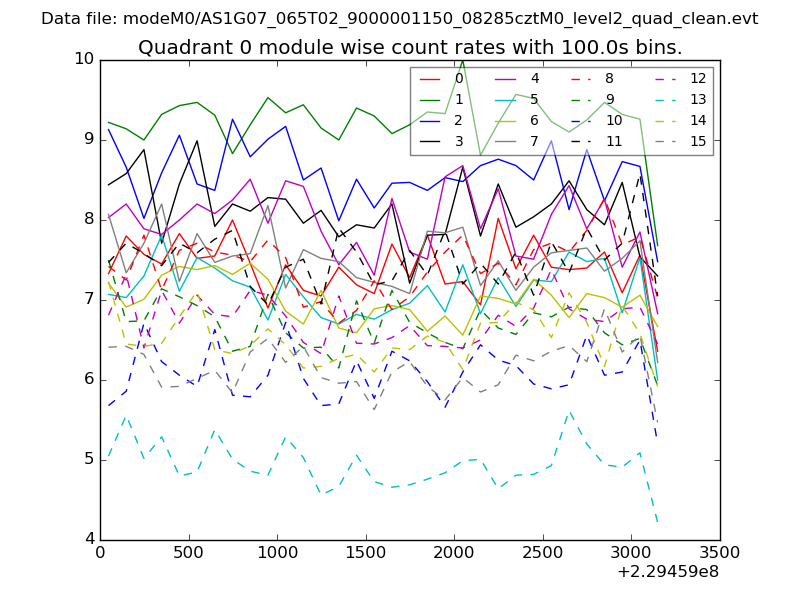 |
 |
| Module-wise count rates for Quadrant B Data is divided into 100 sec bins |
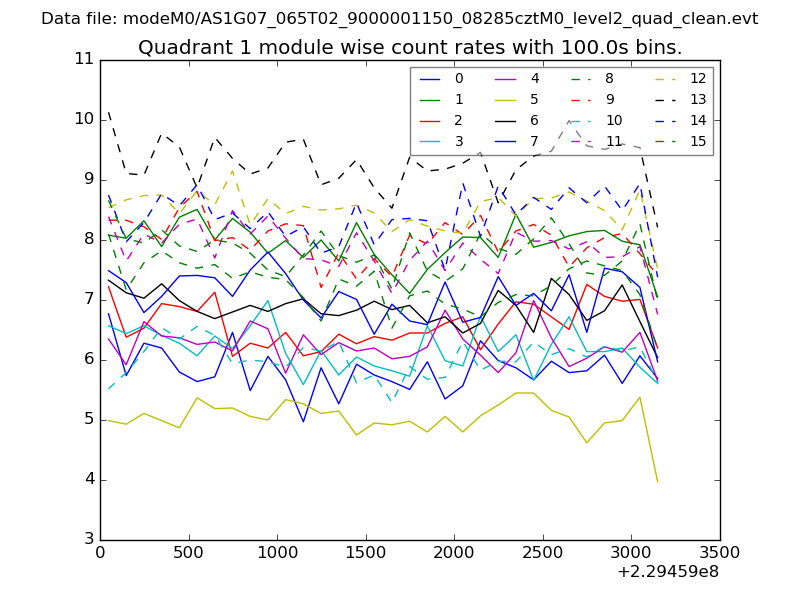 |
 |
| Module-wise count rates for Quadrant C Data is divided into 100 sec bins |
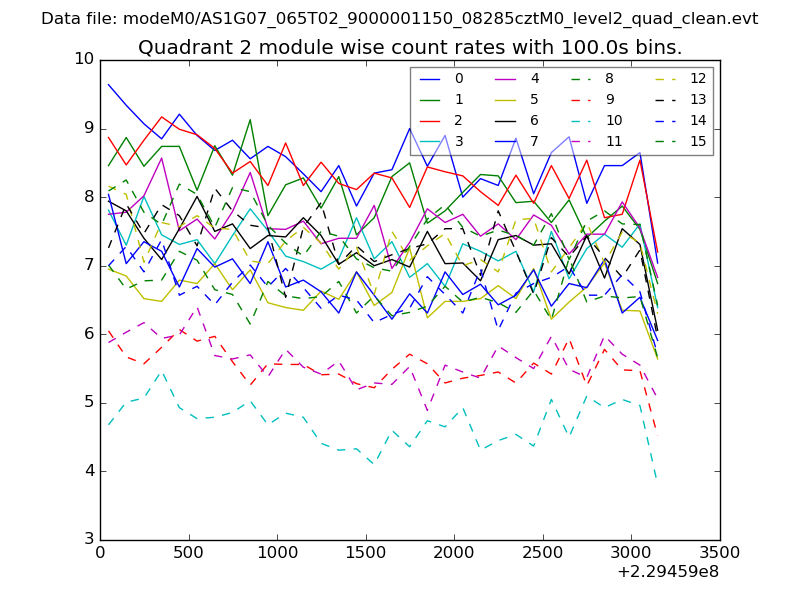 |
 |
| Module-wise count rates for Quadrant D Data is divided into 100 sec bins |
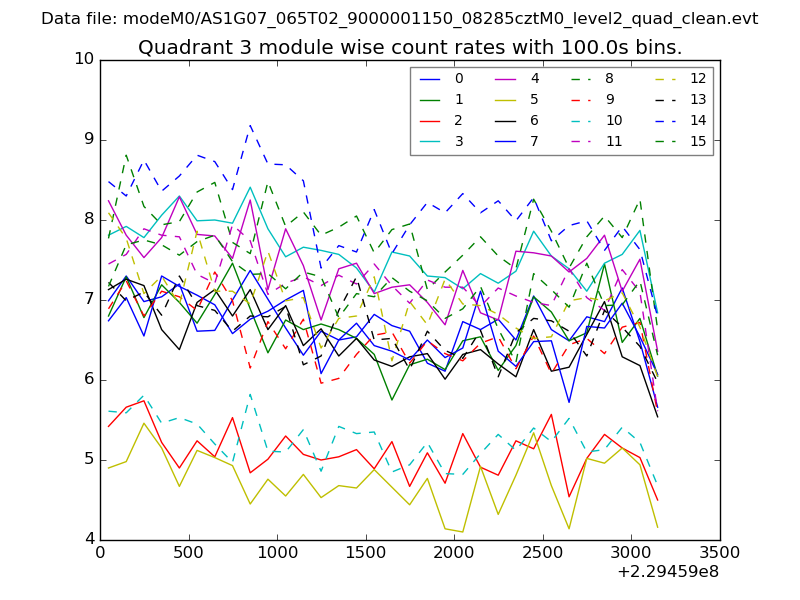 |
 |
| Parameter | Plot |
|---|---|
| CZT HV Monitor | 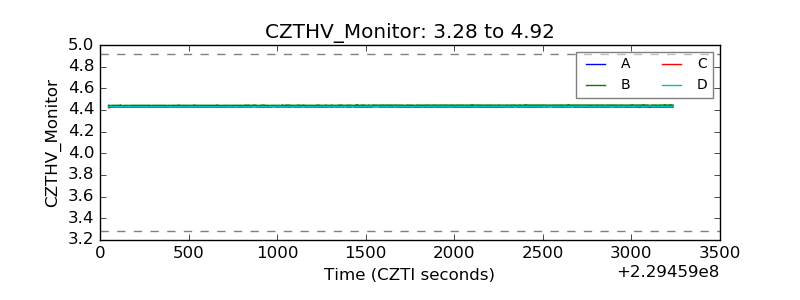 |
| D_VDD | 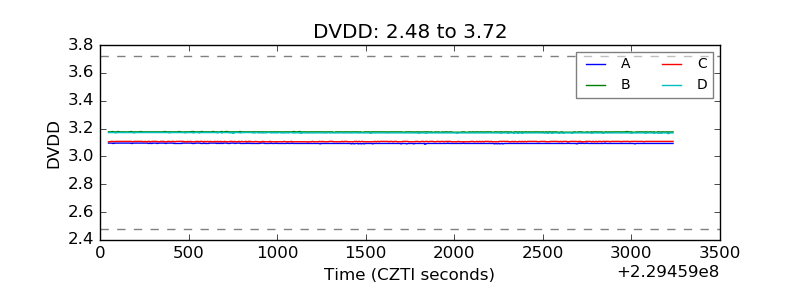 |
| Temperature 1 | 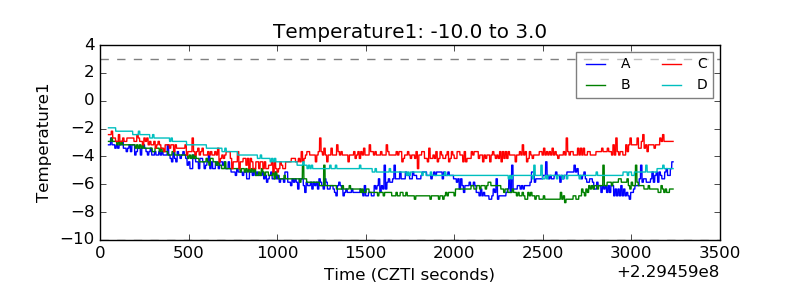 |
| Veto HV Monitor |  |
| Veto LLD | 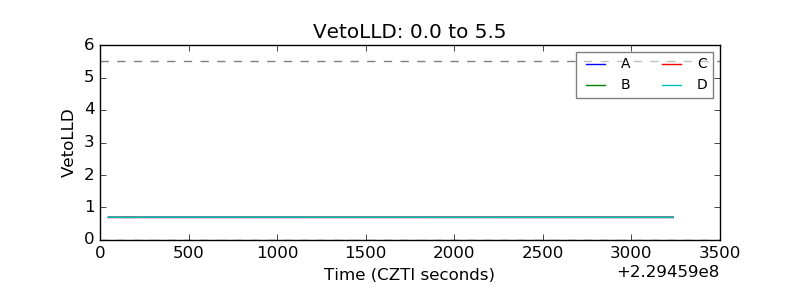 |
| Alpha Counter | 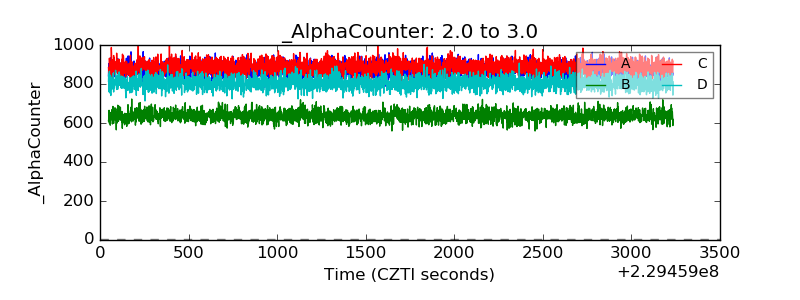 |
| _CPM_Rate | 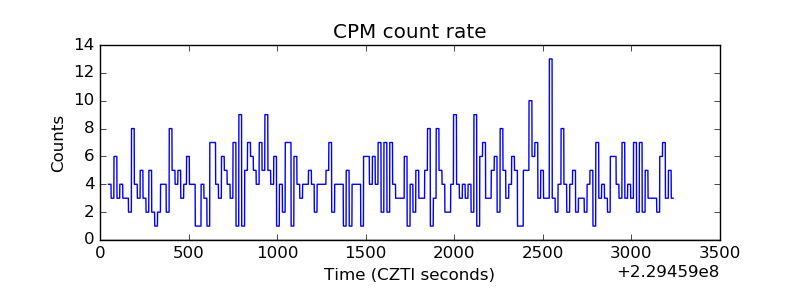 |
| CZT Counter | 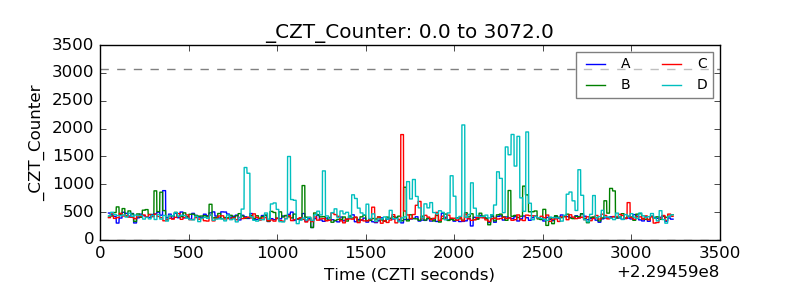 |
| +2.5 Volts monitor |  |
| +5 Volts monitor |  |
| _ROLL_ROT |  |
| _Roll_DEC |  |
| _Roll_RA | 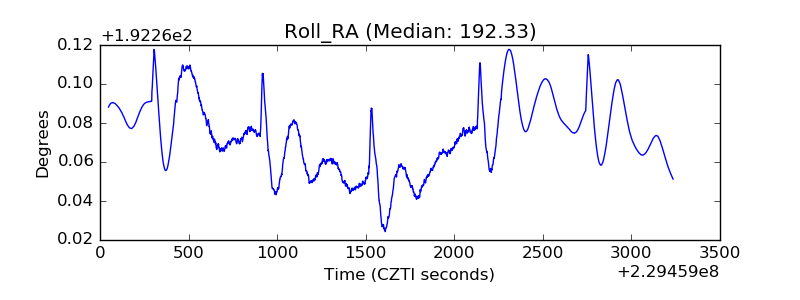 |
| Veto Counter | 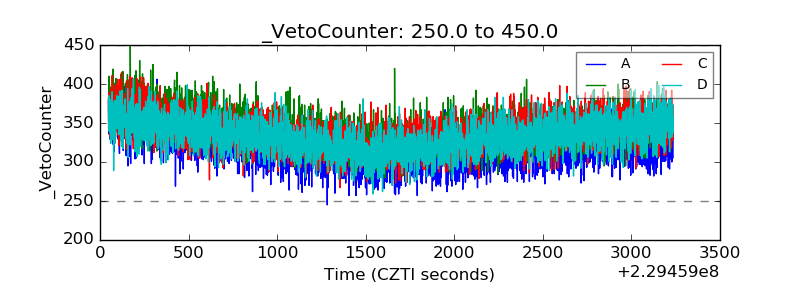 |