| Param | Original file | Final file |
|---|---|---|
| Filename | modeM0/AS1G07_065T02_9000001150_08287cztM0_level2.evt | modeM0/AS1G07_065T02_9000001150_08287cztM0_level2_quad_clean.evt |
| Size (bytes) | 282,692,160 | 50,757,120 |
| Size | 269.6 MB | 48.4 MB |
| Events in quadrant A | 1,965,218 | 312,685 |
| Events in quadrant B | 2,282,380 | 314,212 |
| Events in quadrant C | 1,945,565 | 310,352 |
| Events in quadrant D | 2,075,476 | 297,677 |
| Mode M9 | |||
|---|---|---|---|
| Quadrant | BADHDUFLAG | Total packets | Discarded packets |
| A | 0 | 2 | 0 |
| B | 0 | 2 | 0 |
| C | 0 | 2 | 0 |
| D | 0 | 2 | 0 |
| Mode M0 | |||
|---|---|---|---|
| Quadrant | BADHDUFLAG | Total packets | Discarded packets |
| A | 0 | 8751 | 2 |
| B | 0 | 9542 | 2 |
| C | 0 | 8731 | 2 |
| D | 0 | 9139 | 2 |
| Mode SS | |||
|---|---|---|---|
| Quadrant | BADHDUFLAG | Total packets | Discarded packets |
| A | 0 | 88 | 0 |
| B | 0 | 88 | 0 |
| C | 0 | 88 | 0 |
| D | 0 | 88 | 0 |
| Quadrant | Total seconds | Saturated seconds | Saturation percentage |
|---|---|---|---|
| A | 4284 | 15 | 0.350140% |
| B | 4284 | 56 | 1.307190% |
| C | 4284 | 6 | 0.140056% |
| D | 4284 | 35 | 0.816993% |
Noise dominated data is calculated using 1-second bins in cleaned event files. If a bin has >2000 counts, and if more than 50% of those come from <1% of pixels, then it is considered to be noise-dominated and hence unusable.
| Quadrant | # 1 sec bins | Bins with >0 counts | Bins with >2000 counts | High rate bins dominated by noise | Noise dominated (total time) | Noise dominated (detector-on time) | Marked lightcurve |
|---|---|---|---|---|---|---|---|
| A | 4554 | 4286 | 0 | 0 | 0.00% | 0.00% | 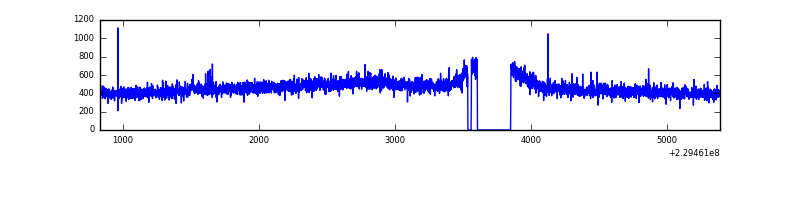 |
| B | 4554 | 4286 | 16 | 16 | 0.35% | 0.37% | 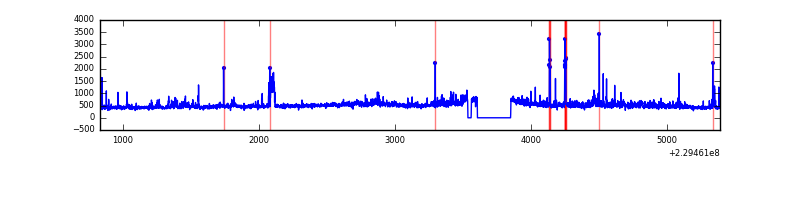 |
| C | 4554 | 4286 | 0 | 0 | 0.00% | 0.00% | 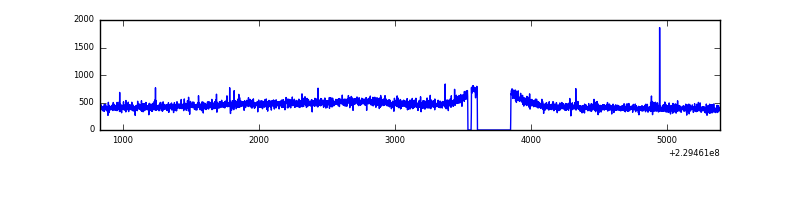 |
| D | 4554 | 4285 | 14 | 14 | 0.31% | 0.33% | 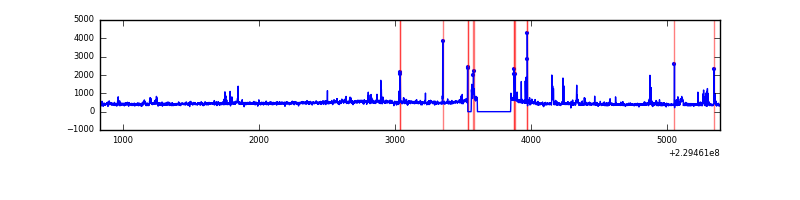 |
Top three noisy pixels from each quadrant. If the there are fewer than three noisy pixels in the level2.evt file, extra rows are filled as -1
| Pixel properties | Quadrant properties | ||||||
|---|---|---|---|---|---|---|---|
| Quadrant | DetID | PixID | Counts | Sigma | Mean | Median | Sigma |
| A | 0 | 226 | 4923 | 41.73 | 509 | 496 | 106.1 |
| A | 12 | 194 | 4411 | 36.91 | 509 | 496 | 106.1 |
| A | 5 | 112 | 3078 | 24.34 | 509 | 496 | 106.1 |
| B | 11 | 51 | 140776 | 1425.17 | 512 | 498 | 98.4 |
| B | 4 | 81 | 75253 | 759.48 | 512 | 498 | 98.4 |
| B | 0 | 214 | 36644 | 367.23 | 512 | 498 | 98.4 |
| C | 10 | 9 | 4525 | 34.63 | 497 | 498 | 116.3 |
| C | 13 | 61 | 3818 | 28.55 | 497 | 498 | 116.3 |
| C | 9 | 54 | 1503 | 8.64 | 497 | 498 | 116.3 |
| D | 7 | 71 | 52652 | 389.91 | 491 | 480 | 133.8 |
| D | 12 | 233 | 52645 | 389.86 | 491 | 480 | 133.8 |
| D | 1 | 52 | 26623 | 195.38 | 491 | 480 | 133.8 |
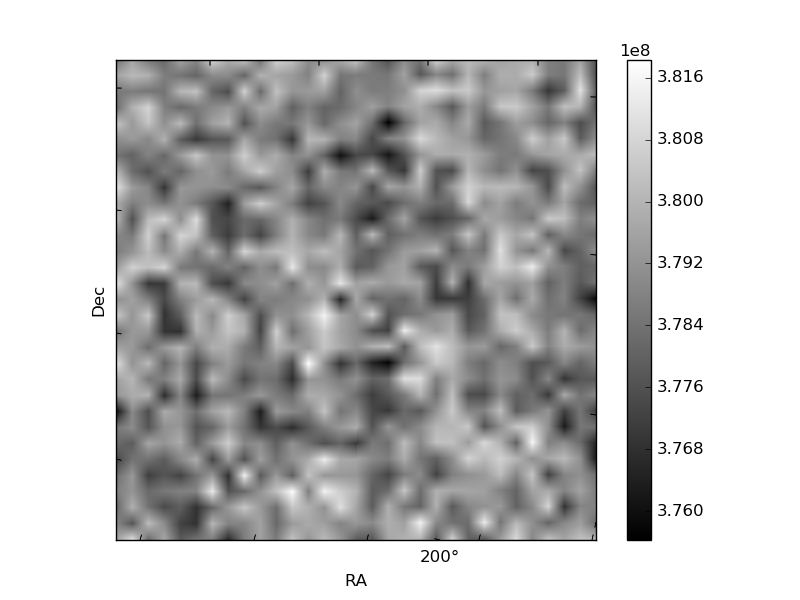
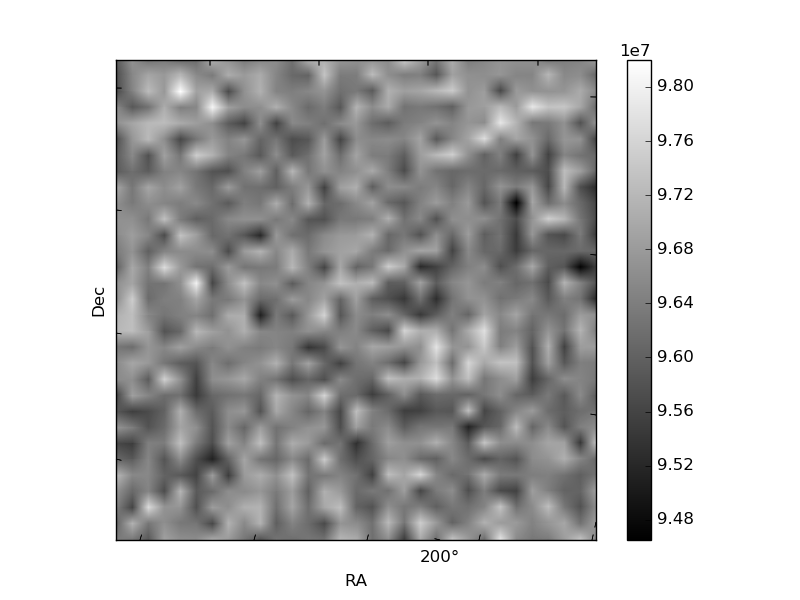
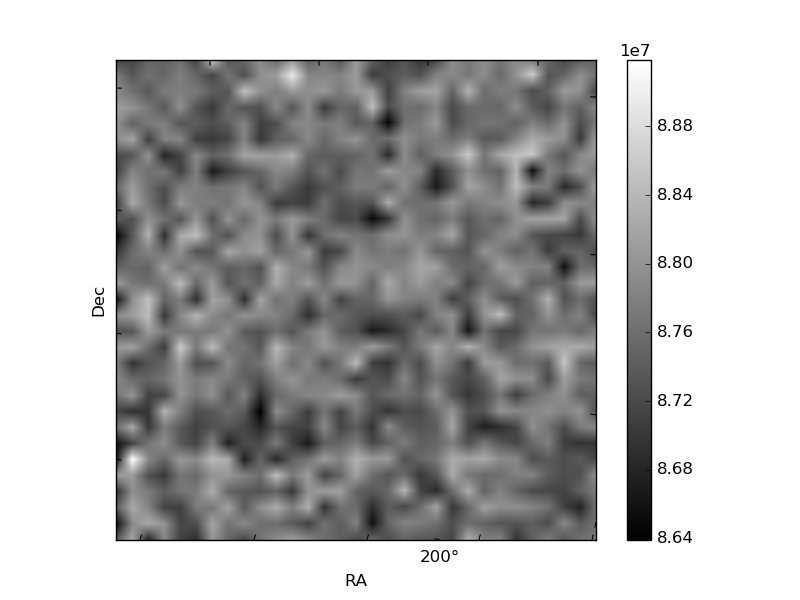
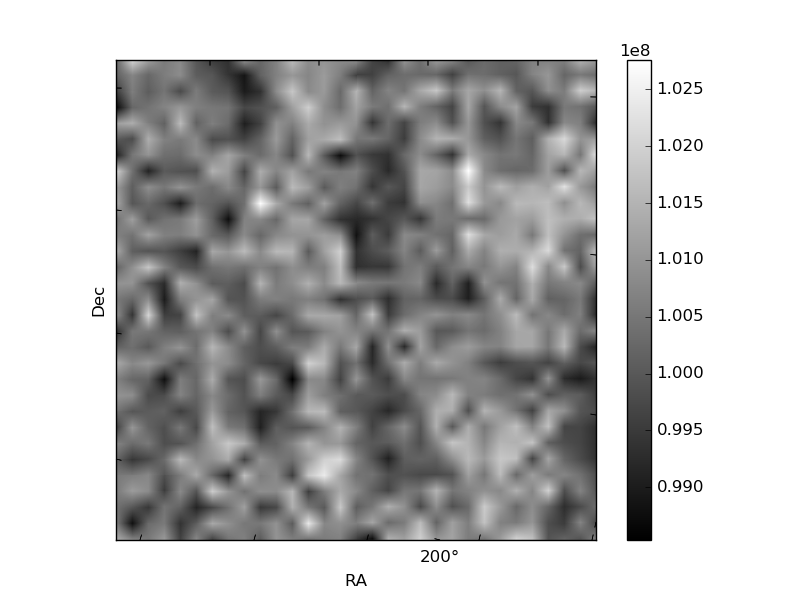
Histogram calculated using DETX and DETY for each event in the final _common_clean file
| Quadrant A | 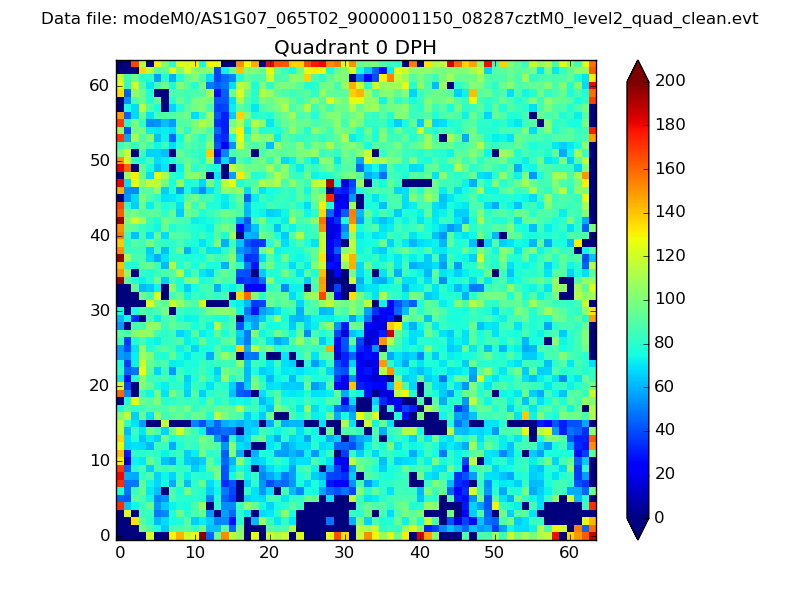 |
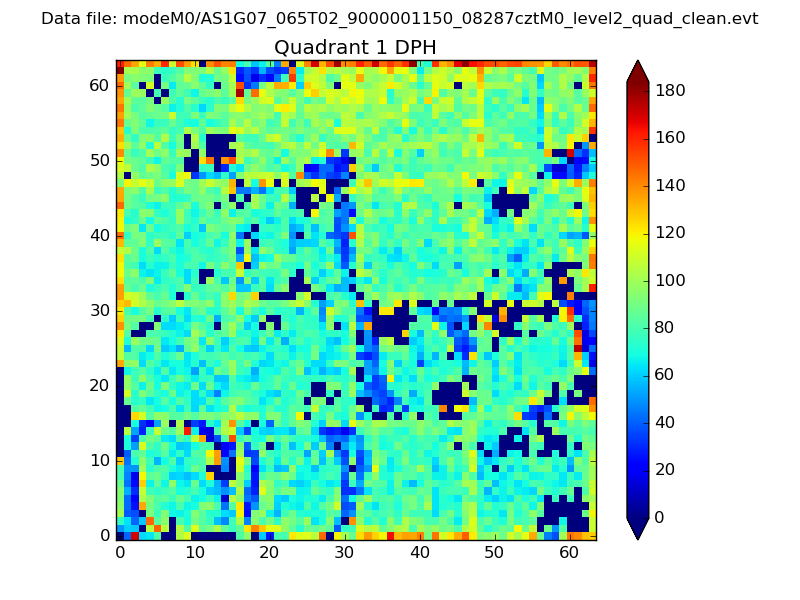 |
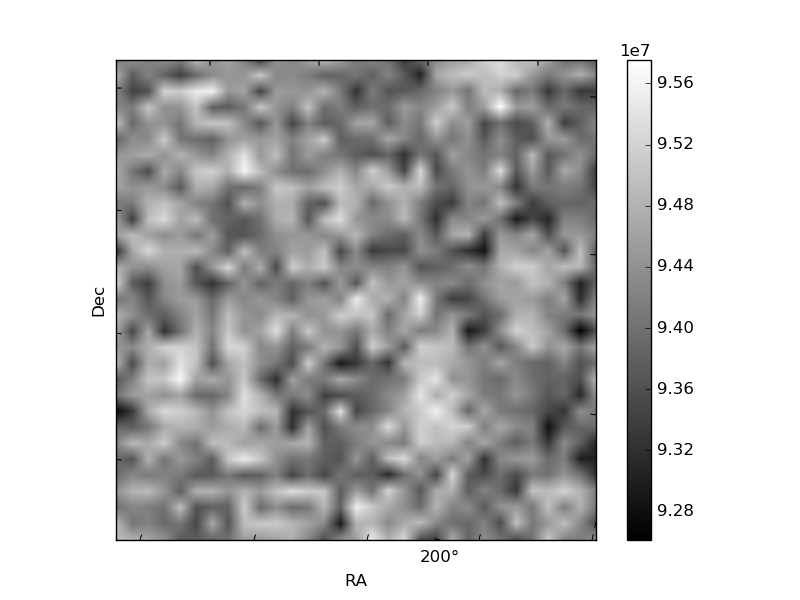
Quadrant B |
|---|---|---|---|
| Quadrant D | 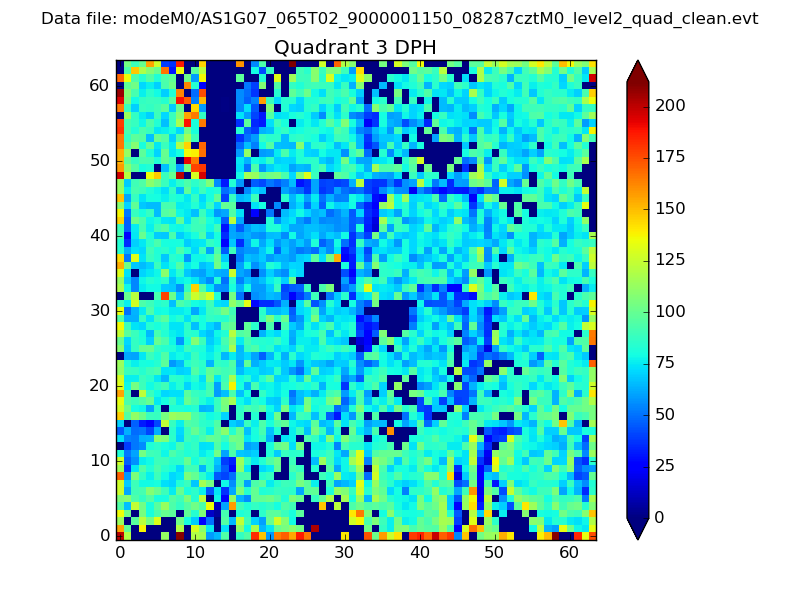 |
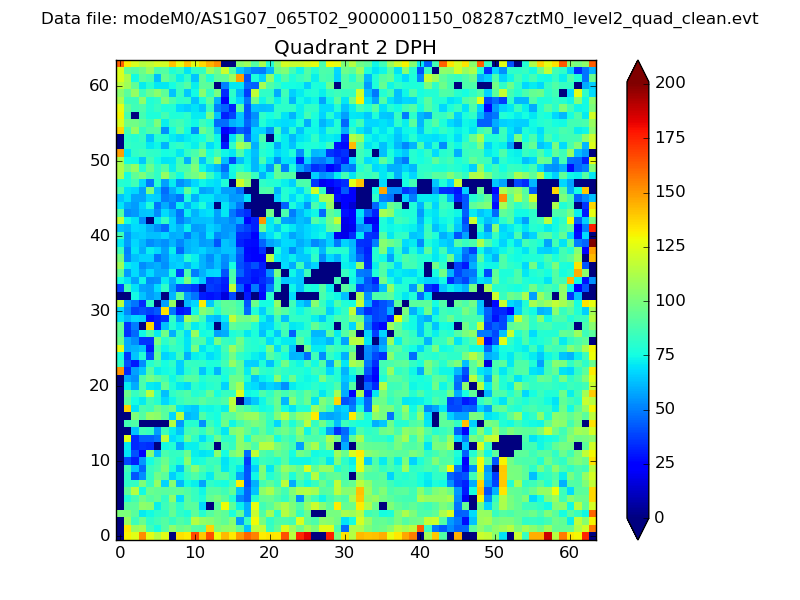 |
Quadrant C |
| Plot type | Count rate plots | Images |
|---|---|---|
| Comparison with Poisson distribution Blue bars denote a histogram of data divided into 1 sec bins. Red curve is a Poisson curve with rate = median count rate of data. |
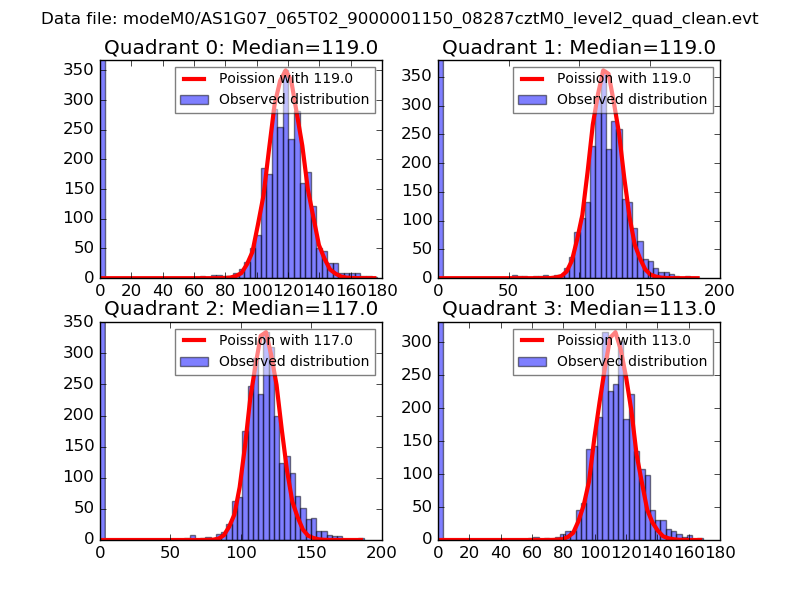 |
 |
| Quadrant-wise count rates Data is divided into 100 sec bins |
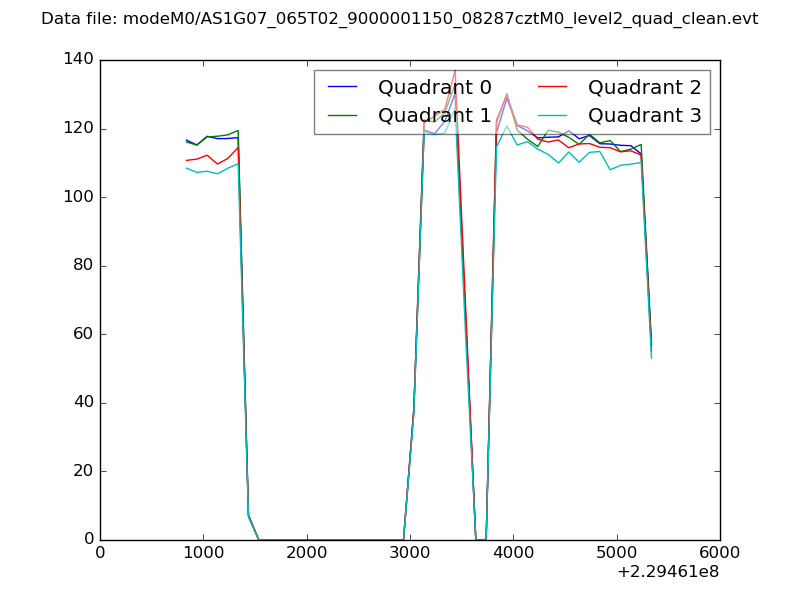 |
|
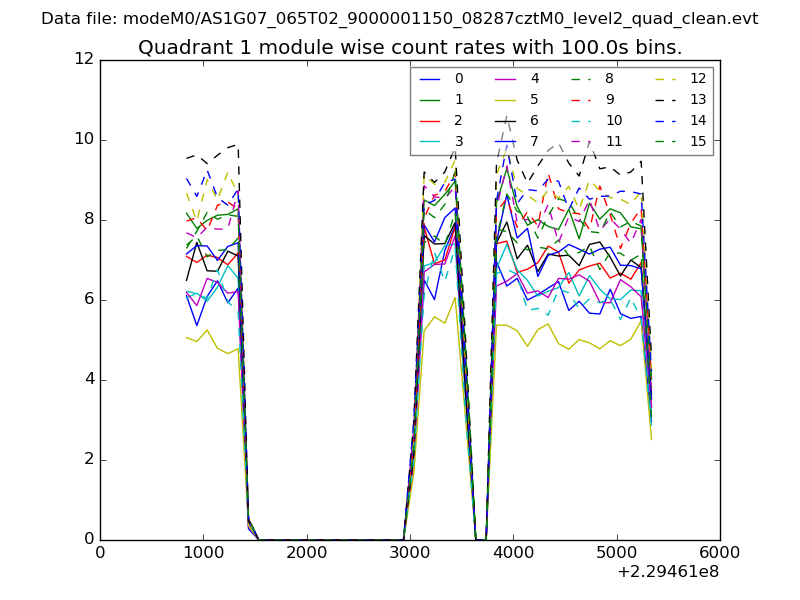
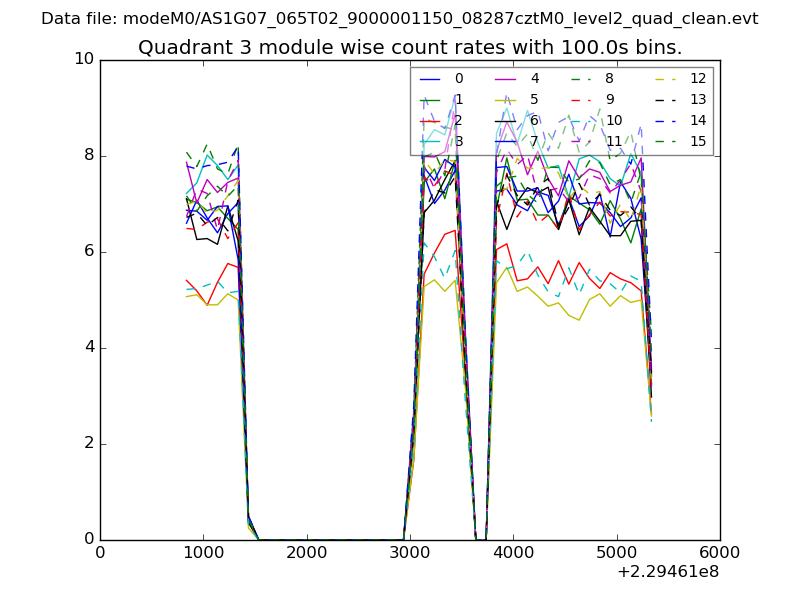
| Module-wise count rates for Quadrant A Data is divided into 100 sec bins |
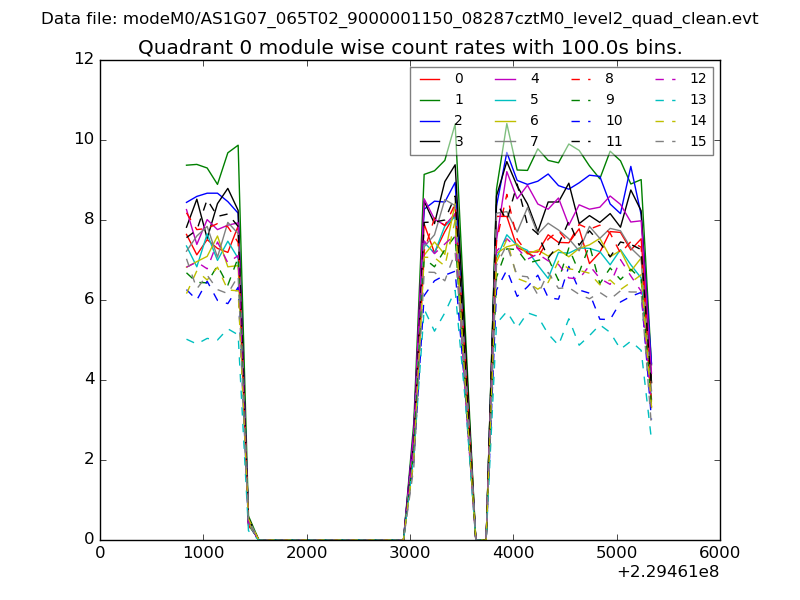 |
 |
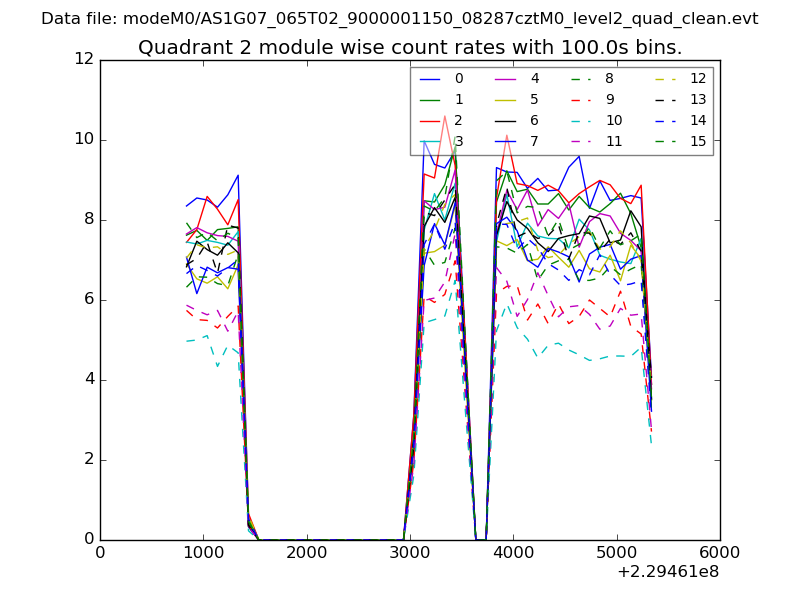
| Module-wise count rates for Quadrant B Data is divided into 100 sec bins |
 |
 |
| Module-wise count rates for Quadrant C Data is divided into 100 sec bins |
 |
 |
| Module-wise count rates for Quadrant D Data is divided into 100 sec bins |
 |
 |
| Parameter | Plot |
|---|---|
| CZT HV Monitor | 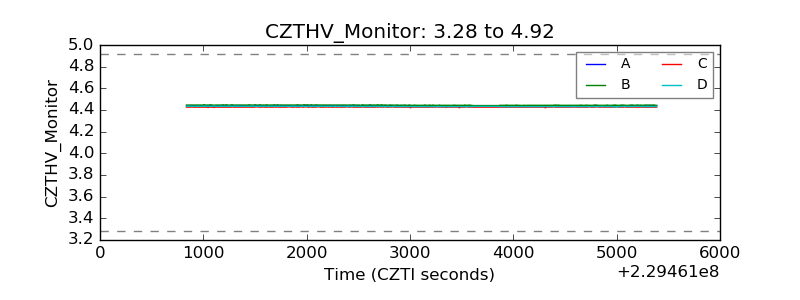 |
| D_VDD | 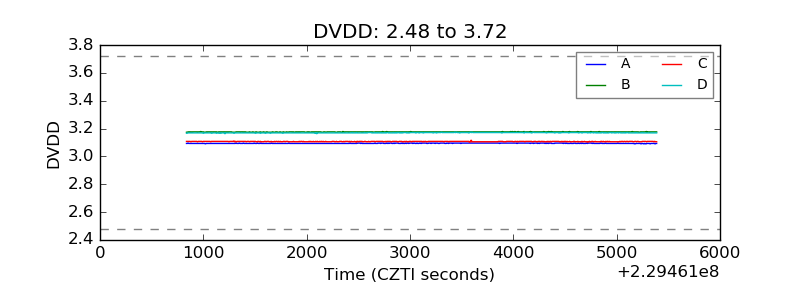 |
| Temperature 1 | 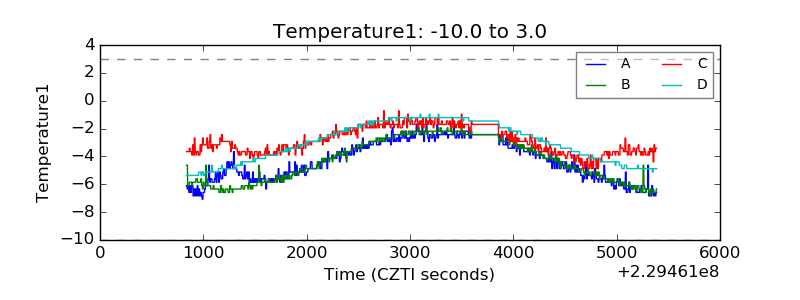 |
| Veto HV Monitor | 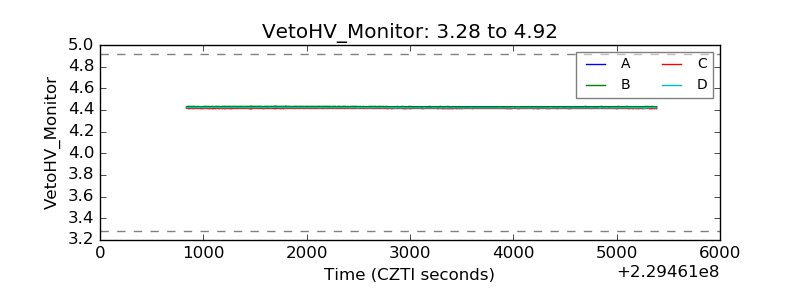 |
| Veto LLD | 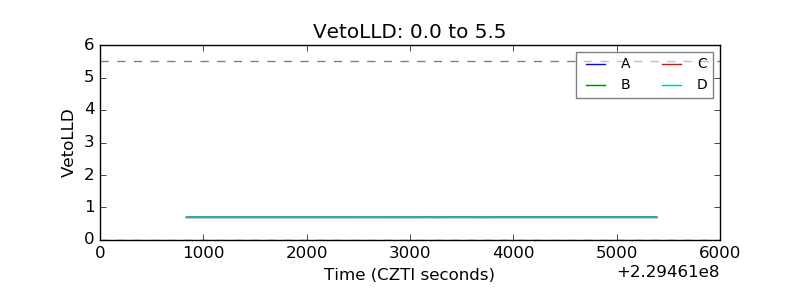 |
| Alpha Counter | 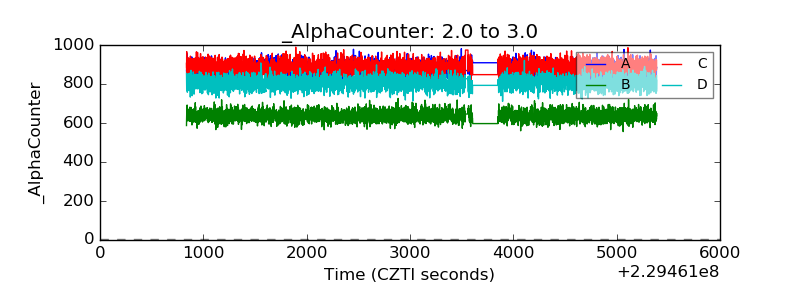 |
| _CPM_Rate | 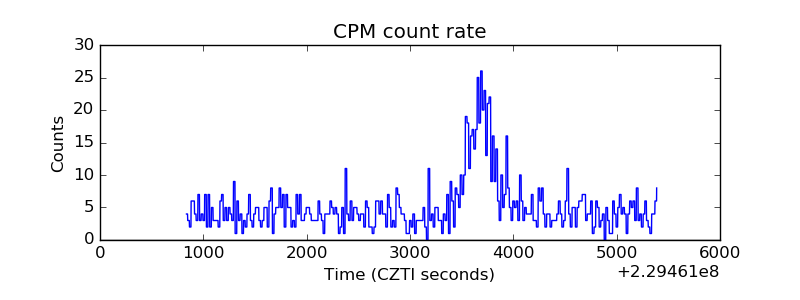 |
| CZT Counter | 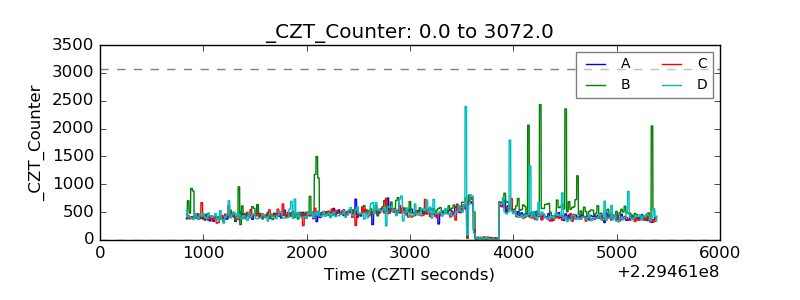 |
| +2.5 Volts monitor | 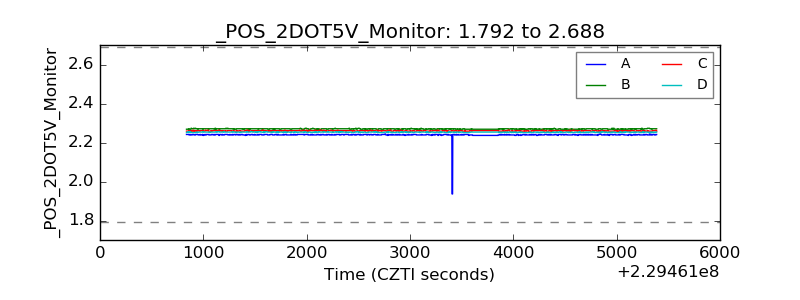 |
| +5 Volts monitor |  |
| _ROLL_ROT |  |
| _Roll_DEC | 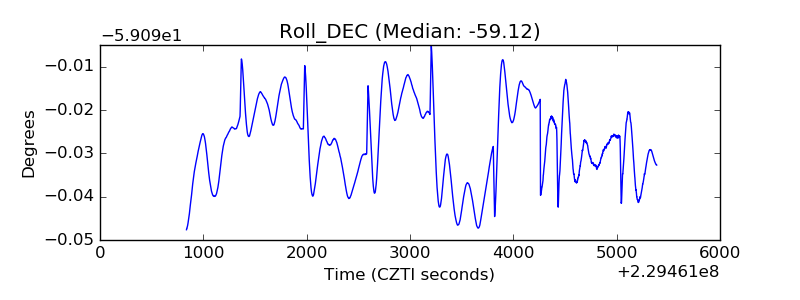 |
| _Roll_RA | 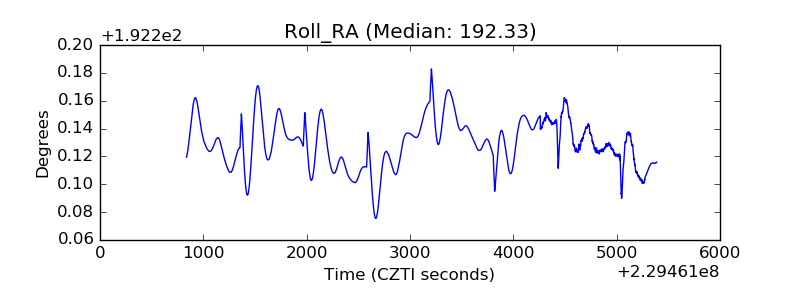 |
| Veto Counter | 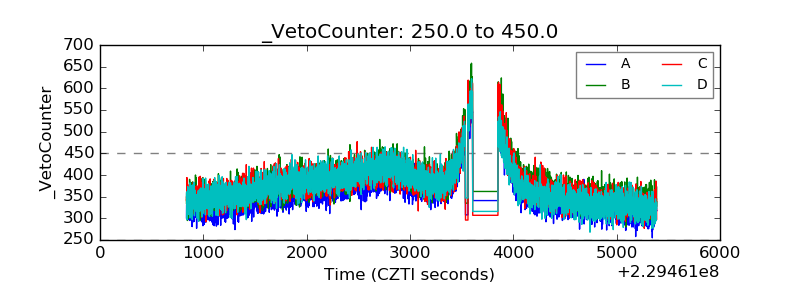 |