| Param | Original file | Final file |
|---|---|---|
| Filename | modeM0/AS1T01_163T01_9000001152_08288cztM0_level2.evt | modeM0/AS1T01_163T01_9000001152_08288cztM0_level2_quad_clean.evt |
| Size (bytes) | 426,484,800 | 60,724,800 |
| Size | 406.7 MB | 57.9 MB |
| Events in quadrant A | 3,561,680 | 331,381 |
| Events in quadrant B | 3,111,023 | 360,883 |
| Events in quadrant C | 2,883,973 | 355,660 |
| Events in quadrant D | 2,923,384 | 343,326 |
| Mode M9 | |||
|---|---|---|---|
| Quadrant | BADHDUFLAG | Total packets | Discarded packets |
| A | 0 | 9 | 0 |
| B | 0 | 9 | 0 |
| C | 0 | 9 | 0 |
| D | 0 | 9 | 0 |
| Mode M0 | |||
|---|---|---|---|
| Quadrant | BADHDUFLAG | Total packets | Discarded packets |
| A | 0 | 14943 | 2 |
| B | 0 | 13227 | 1 |
| C | 0 | 13052 | 1 |
| D | 0 | 13329 | 1 |
| Mode SS | |||
|---|---|---|---|
| Quadrant | BADHDUFLAG | Total packets | Discarded packets |
| A | 0 | 132 | 0 |
| B | 0 | 132 | 0 |
| C | 0 | 132 | 0 |
| D | 0 | 132 | 0 |
| Quadrant | Total seconds | Saturated seconds | Saturation percentage |
|---|---|---|---|
| A | 6401 | 311 | 4.858616% |
| B | 6401 | 42 | 0.656147% |
| C | 6401 | 11 | 0.171848% |
| D | 6401 | 13 | 0.203093% |
Noise dominated data is calculated using 1-second bins in cleaned event files. If a bin has >2000 counts, and if more than 50% of those come from <1% of pixels, then it is considered to be noise-dominated and hence unusable.
| Quadrant | # 1 sec bins | Bins with >0 counts | Bins with >2000 counts | High rate bins dominated by noise | Noise dominated (total time) | Noise dominated (detector-on time) | Marked lightcurve |
|---|---|---|---|---|---|---|---|
| A | 7351 | 6402 | 274 | 274 | 3.73% | 4.28% | 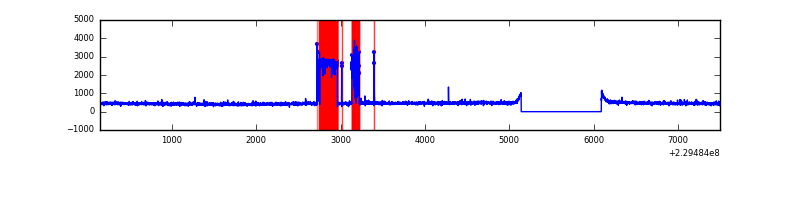 |
| B | 7351 | 6402 | 4 | 4 | 0.05% | 0.06% | 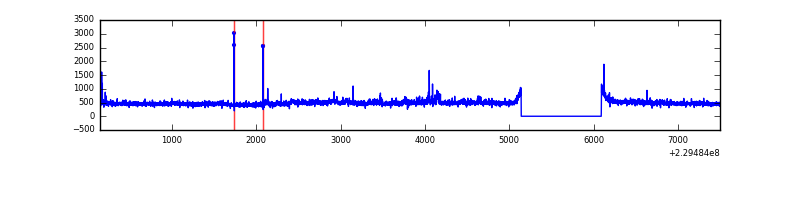 |
| C | 7351 | 6402 | 1 | 1 | 0.01% | 0.02% | 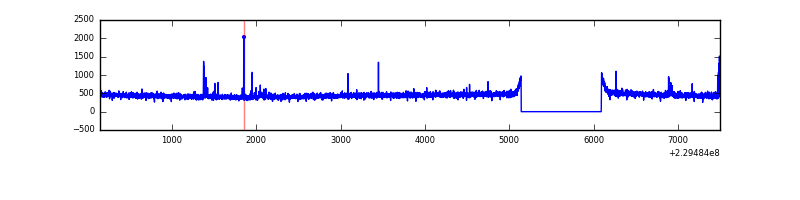 |
| D | 7351 | 6402 | 6 | 6 | 0.08% | 0.09% | 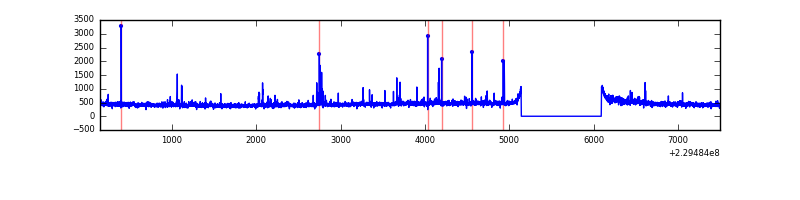 |
Top three noisy pixels from each quadrant. If the there are fewer than three noisy pixels in the level2.evt file, extra rows are filled as -1
| Pixel properties | Quadrant properties | ||||||
|---|---|---|---|---|---|---|---|
| Quadrant | DetID | PixID | Counts | Sigma | Mean | Median | Sigma |
| A | 0 | 254 | 767381 | 5140.78 | 725 | 709 | 149.1 |
| A | 0 | 226 | 6890 | 41.45 | 725 | 709 | 149.1 |
| A | 12 | 194 | 6453 | 38.52 | 725 | 709 | 149.1 |
| B | 0 | 198 | 82799 | 562.07 | 757 | 739 | 146.0 |
| B | 0 | 214 | 45036 | 303.41 | 757 | 739 | 146.0 |
| B | 10 | 16 | 19669 | 129.66 | 757 | 739 | 146.0 |
| C | 9 | 54 | 47989 | 278.29 | 726 | 731 | 169.8 |
| C | 13 | 61 | 5555 | 28.4 | 726 | 731 | 169.8 |
| C | 5 | 128 | 2424 | 9.97 | 726 | 731 | 169.8 |
| D | 8 | 230 | 47826 | 241.92 | 719 | 705 | 194.8 |
| D | 12 | 233 | 39816 | 200.8 | 719 | 705 | 194.8 |
| D | 7 | 71 | 27295 | 136.51 | 719 | 705 | 194.8 |
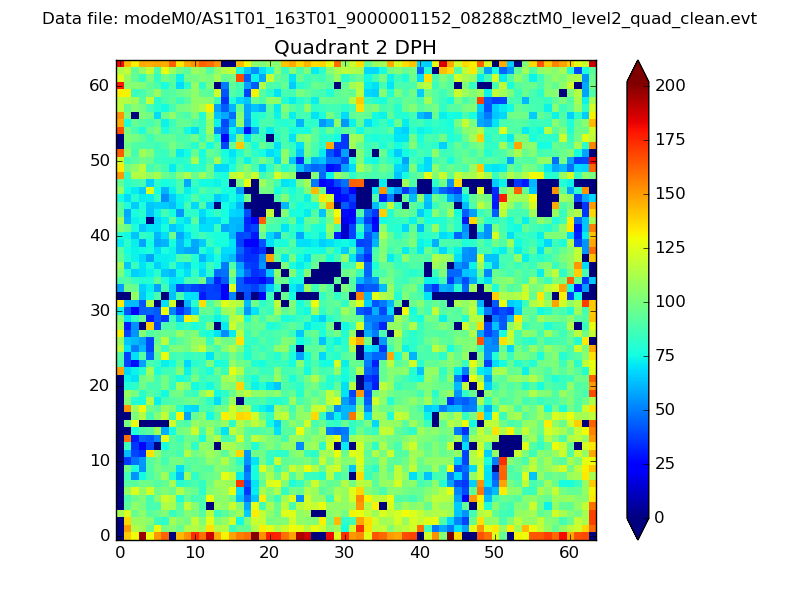
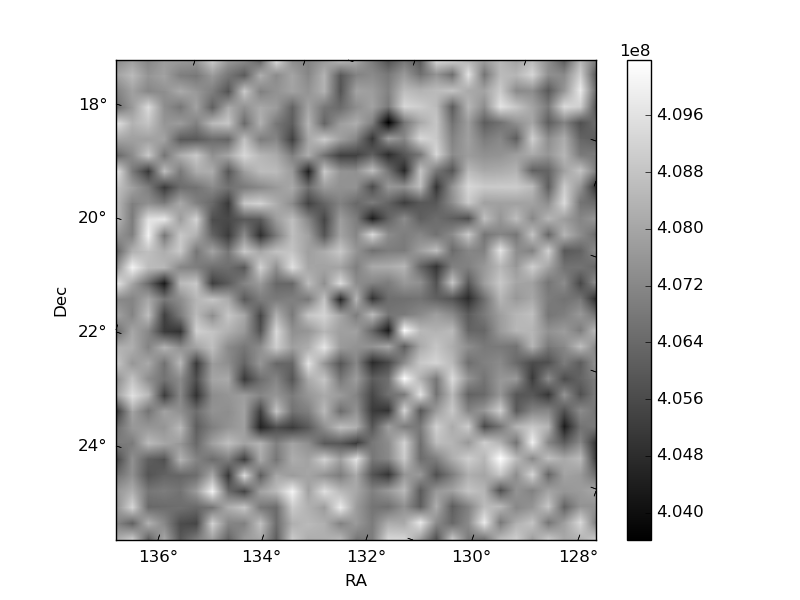
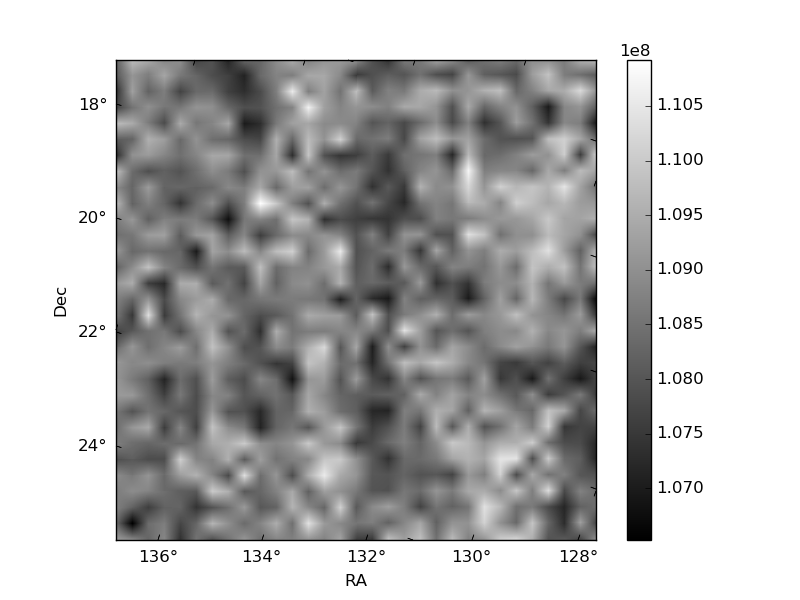
Histogram calculated using DETX and DETY for each event in the final _common_clean file
| Quadrant A | 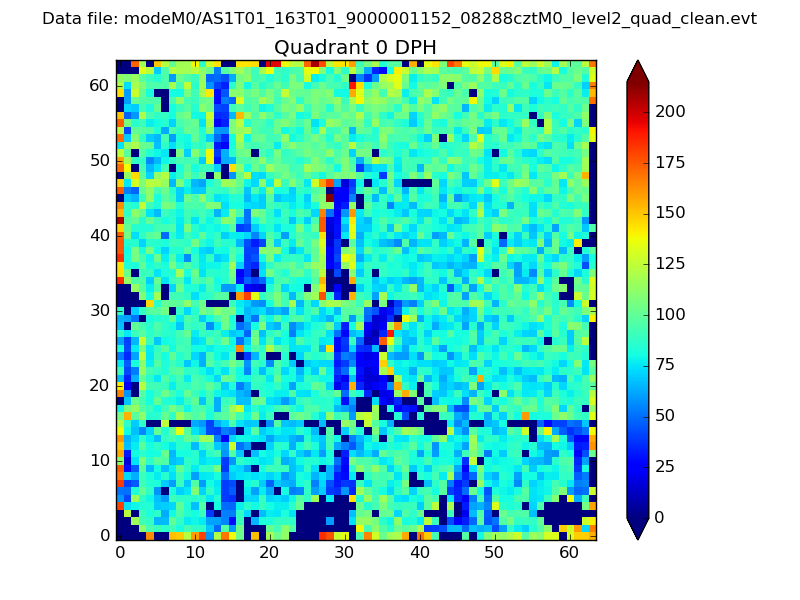 |
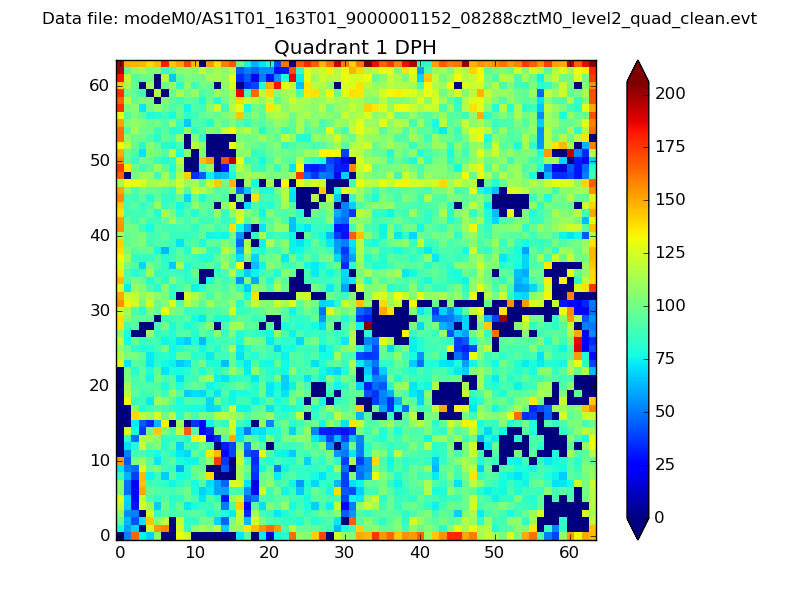 |
Quadrant B |
|---|---|---|---|
| Quadrant D | 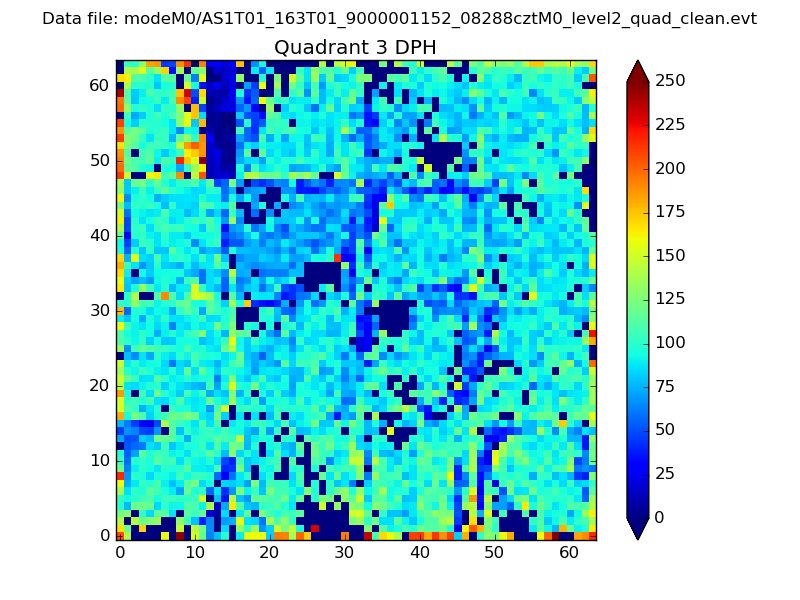 |
 |
Quadrant C |
| Plot type | Count rate plots | Images |
|---|---|---|
| Comparison with Poisson distribution Blue bars denote a histogram of data divided into 1 sec bins. Red curve is a Poisson curve with rate = median count rate of data. |
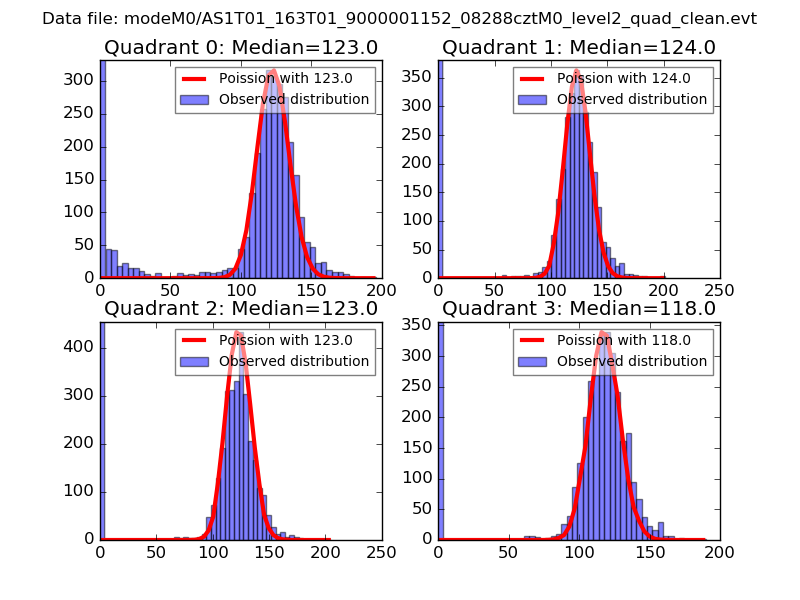 |
 |
| Quadrant-wise count rates Data is divided into 100 sec bins |
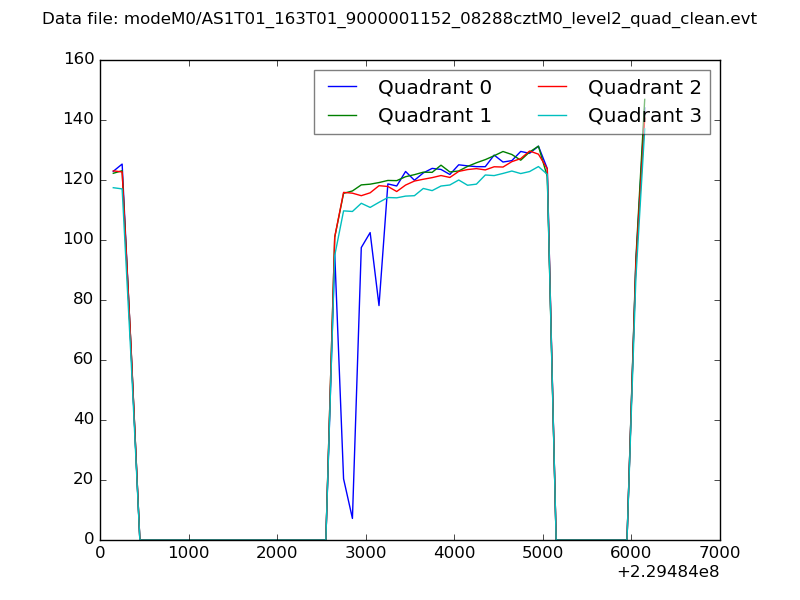 |
|
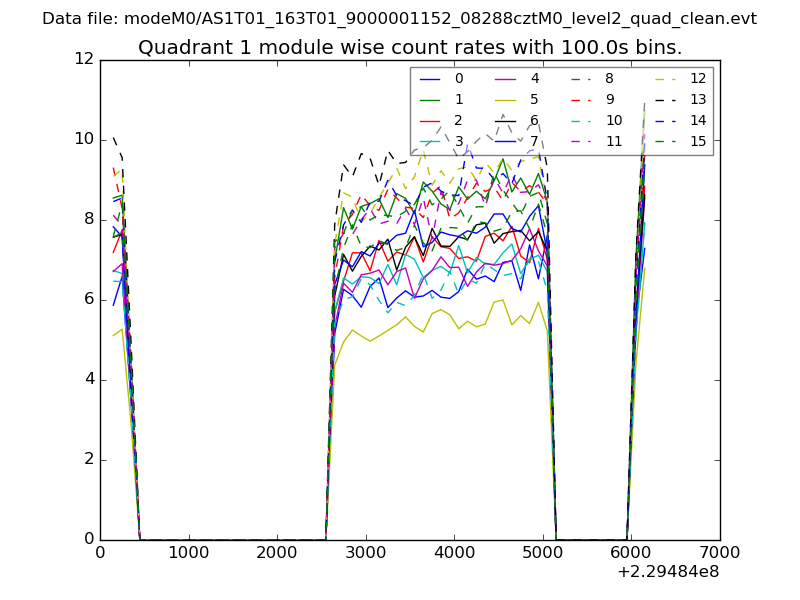
| Module-wise count rates for Quadrant A Data is divided into 100 sec bins |
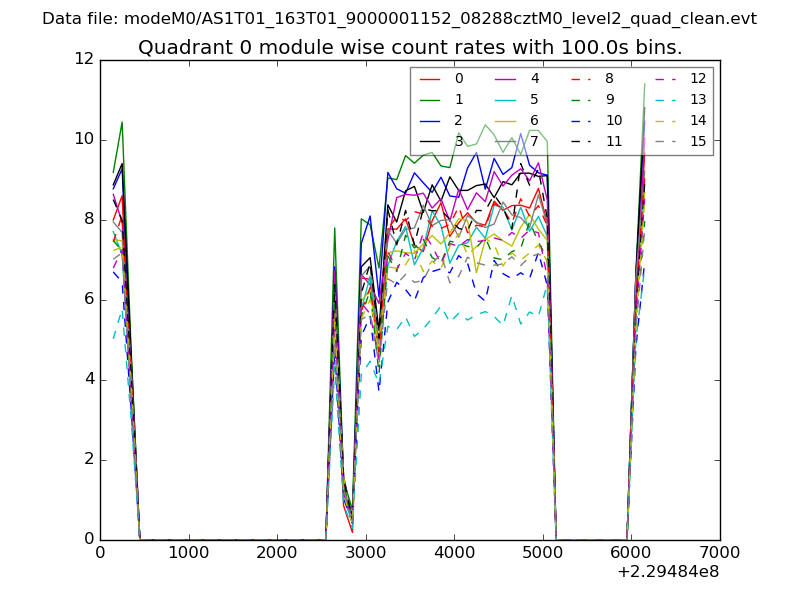 |
 |
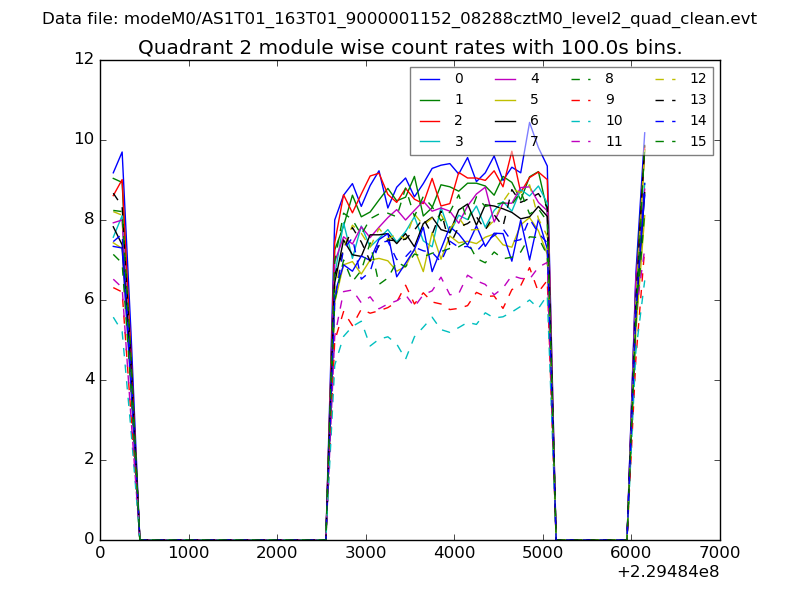
| Module-wise count rates for Quadrant B Data is divided into 100 sec bins |
 |
 |
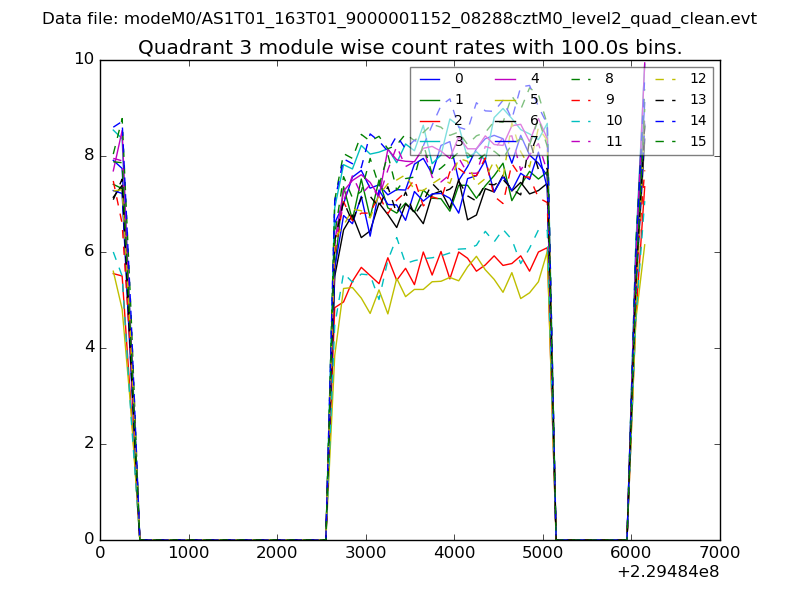
| Module-wise count rates for Quadrant C Data is divided into 100 sec bins |
 |
 |
| Module-wise count rates for Quadrant D Data is divided into 100 sec bins |
 |
 |
| Parameter | Plot |
|---|---|
| CZT HV Monitor | 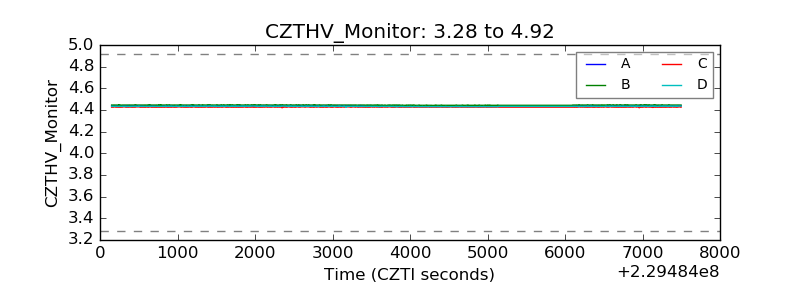 |
| D_VDD | 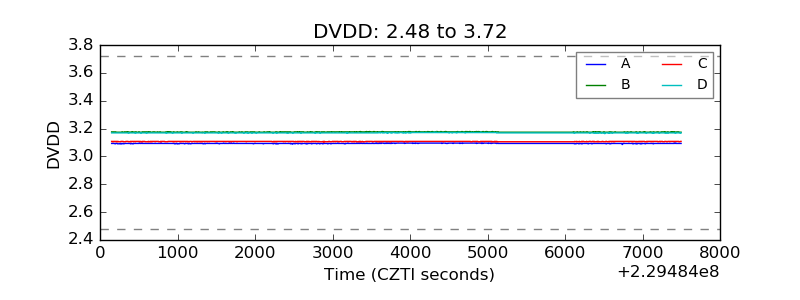 |
| Temperature 1 | 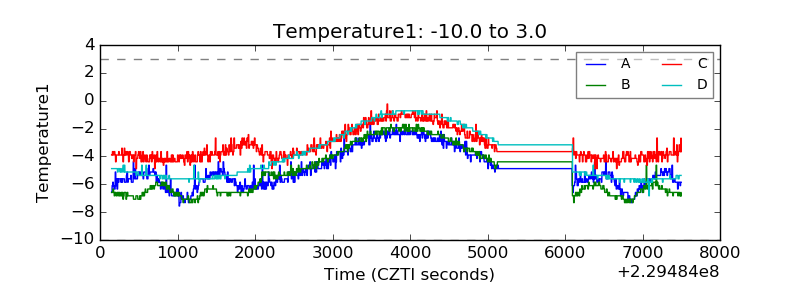 |
| Veto HV Monitor | 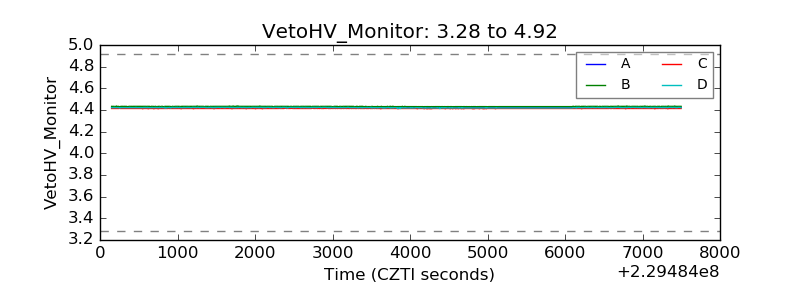 |
| Veto LLD | 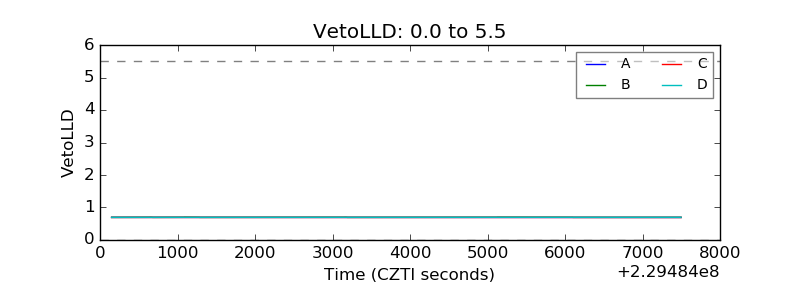 |
| Alpha Counter | 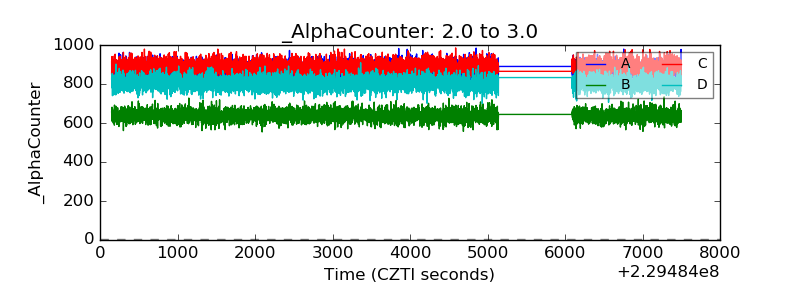 |
| _CPM_Rate | 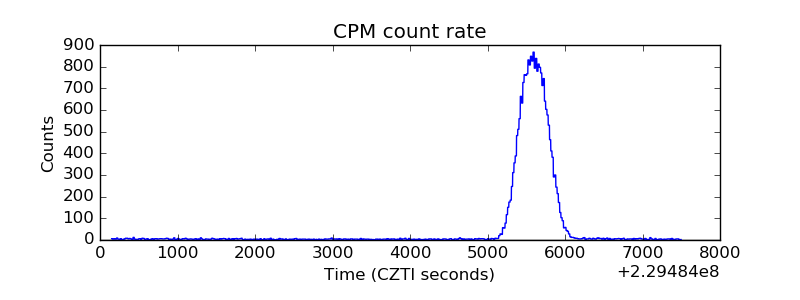 |
| CZT Counter | 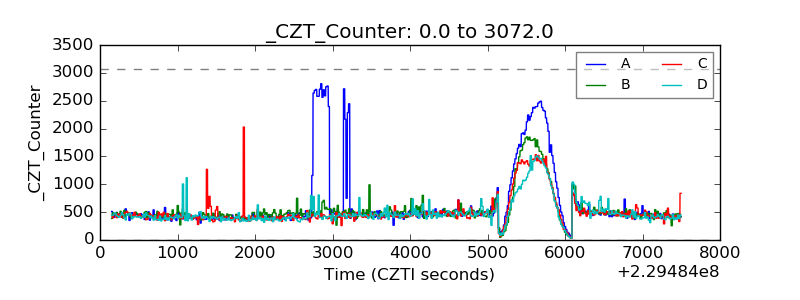 |
| +2.5 Volts monitor |  |
| +5 Volts monitor |  |
| _ROLL_ROT | 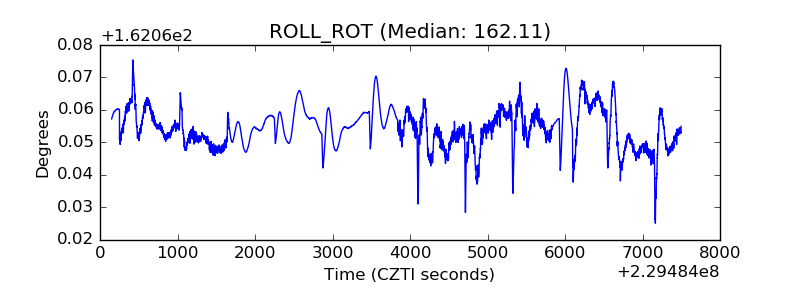 |
| _Roll_DEC | 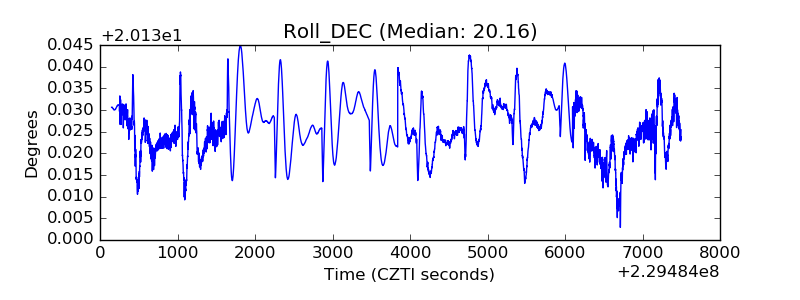 |
| _Roll_RA | 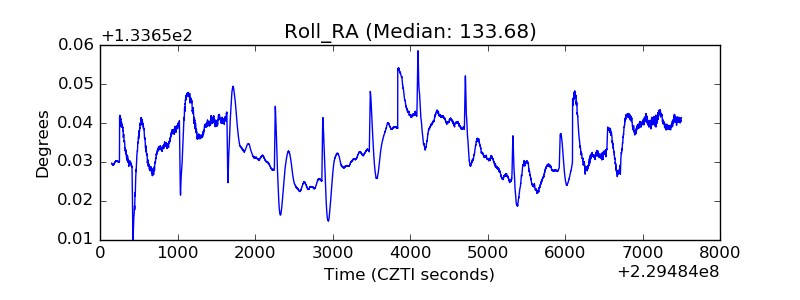 |
| Veto Counter | 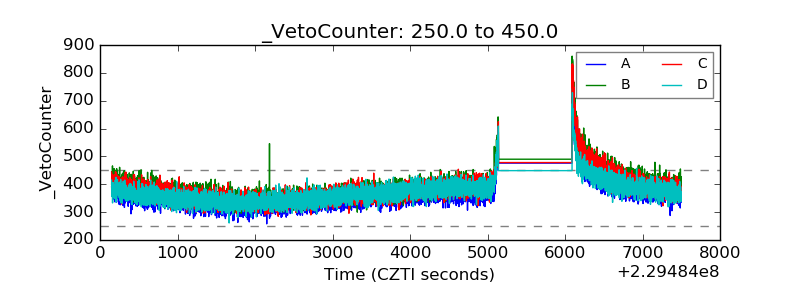 |