| Param | Original file | Final file |
|---|---|---|
| Filename | modeM0/AS1T01_163T01_9000001152_08292cztM0_level2.evt | modeM0/AS1T01_163T01_9000001152_08292cztM0_level2_quad_clean.evt |
| Size (bytes) | 457,309,440 | 76,965,120 |
| Size | 436.1 MB | 73.4 MB |
| Events in quadrant A | 3,312,171 | 478,561 |
| Events in quadrant B | 3,393,560 | 485,713 |
| Events in quadrant C | 3,180,118 | 469,007 |
| Events in quadrant D | 3,531,310 | 453,101 |
| Mode M9 | |||
|---|---|---|---|
| Quadrant | BADHDUFLAG | Total packets | Discarded packets |
| A | 0 | 16 | 0 |
| B | 0 | 16 | 0 |
| C | 0 | 16 | 0 |
| D | 0 | 17 | 0 |
| Mode M0 | |||
|---|---|---|---|
| Quadrant | BADHDUFLAG | Total packets | Discarded packets |
| A | 0 | 13762 | 3 |
| B | 0 | 13928 | 2 |
| C | 0 | 13492 | 2 |
| D | 0 | 14612 | 2 |
| Mode SS | |||
|---|---|---|---|
| Quadrant | BADHDUFLAG | Total packets | Discarded packets |
| A | 0 | 130 | 0 |
| B | 0 | 130 | 0 |
| C | 0 | 130 | 0 |
| D | 0 | 130 | 0 |
| Quadrant | Total seconds | Saturated seconds | Saturation percentage |
|---|---|---|---|
| A | 6362 | 118 | 1.854763% |
| B | 6362 | 122 | 1.917636% |
| C | 6362 | 72 | 1.131720% |
| D | 6362 | 136 | 2.137693% |
Noise dominated data is calculated using 1-second bins in cleaned event files. If a bin has >2000 counts, and if more than 50% of those come from <1% of pixels, then it is considered to be noise-dominated and hence unusable.
| Quadrant | # 1 sec bins | Bins with >0 counts | Bins with >2000 counts | High rate bins dominated by noise | Noise dominated (total time) | Noise dominated (detector-on time) | Marked lightcurve |
|---|---|---|---|---|---|---|---|
| A | 7597 | 6362 | 6 | 6 | 0.08% | 0.09% | 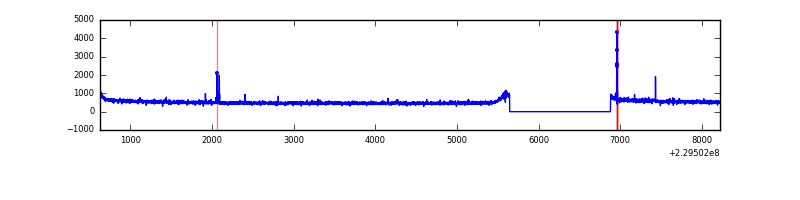 |
| B | 7597 | 6362 | 5 | 5 | 0.07% | 0.08% | 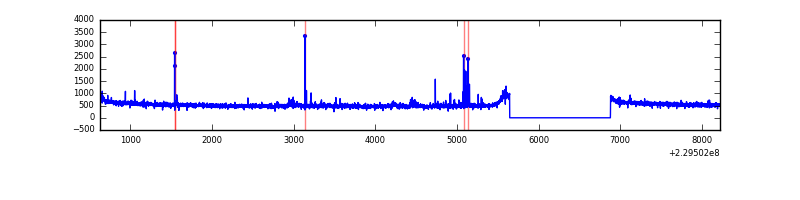 |
| C | 7597 | 6362 | 7 | 7 | 0.09% | 0.11% | 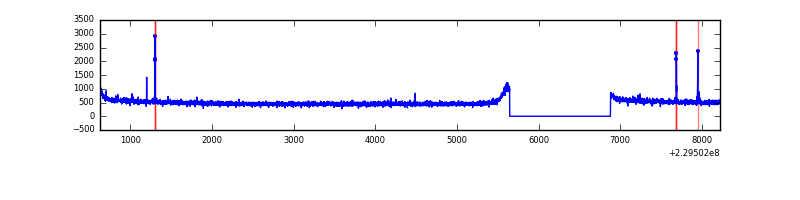 |
| D | 7597 | 6362 | 55 | 55 | 0.72% | 0.86% | 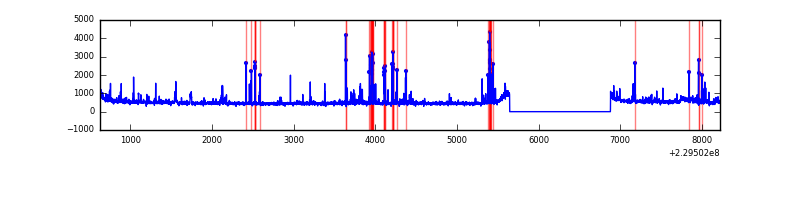 |
Top three noisy pixels from each quadrant. If the there are fewer than three noisy pixels in the level2.evt file, extra rows are filled as -1
| Pixel properties | Quadrant properties | ||||||
|---|---|---|---|---|---|---|---|
| Quadrant | DetID | PixID | Counts | Sigma | Mean | Median | Sigma |
| A | 15 | 234 | 30810 | 176.64 | 847 | 831 | 169.7 |
| A | 13 | 248 | 17771 | 99.81 | 847 | 831 | 169.7 |
| A | 0 | 226 | 8180 | 43.3 | 847 | 831 | 169.7 |
| B | 0 | 214 | 44957 | 275.36 | 847 | 830 | 160.2 |
| B | 10 | 16 | 37628 | 229.63 | 847 | 830 | 160.2 |
| B | 12 | 111 | 16451 | 97.48 | 847 | 830 | 160.2 |
| C | 9 | 54 | 38025 | 199.9 | 806 | 811 | 186.2 |
| C | 13 | 61 | 6255 | 29.24 | 806 | 811 | 186.2 |
| C | 3 | 202 | 2081 | 6.82 | 806 | 811 | 186.2 |
| D | 12 | 233 | 119452 | 591.36 | 806 | 787 | 200.7 |
| D | 1 | 52 | 72508 | 357.42 | 806 | 787 | 200.7 |
| D | 2 | 14 | 69182 | 340.84 | 806 | 787 | 200.7 |
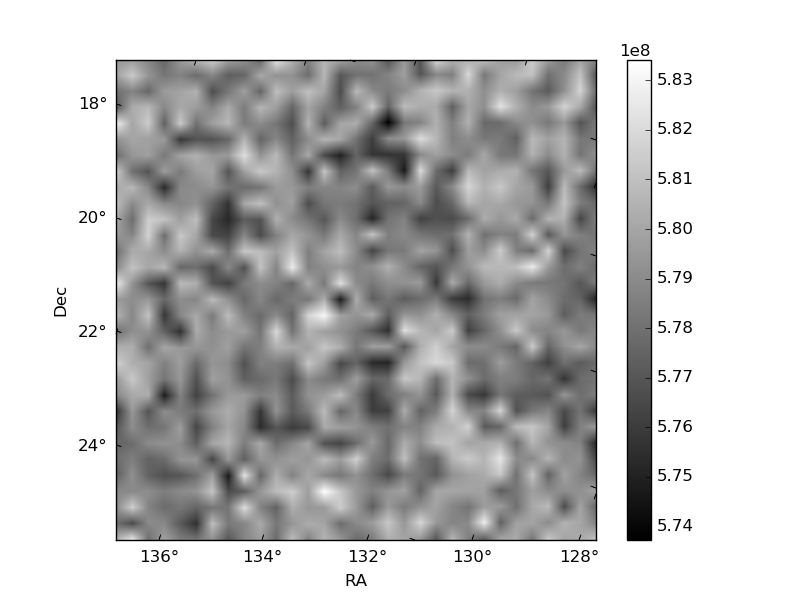
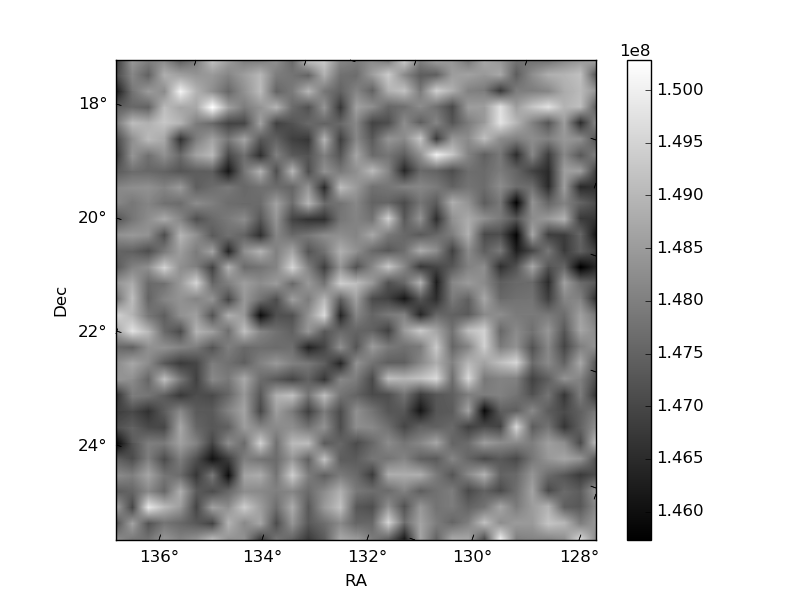
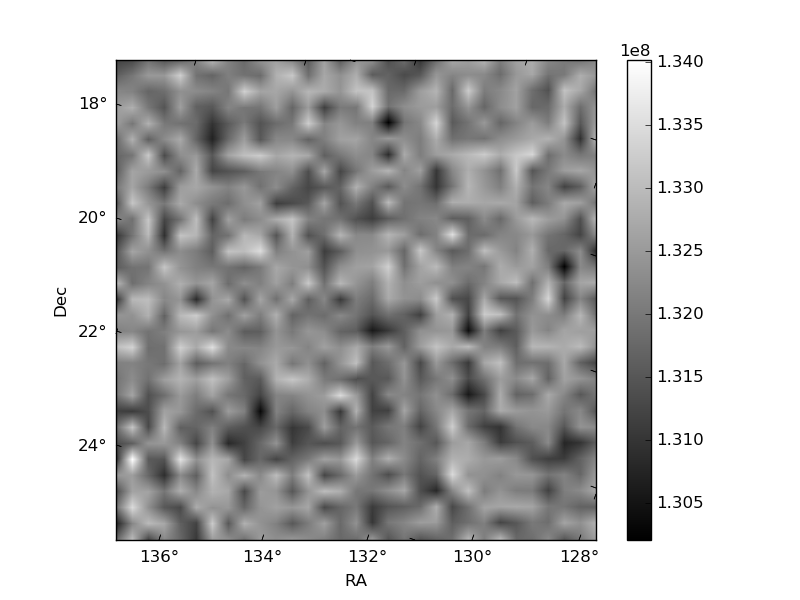
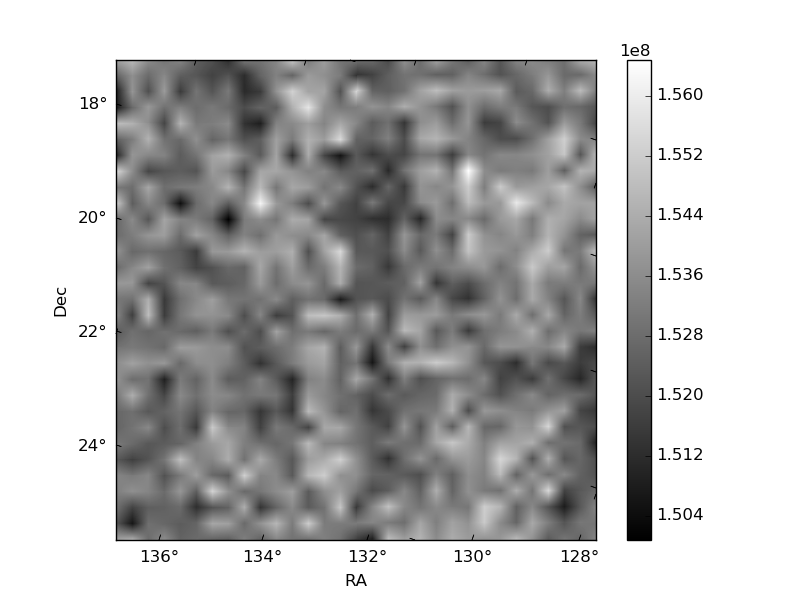
Histogram calculated using DETX and DETY for each event in the final _common_clean file
| Quadrant A | 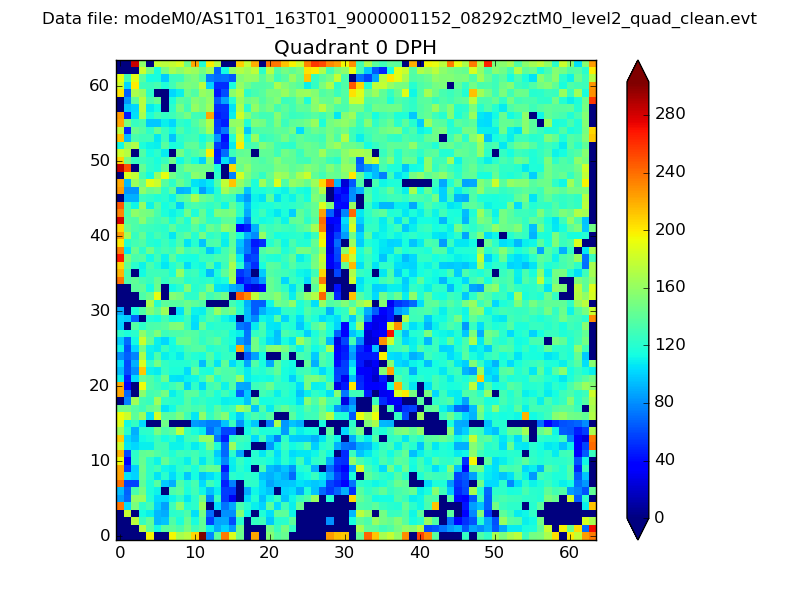 |
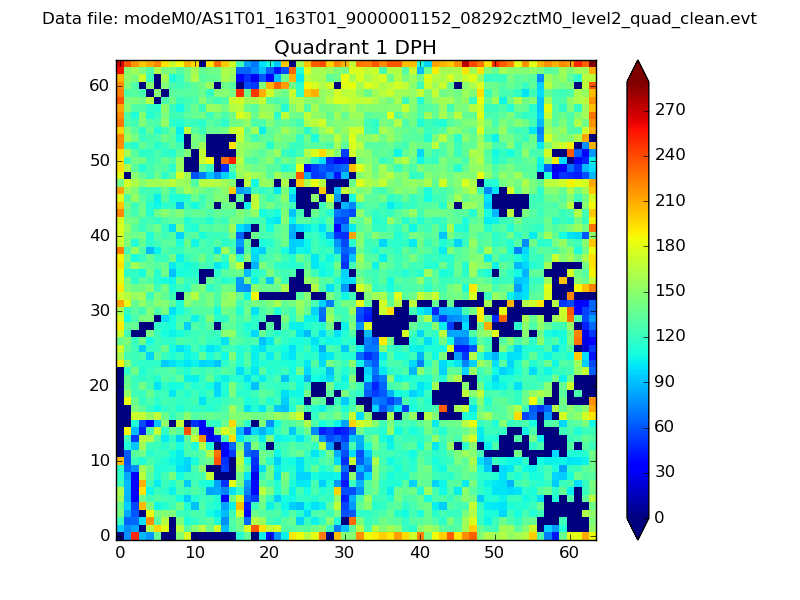 |
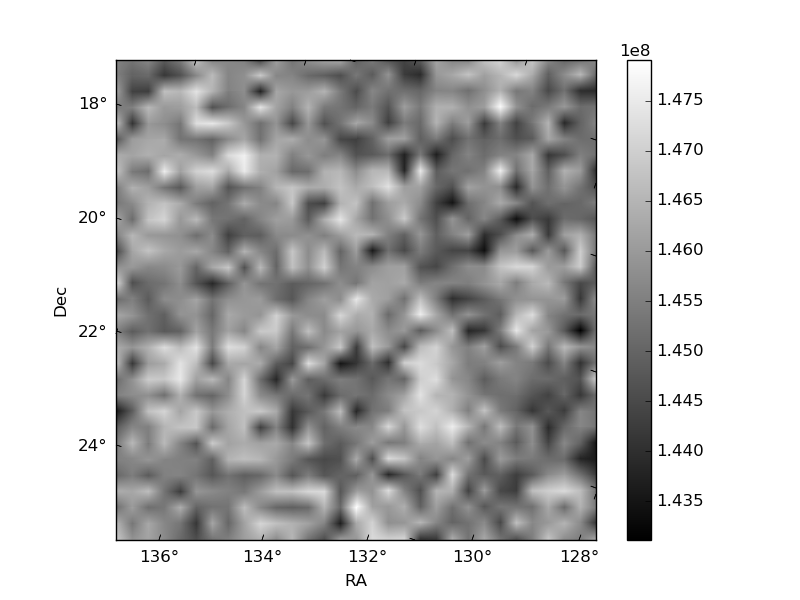
Quadrant B |
|---|---|---|---|
| Quadrant D | 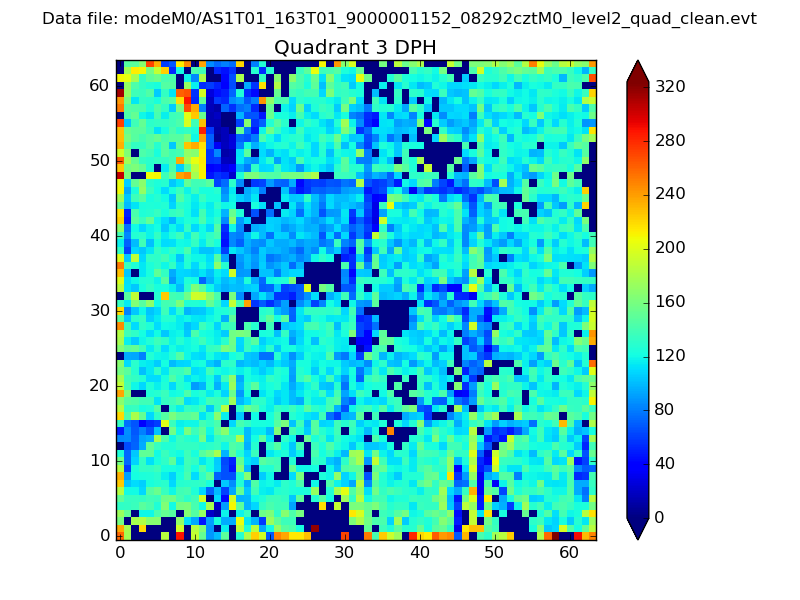 |
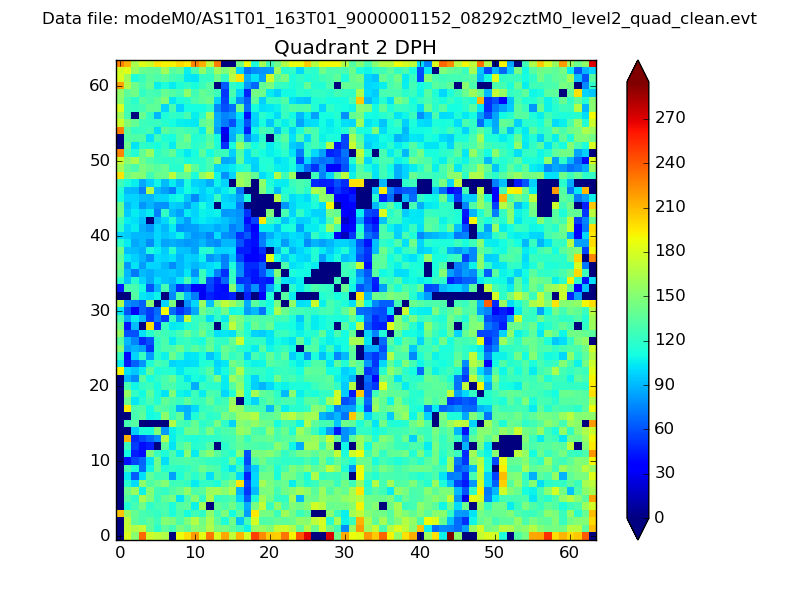 |
Quadrant C |
| Plot type | Count rate plots | Images |
|---|---|---|
| Comparison with Poisson distribution Blue bars denote a histogram of data divided into 1 sec bins. Red curve is a Poisson curve with rate = median count rate of data. |
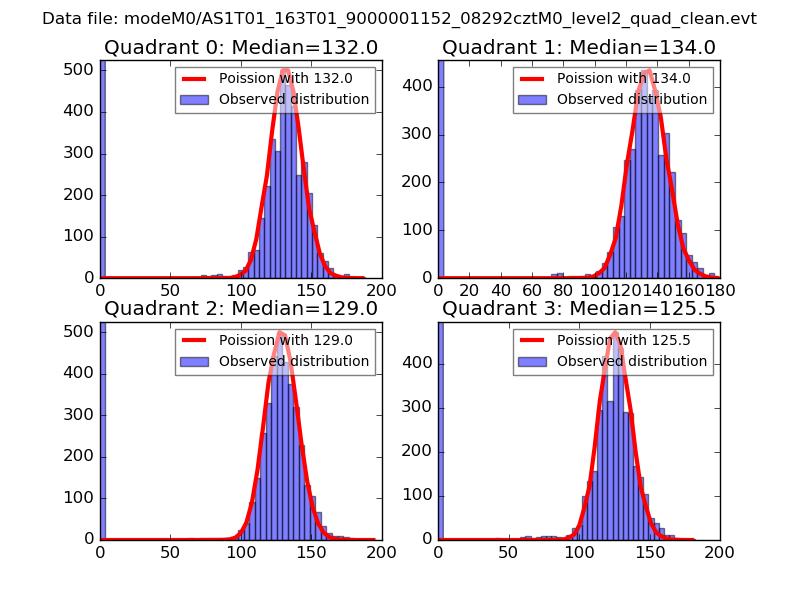 |
 |
| Quadrant-wise count rates Data is divided into 100 sec bins |
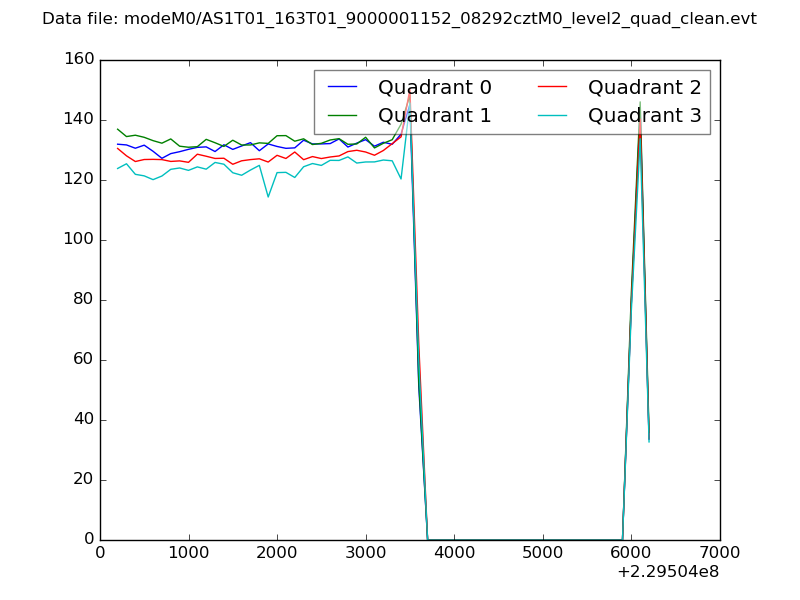 |
|
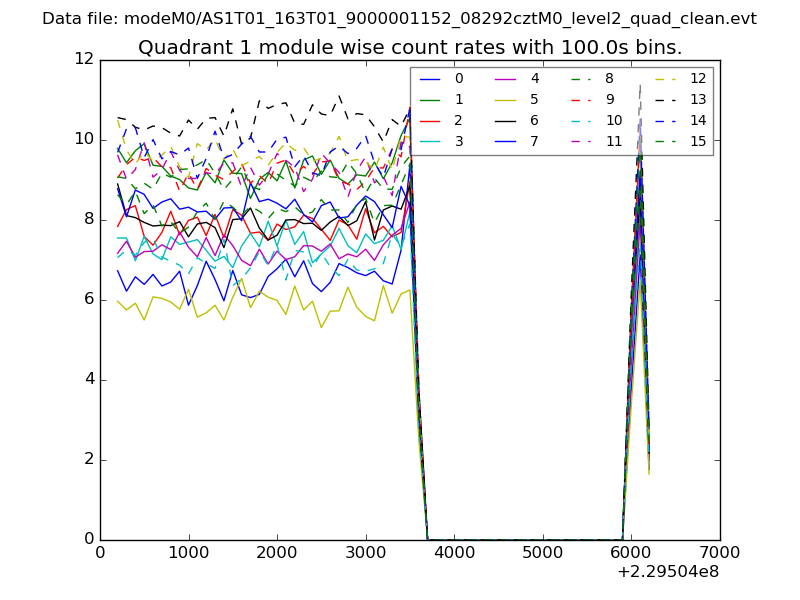
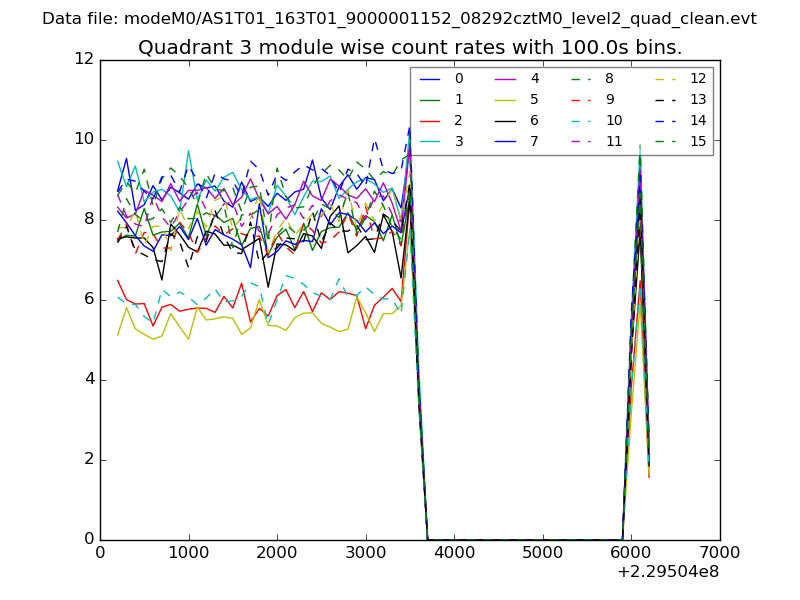
| Module-wise count rates for Quadrant A Data is divided into 100 sec bins |
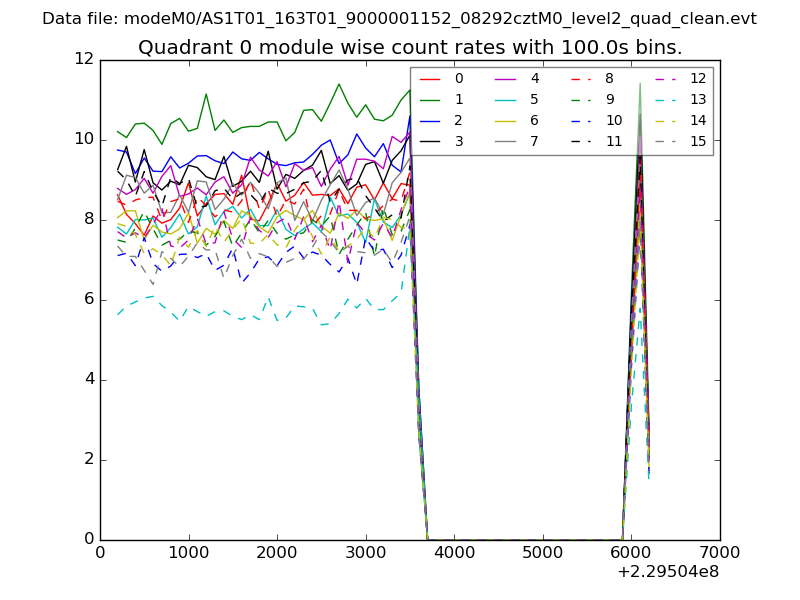 |
 |
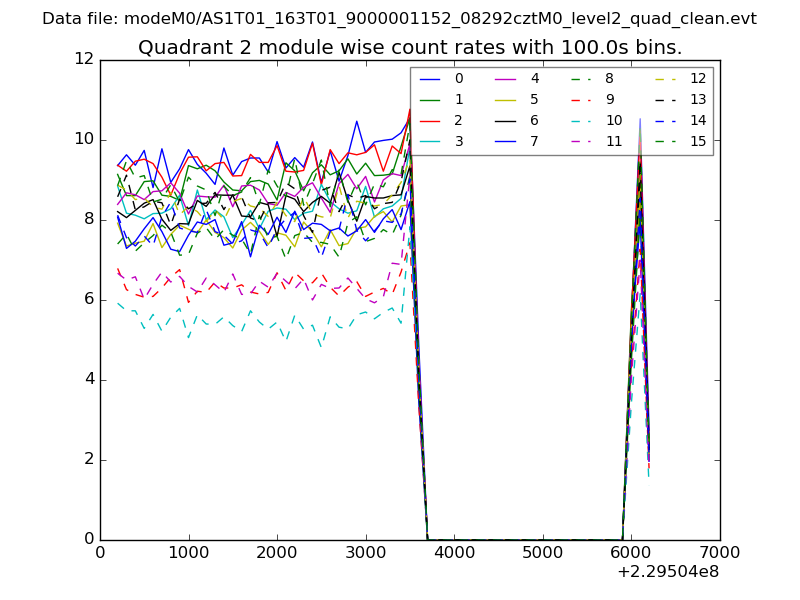
| Module-wise count rates for Quadrant B Data is divided into 100 sec bins |
 |
 |
| Module-wise count rates for Quadrant C Data is divided into 100 sec bins |
 |
 |
| Module-wise count rates for Quadrant D Data is divided into 100 sec bins |
 |
 |
| Parameter | Plot |
|---|---|
| CZT HV Monitor | 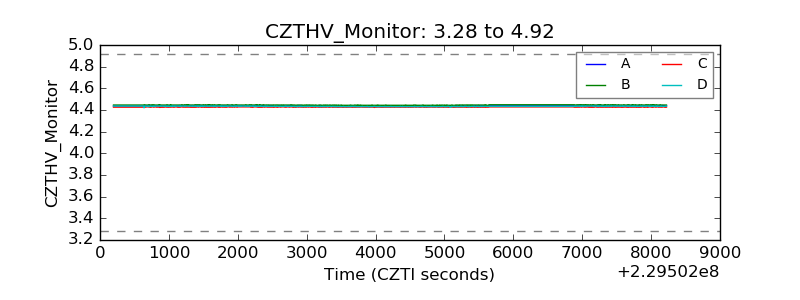 |
| D_VDD | 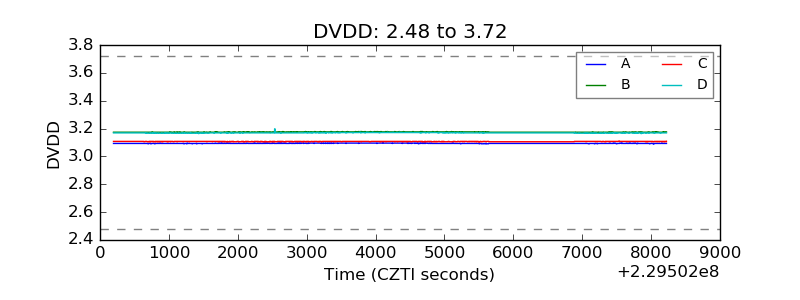 |
| Temperature 1 | 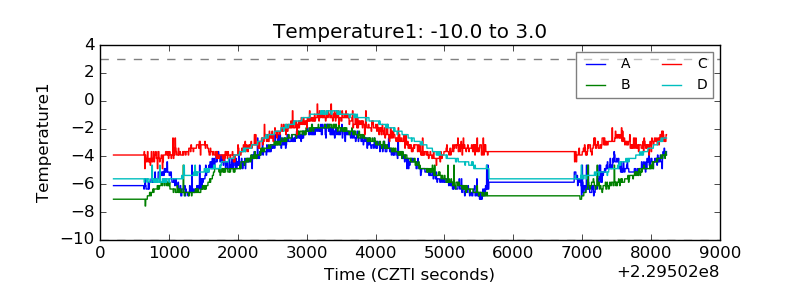 |
| Veto HV Monitor | 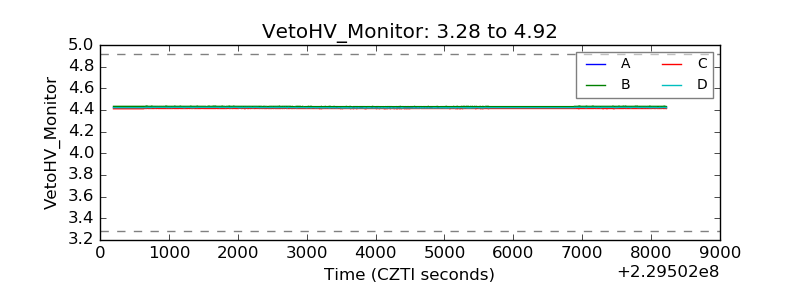 |
| Veto LLD | 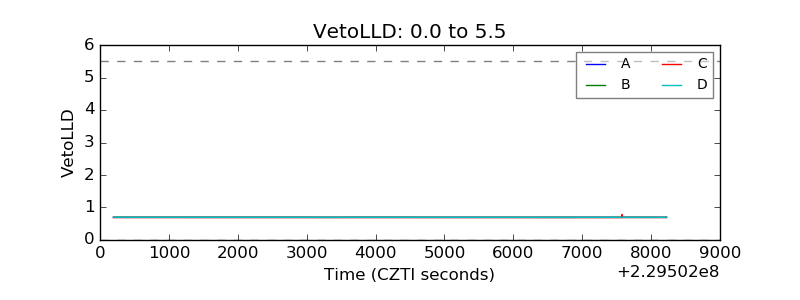 |
| Alpha Counter | 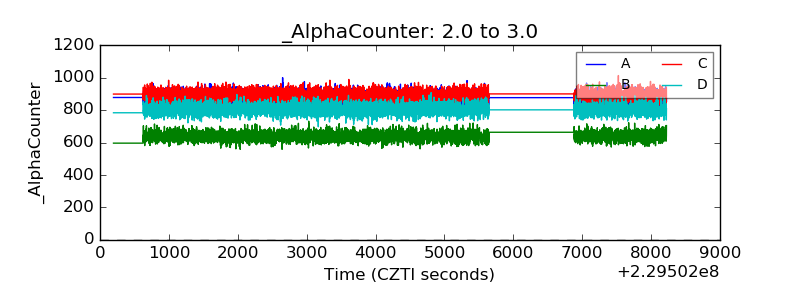 |
| _CPM_Rate | 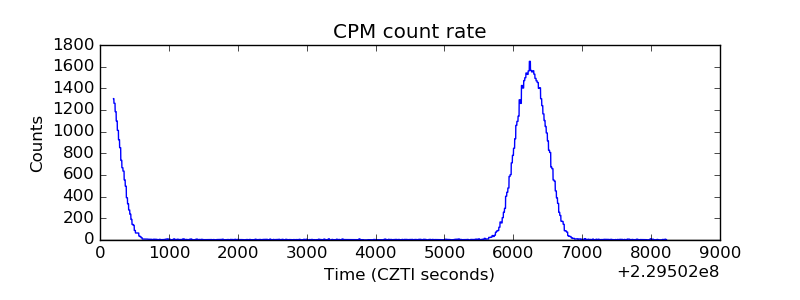 |
| CZT Counter | 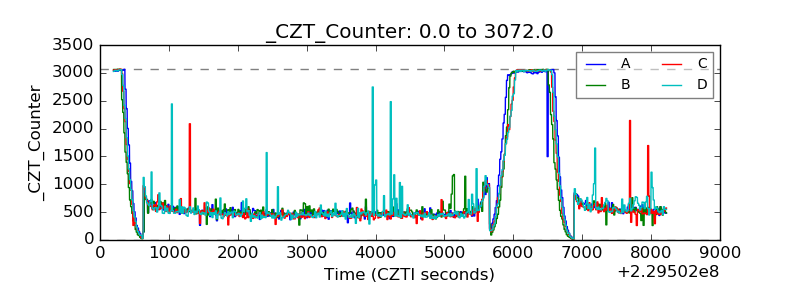 |
| +2.5 Volts monitor |  |
| +5 Volts monitor |  |
| _ROLL_ROT | 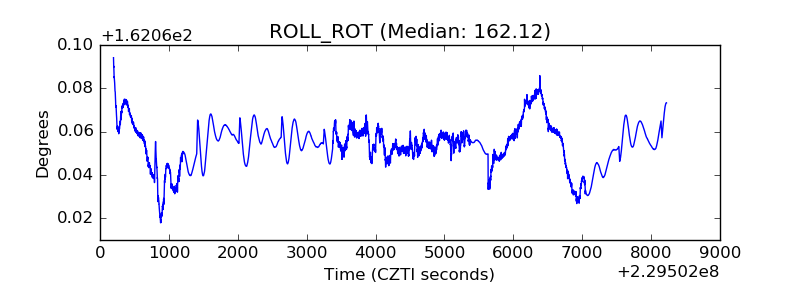 |
| _Roll_DEC | 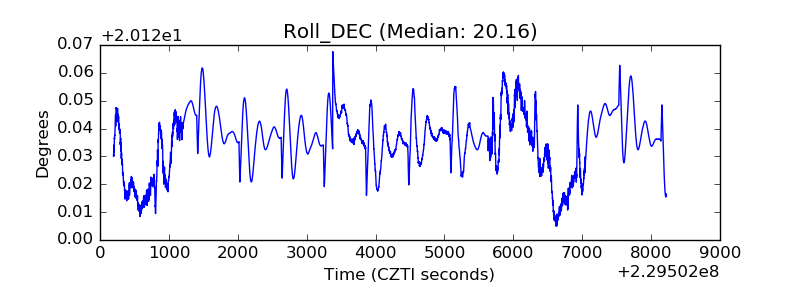 |
| _Roll_RA | 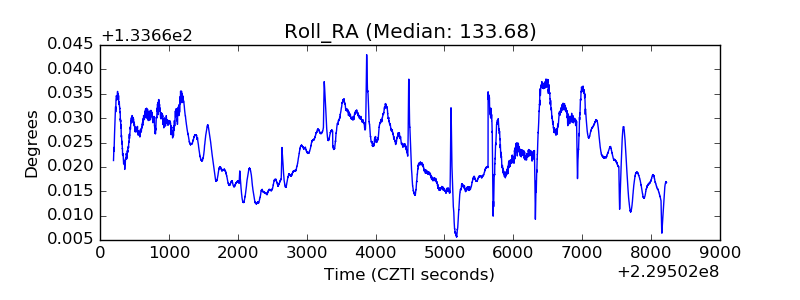 |
| Veto Counter | 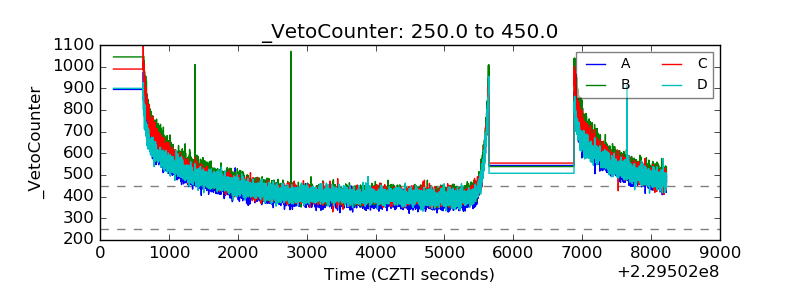 |