| Param | Original file | Final file |
|---|---|---|
| Filename | modeM0/AS1T01_163T01_9000001152_08295cztM0_level2.evt | modeM0/AS1T01_163T01_9000001152_08295cztM0_level2_quad_clean.evt |
| Size (bytes) | 475,401,600 | 99,357,120 |
| Size | 453.4 MB | 94.8 MB |
| Events in quadrant A | 3,616,786 | 654,753 |
| Events in quadrant B | 3,213,518 | 659,419 |
| Events in quadrant C | 3,320,079 | 635,174 |
| Events in quadrant D | 3,819,959 | 620,814 |
| Mode M9 | |||
|---|---|---|---|
| Quadrant | BADHDUFLAG | Total packets | Discarded packets |
| A | 0 | 10 | 0 |
| B | 0 | 10 | 0 |
| C | 0 | 10 | 0 |
| D | 0 | 10 | 0 |
| Mode M0 | |||
|---|---|---|---|
| Quadrant | BADHDUFLAG | Total packets | Discarded packets |
| A | 0 | 14833 | 2 |
| B | 0 | 13586 | 1 |
| C | 0 | 14037 | 1 |
| D | 0 | 15490 | 1 |
| Mode SS | |||
|---|---|---|---|
| Quadrant | BADHDUFLAG | Total packets | Discarded packets |
| A | 0 | 128 | 0 |
| B | 0 | 128 | 0 |
| C | 0 | 128 | 0 |
| D | 0 | 128 | 0 |
| Quadrant | Total seconds | Saturated seconds | Saturation percentage |
|---|---|---|---|
| A | 6288 | 265 | 4.214377% |
| B | 6288 | 139 | 2.210560% |
| C | 6288 | 163 | 2.592239% |
| D | 6288 | 210 | 3.339695% |
Noise dominated data is calculated using 1-second bins in cleaned event files. If a bin has >2000 counts, and if more than 50% of those come from <1% of pixels, then it is considered to be noise-dominated and hence unusable.
| Quadrant | # 1 sec bins | Bins with >0 counts | Bins with >2000 counts | High rate bins dominated by noise | Noise dominated (total time) | Noise dominated (detector-on time) | Marked lightcurve |
|---|---|---|---|---|---|---|---|
| A | 7323 | 6288 | 55 | 55 | 0.75% | 0.87% | 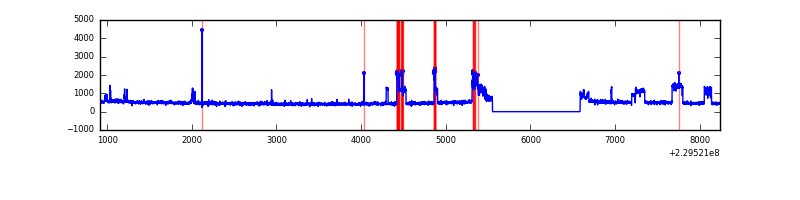 |
| B | 7323 | 6289 | 1 | 1 | 0.01% | 0.02% | 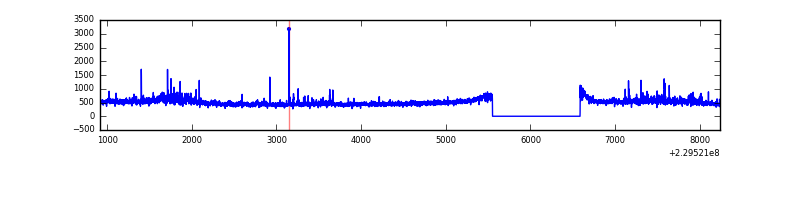 |
| C | 7323 | 6289 | 74 | 74 | 1.01% | 1.18% |  |
| D | 7323 | 6288 | 22 | 22 | 0.30% | 0.35% | 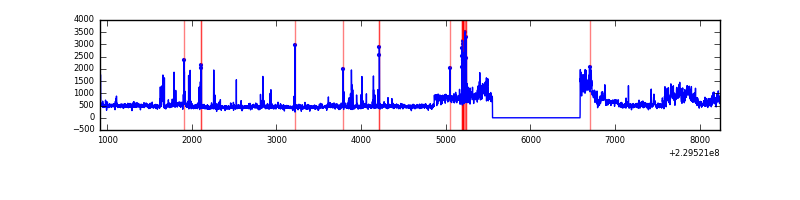 |
Top three noisy pixels from each quadrant. If the there are fewer than three noisy pixels in the level2.evt file, extra rows are filled as -1
| Pixel properties | Quadrant properties | ||||||
|---|---|---|---|---|---|---|---|
| Quadrant | DetID | PixID | Counts | Sigma | Mean | Median | Sigma |
| A | 0 | 23 | 565043 | 3592.55 | 774 | 757 | 157.1 |
| A | 0 | 226 | 45058 | 282.04 | 774 | 757 | 157.1 |
| A | 15 | 234 | 18234 | 111.27 | 774 | 757 | 157.1 |
| B | 0 | 214 | 98493 | 664.23 | 772 | 754 | 147.1 |
| B | 0 | 219 | 53661 | 359.55 | 772 | 754 | 147.1 |
| B | 11 | 51 | 22365 | 146.87 | 772 | 754 | 147.1 |
| C | 9 | 54 | 414279 | 2412.88 | 744 | 746 | 171.4 |
| C | 13 | 61 | 5637 | 28.54 | 744 | 746 | 171.4 |
| C | 9 | 68 | 3487 | 15.99 | 744 | 746 | 171.4 |
| D | 8 | 230 | 384206 | 2077.95 | 750 | 727 | 184.5 |
| D | 1 | 52 | 375829 | 2032.56 | 750 | 727 | 184.5 |
| D | 2 | 14 | 102051 | 549.04 | 750 | 727 | 184.5 |
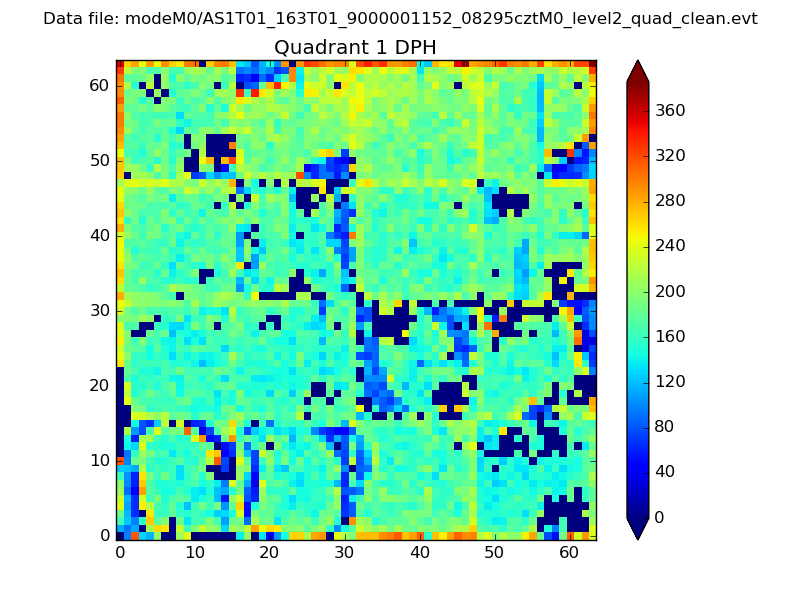
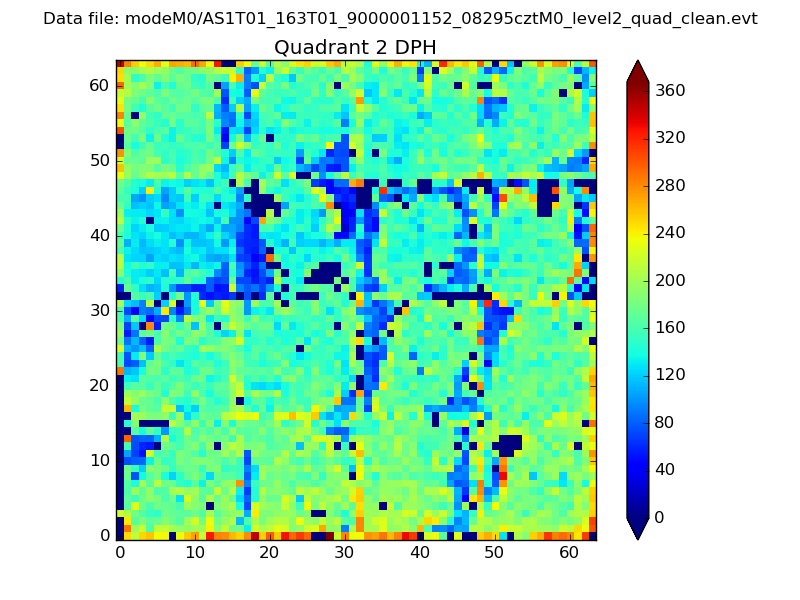
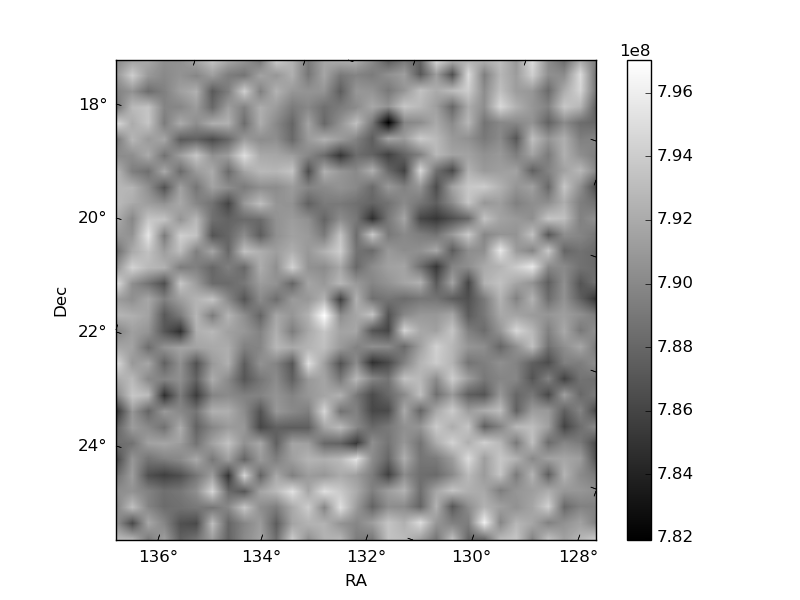
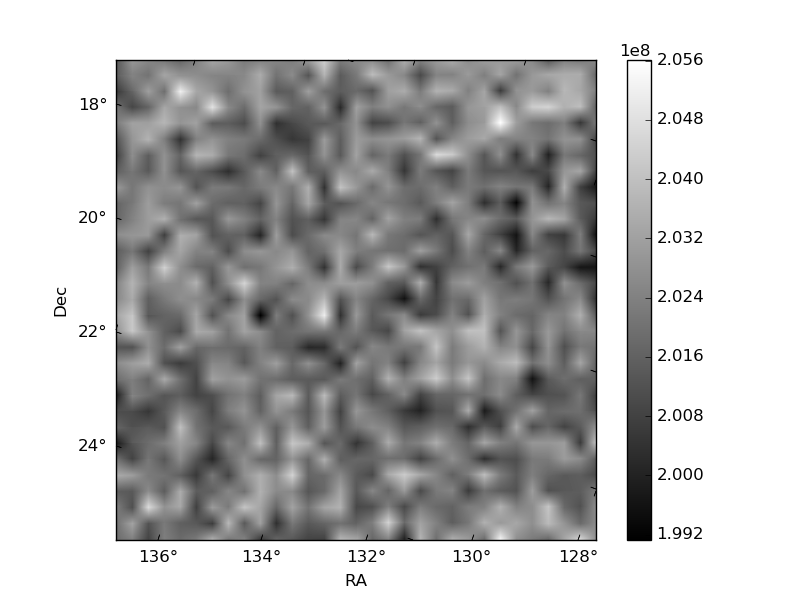
Histogram calculated using DETX and DETY for each event in the final _common_clean file
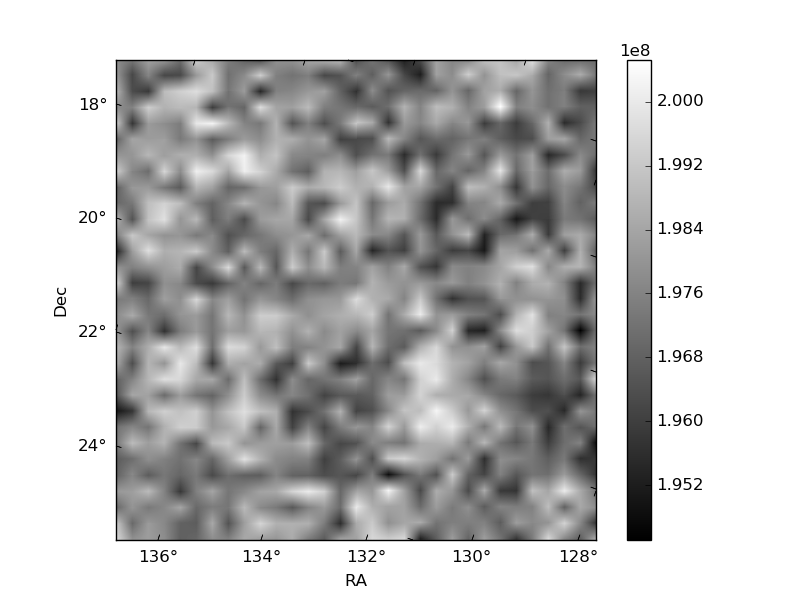
| Quadrant A | 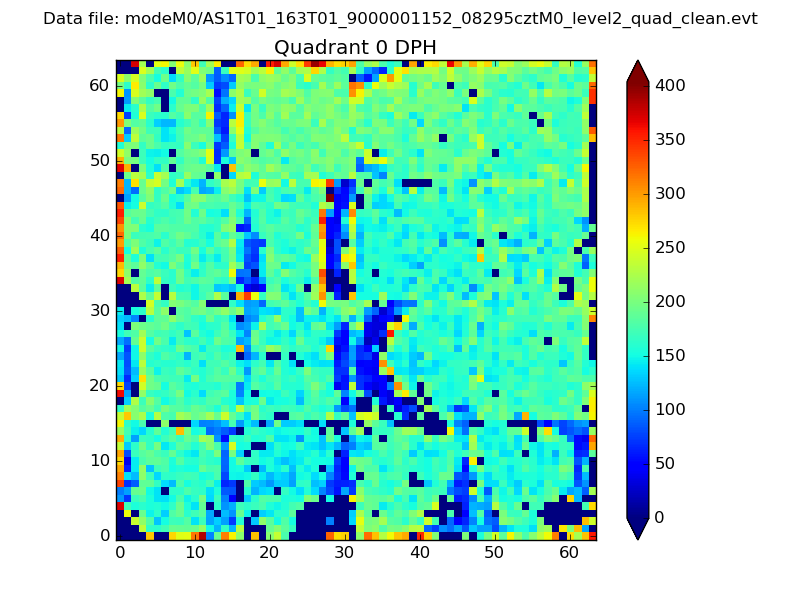 |
 |
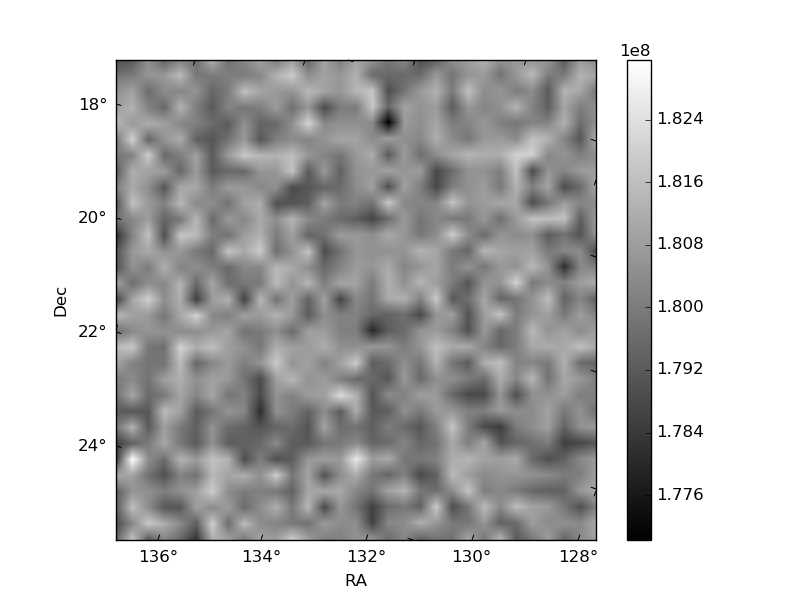
Quadrant B |
|---|---|---|---|
| Quadrant D | 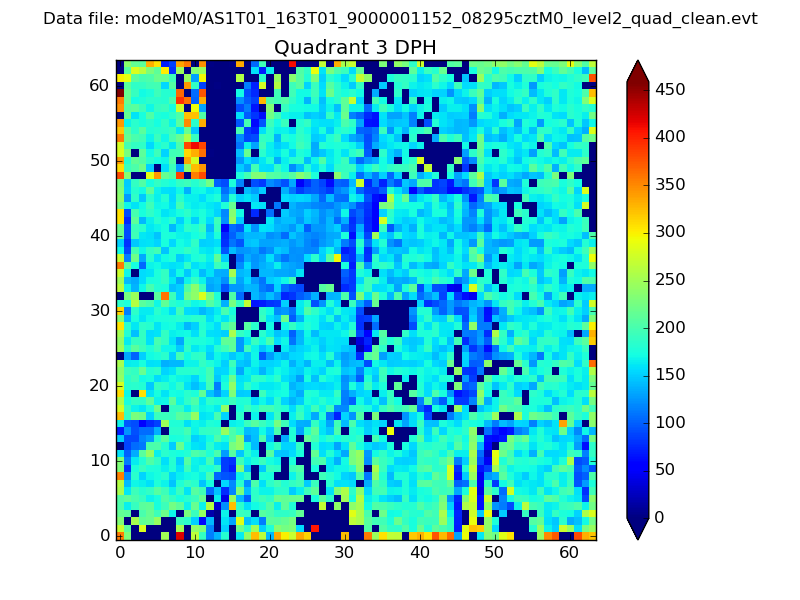 |
 |
Quadrant C |
| Plot type | Count rate plots | Images |
|---|---|---|
| Comparison with Poisson distribution Blue bars denote a histogram of data divided into 1 sec bins. Red curve is a Poisson curve with rate = median count rate of data. |
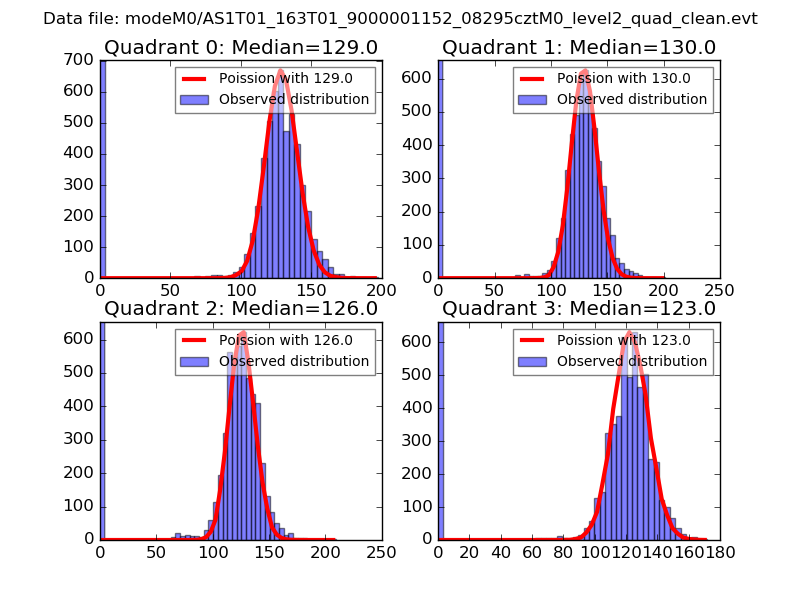 |
 |
| Quadrant-wise count rates Data is divided into 100 sec bins |
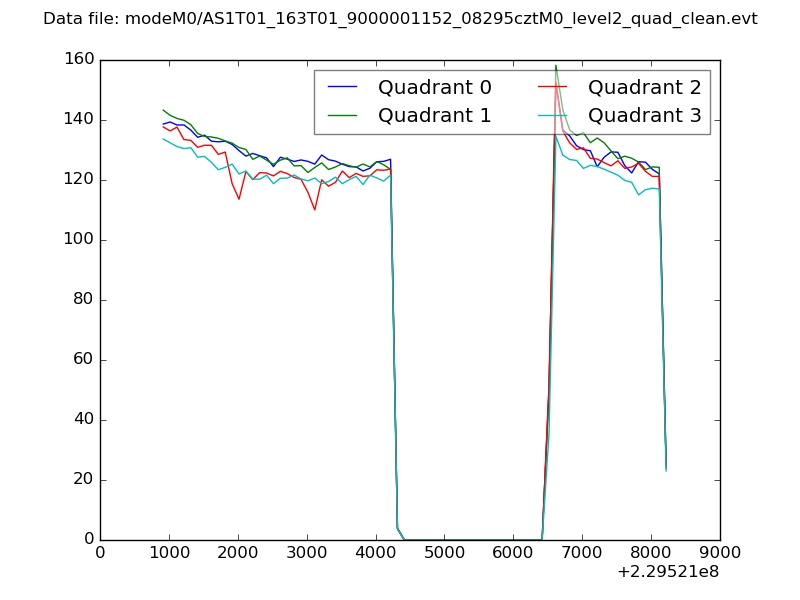 |
|
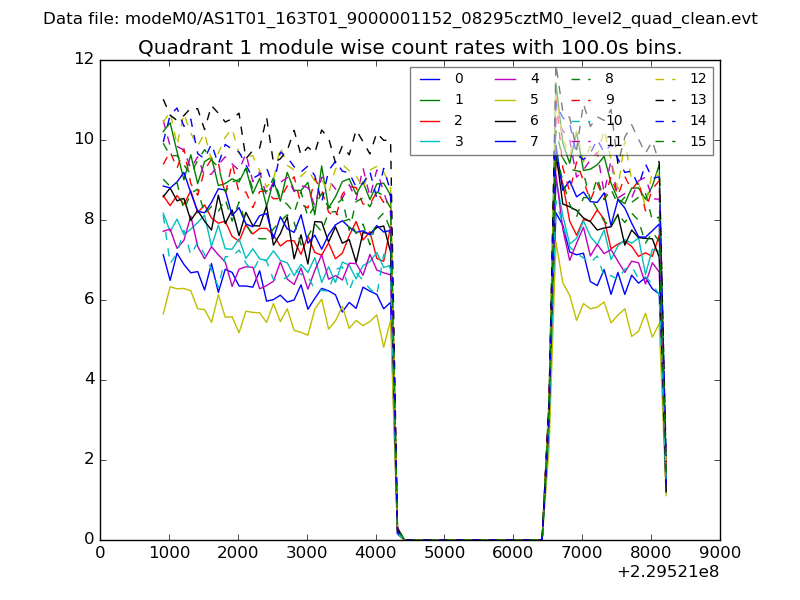
| Module-wise count rates for Quadrant A Data is divided into 100 sec bins |
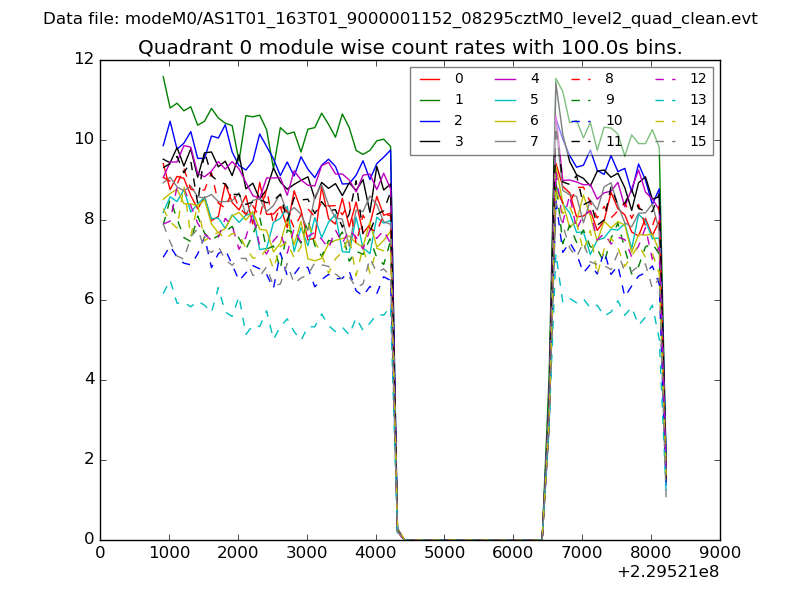 |
 |
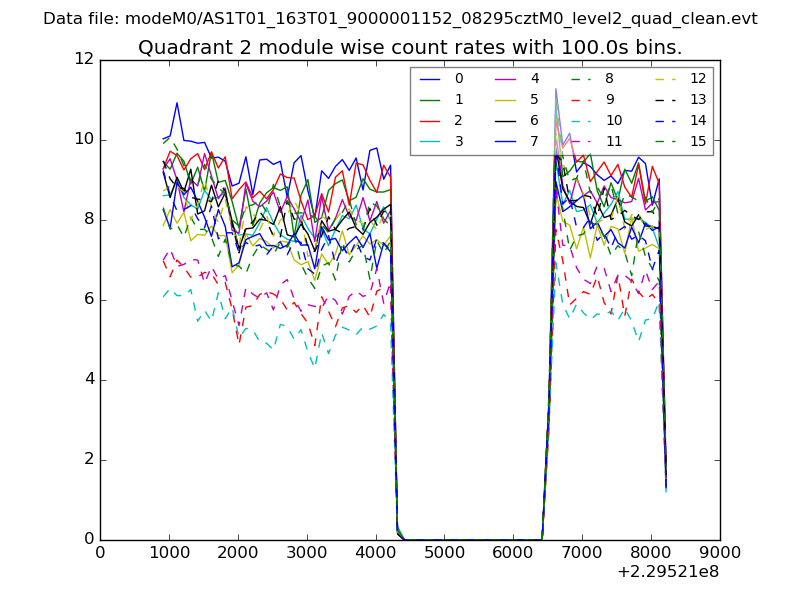
| Module-wise count rates for Quadrant B Data is divided into 100 sec bins |
 |
 |
| Module-wise count rates for Quadrant C Data is divided into 100 sec bins |
 |
 |
| Module-wise count rates for Quadrant D Data is divided into 100 sec bins |
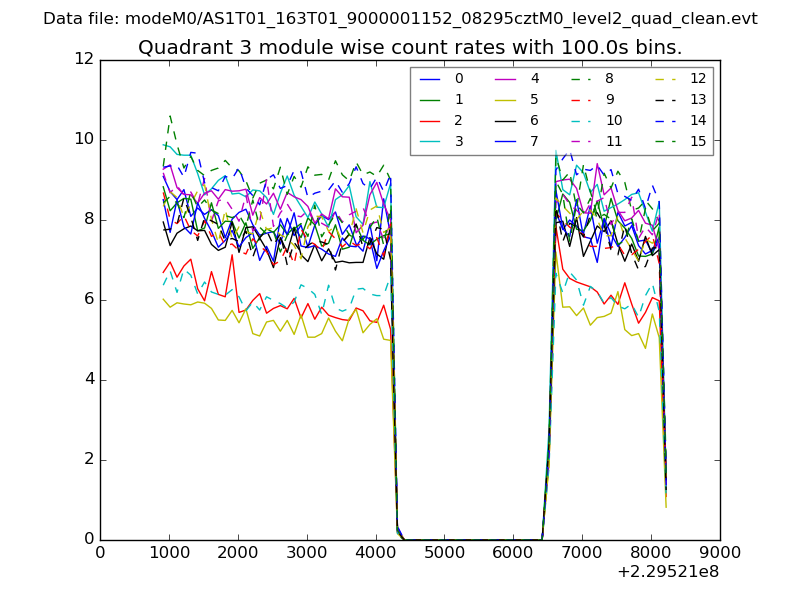 |
 |
| Parameter | Plot |
|---|---|
| CZT HV Monitor | 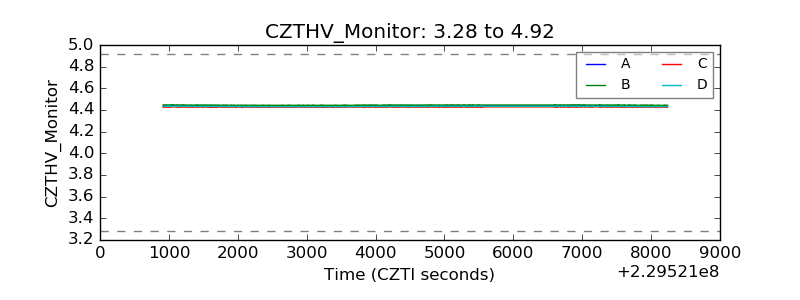 |
| D_VDD | 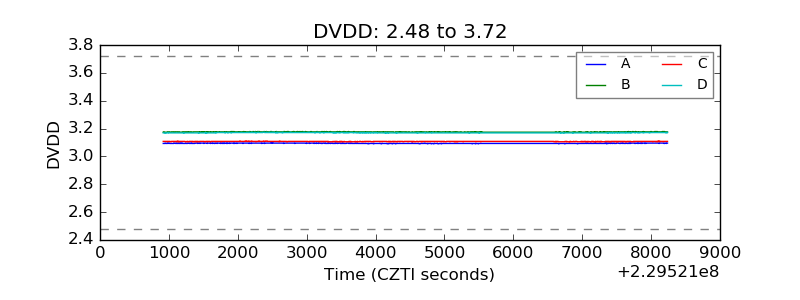 |
| Temperature 1 | 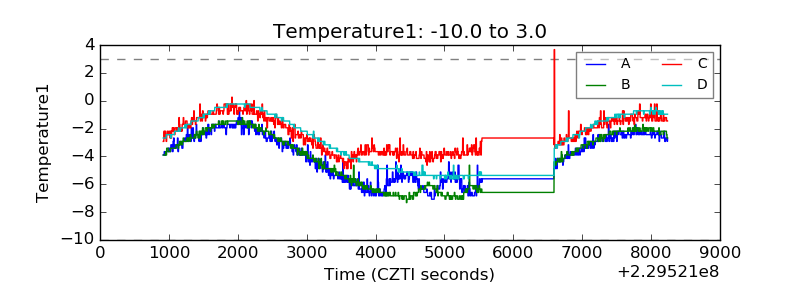 |
| Veto HV Monitor | 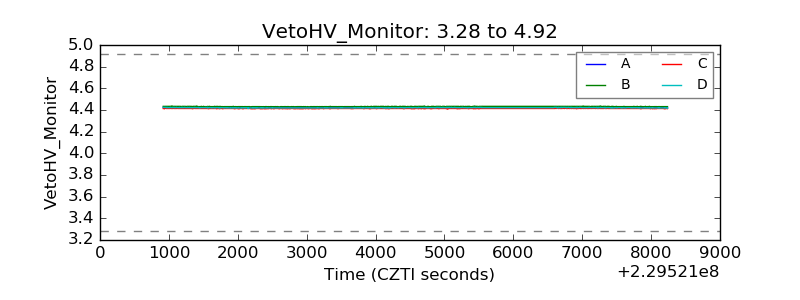 |
| Veto LLD | 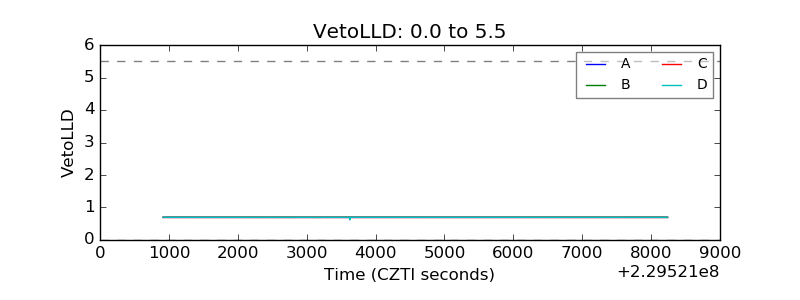 |
| Alpha Counter | 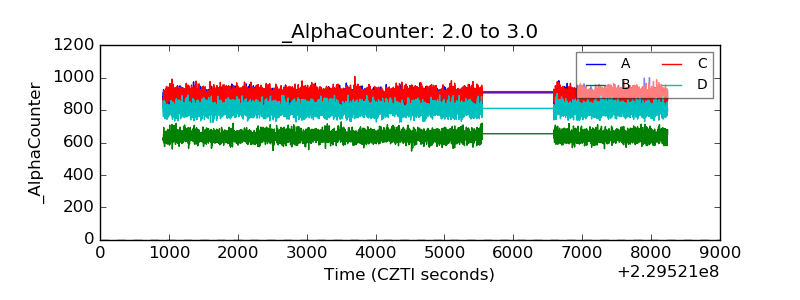 |
| _CPM_Rate | 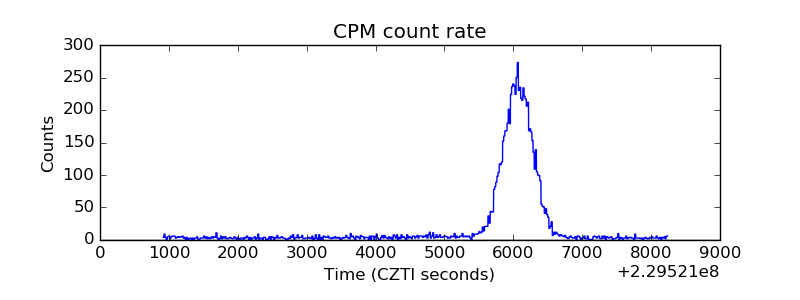 |
| CZT Counter | 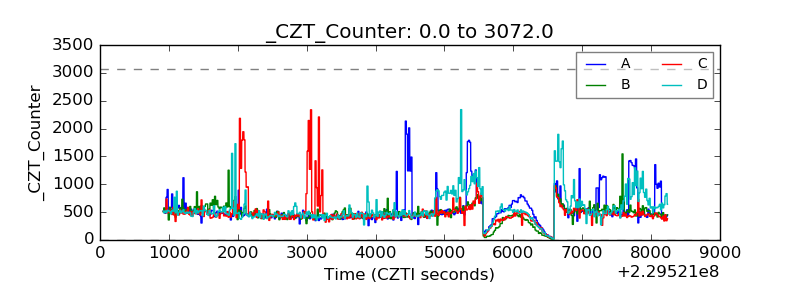 |
| +2.5 Volts monitor | 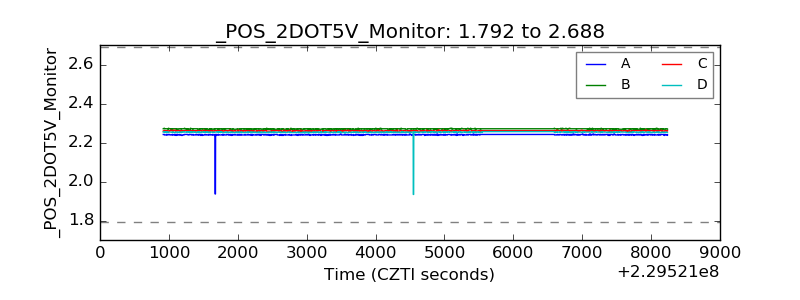 |
| +5 Volts monitor |  |
| _ROLL_ROT | 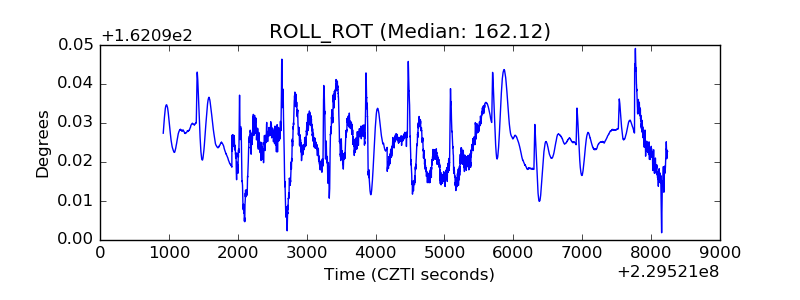 |
| _Roll_DEC | 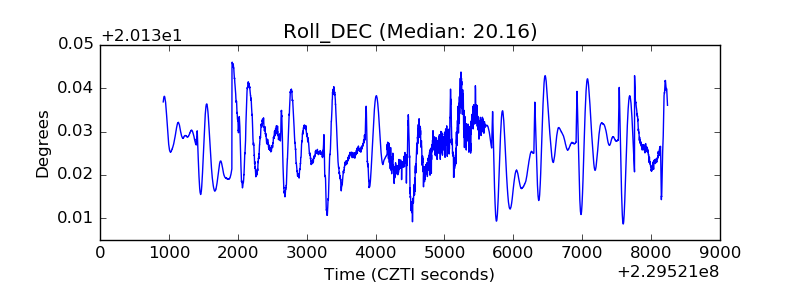 |
| _Roll_RA | 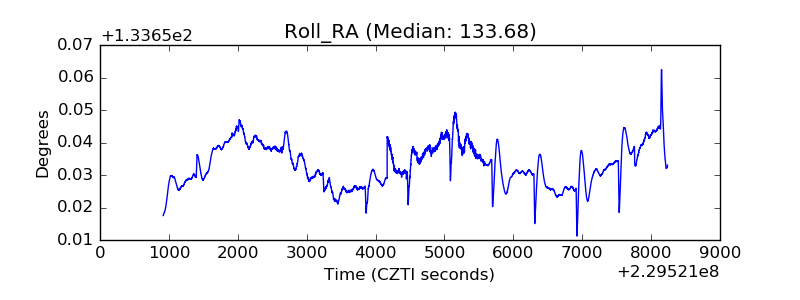 |
| Veto Counter | 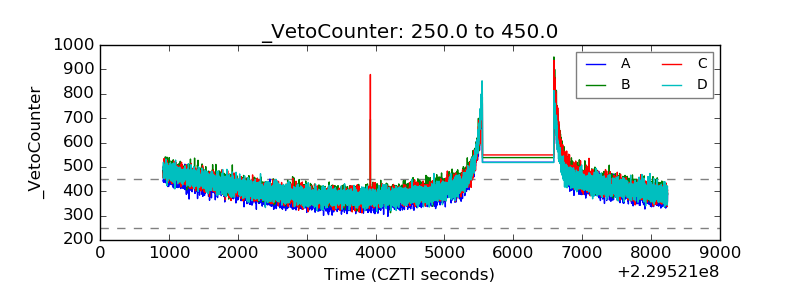 |