| Param | Original file | Final file |
|---|---|---|
| Filename | modeM0/AS1T01_163T01_9000001152_08297cztM0_level2.evt | modeM0/AS1T01_163T01_9000001152_08297cztM0_level2_quad_clean.evt |
| Size (bytes) | 485,136,000 | 88,329,600 |
| Size | 462.7 MB | 84.2 MB |
| Events in quadrant A | 3,908,751 | 552,796 |
| Events in quadrant B | 3,403,739 | 559,734 |
| Events in quadrant C | 3,154,151 | 552,670 |
| Events in quadrant D | 3,761,671 | 533,484 |
| Mode M9 | |||
|---|---|---|---|
| Quadrant | BADHDUFLAG | Total packets | Discarded packets |
| A | 0 | 1 | 0 |
| B | 0 | 1 | 0 |
| C | 0 | 1 | 0 |
| D | 0 | 1 | 0 |
| Mode M0 | |||
|---|---|---|---|
| Quadrant | BADHDUFLAG | Total packets | Discarded packets |
| A | 0 | 16384 | 3 |
| B | 0 | 14695 | 2 |
| C | 0 | 14279 | 2 |
| D | 0 | 15940 | 2 |
| Mode SS | |||
|---|---|---|---|
| Quadrant | BADHDUFLAG | Total packets | Discarded packets |
| A | 0 | 142 | 0 |
| B | 0 | 142 | 0 |
| C | 0 | 142 | 0 |
| D | 0 | 142 | 0 |
| Quadrant | Total seconds | Saturated seconds | Saturation percentage |
|---|---|---|---|
| A | 6819 | 183 | 2.683678% |
| B | 6819 | 176 | 2.581024% |
| C | 6819 | 62 | 0.909224% |
| D | 6819 | 129 | 1.891773% |
Noise dominated data is calculated using 1-second bins in cleaned event files. If a bin has >2000 counts, and if more than 50% of those come from <1% of pixels, then it is considered to be noise-dominated and hence unusable.
| Quadrant | # 1 sec bins | Bins with >0 counts | Bins with >2000 counts | High rate bins dominated by noise | Noise dominated (total time) | Noise dominated (detector-on time) | Marked lightcurve |
|---|---|---|---|---|---|---|---|
| A | 7044 | 6822 | 7 | 7 | 0.10% | 0.10% | 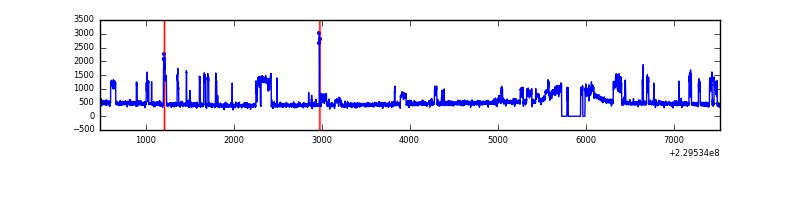 |
| B | 7044 | 6821 | 6 | 6 | 0.09% | 0.09% | 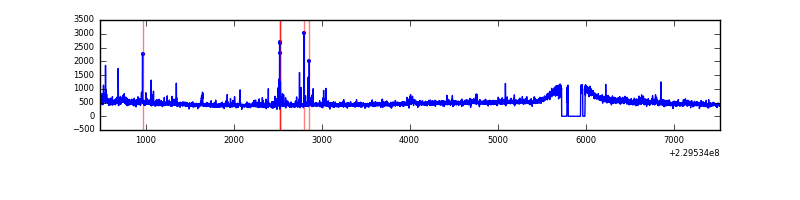 |
| C | 7044 | 6822 | 2 | 2 | 0.03% | 0.03% | 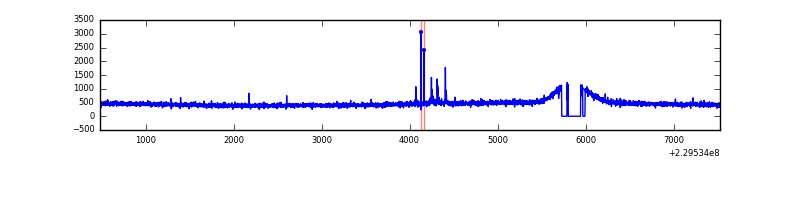 |
| D | 7044 | 6821 | 46 | 46 | 0.65% | 0.67% | 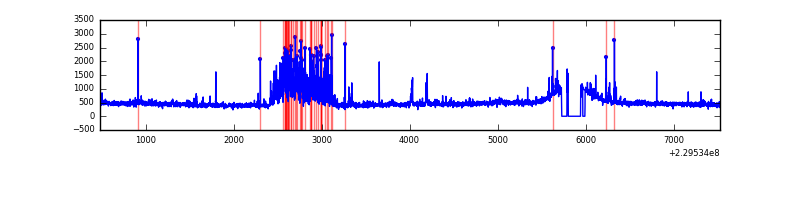 |
Top three noisy pixels from each quadrant. If the there are fewer than three noisy pixels in the level2.evt file, extra rows are filled as -1
| Pixel properties | Quadrant properties | ||||||
|---|---|---|---|---|---|---|---|
| Quadrant | DetID | PixID | Counts | Sigma | Mean | Median | Sigma |
| A | 0 | 23 | 659965 | 3882.78 | 827 | 809 | 169.8 |
| A | 0 | 226 | 53164 | 308.4 | 827 | 809 | 169.8 |
| A | 13 | 248 | 16131 | 90.25 | 827 | 809 | 169.8 |
| B | 0 | 214 | 90720 | 557.22 | 827 | 807 | 161.4 |
| B | 10 | 16 | 50750 | 309.51 | 827 | 807 | 161.4 |
| B | 12 | 111 | 16949 | 100.04 | 827 | 807 | 161.4 |
| C | 9 | 54 | 38369 | 200.0 | 799 | 804 | 187.8 |
| C | 13 | 61 | 6193 | 28.69 | 799 | 804 | 187.8 |
| C | 3 | 202 | 1960 | 6.15 | 799 | 804 | 187.8 |
| D | 1 | 52 | 522625 | 2634.98 | 802 | 778 | 198.0 |
| D | 2 | 14 | 66781 | 333.27 | 802 | 778 | 198.0 |
| D | 12 | 221 | 62045 | 309.36 | 802 | 778 | 198.0 |
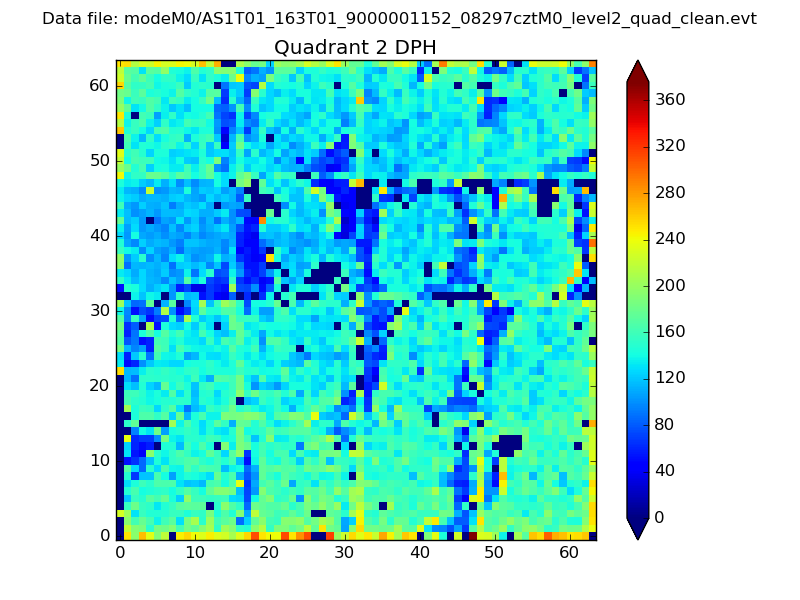
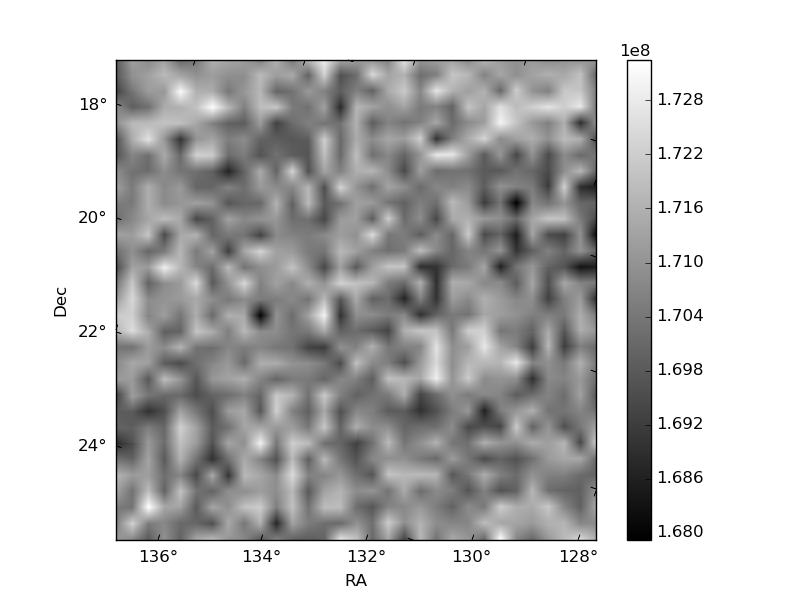
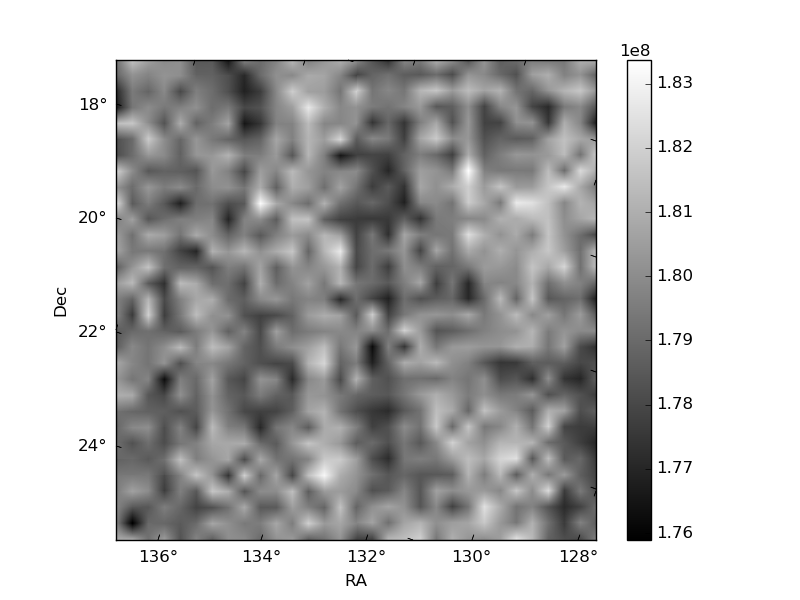
Histogram calculated using DETX and DETY for each event in the final _common_clean file
| Quadrant A |  |
 |
Quadrant B |
|---|---|---|---|
| Quadrant D | 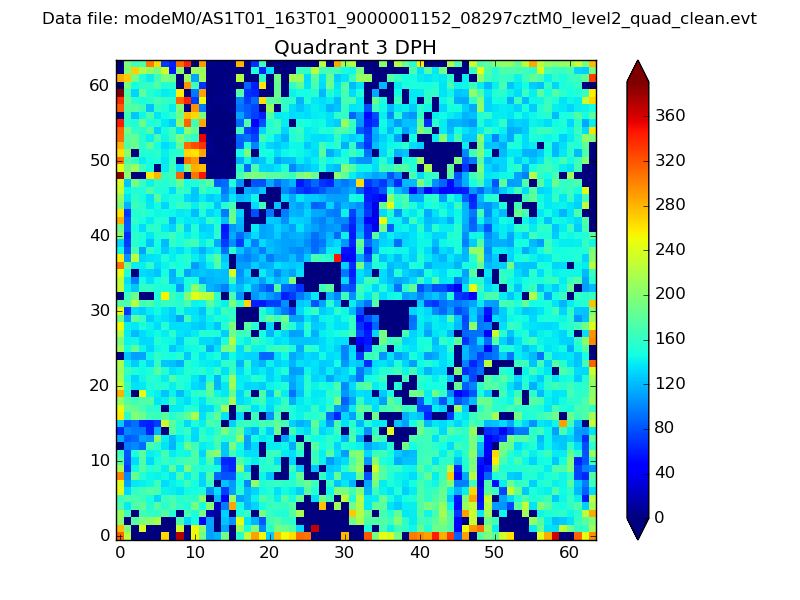 |
 |
Quadrant C |
| Plot type | Count rate plots | Images |
|---|---|---|
| Comparison with Poisson distribution Blue bars denote a histogram of data divided into 1 sec bins. Red curve is a Poisson curve with rate = median count rate of data. |
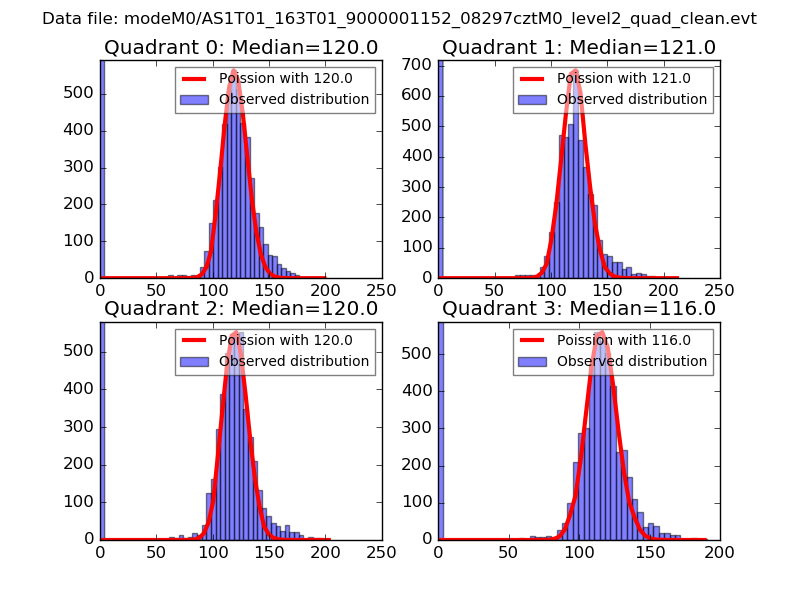 |
 |
| Quadrant-wise count rates Data is divided into 100 sec bins |
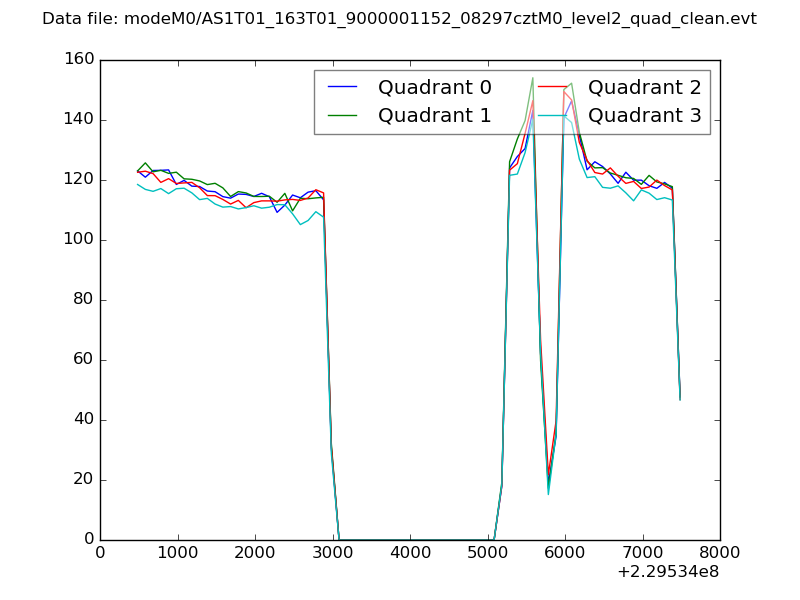 |
|
| Module-wise count rates for Quadrant A Data is divided into 100 sec bins |
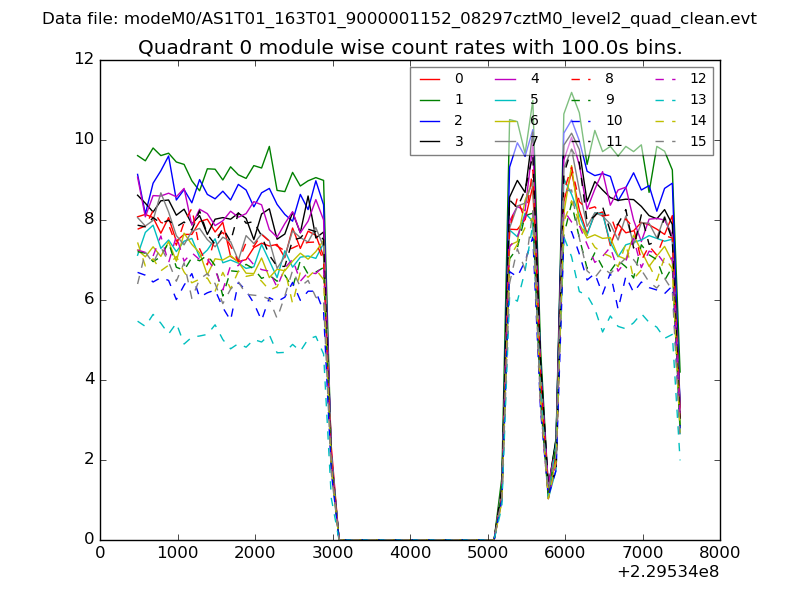 |
 |
| Module-wise count rates for Quadrant B Data is divided into 100 sec bins |
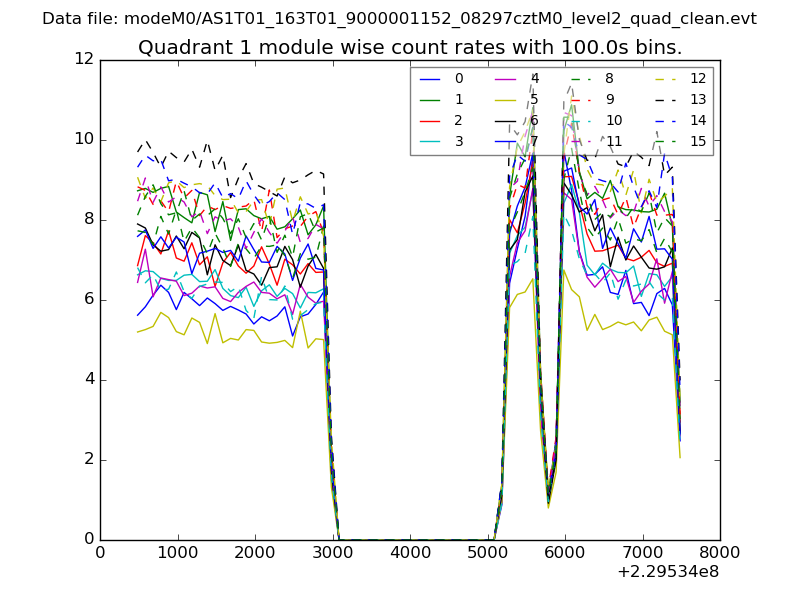 |
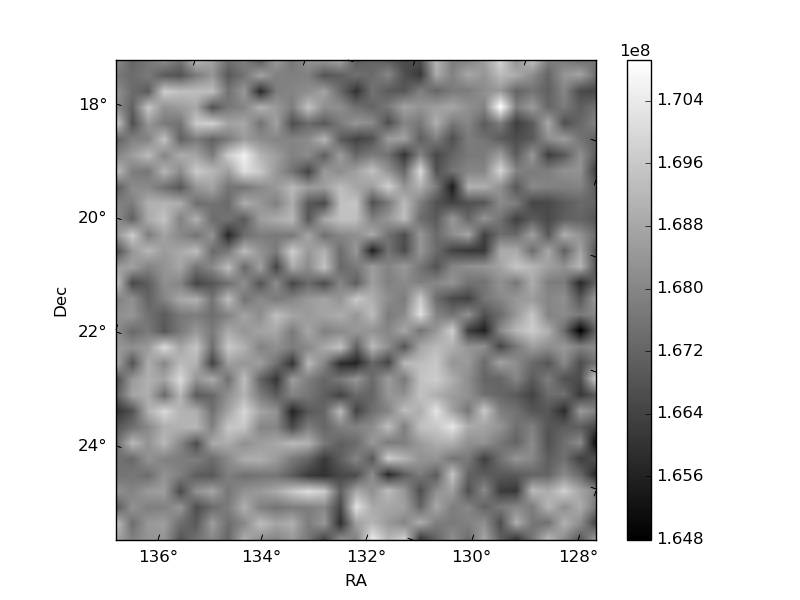 |
| Module-wise count rates for Quadrant C Data is divided into 100 sec bins |
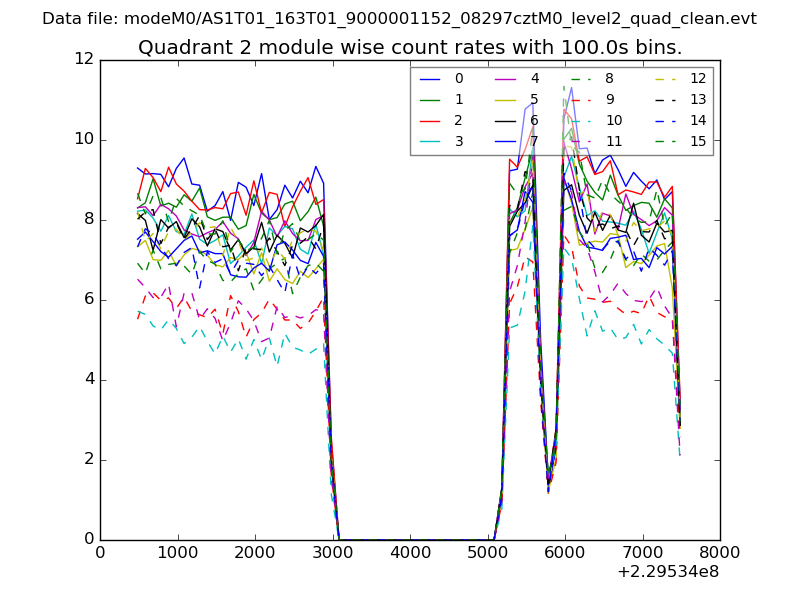 |
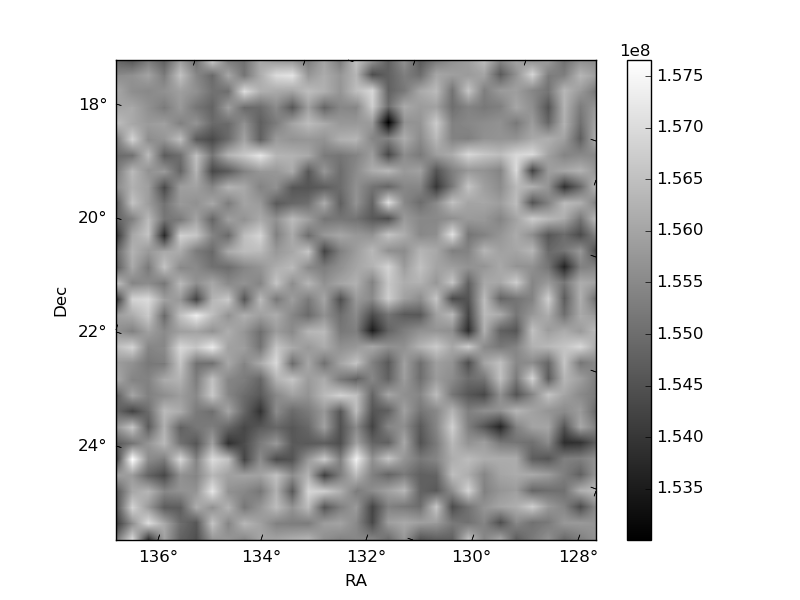 |
| Module-wise count rates for Quadrant D Data is divided into 100 sec bins |
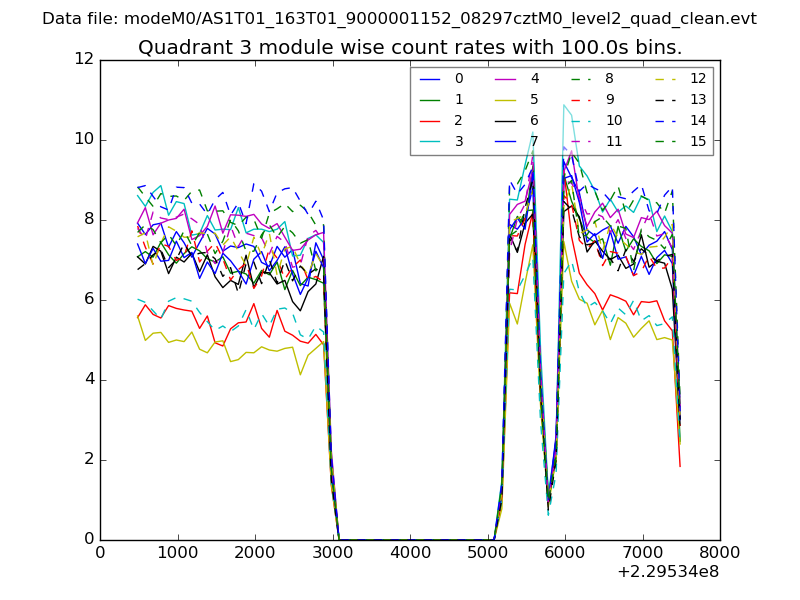 |
 |
| Parameter | Plot |
|---|---|
| CZT HV Monitor | 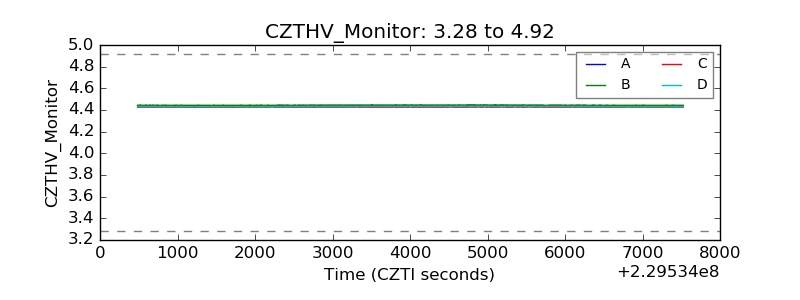 |
| D_VDD | 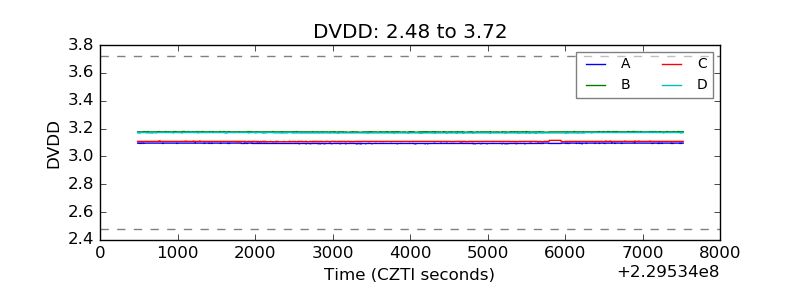 |
| Temperature 1 | 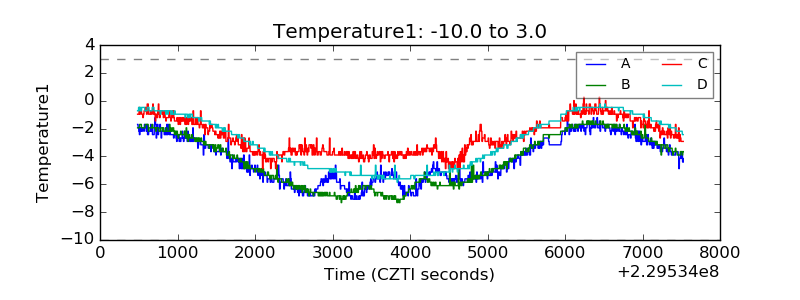 |
| Veto HV Monitor | 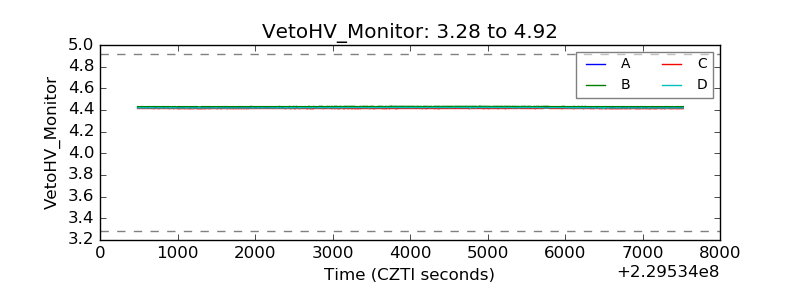 |
| Veto LLD | 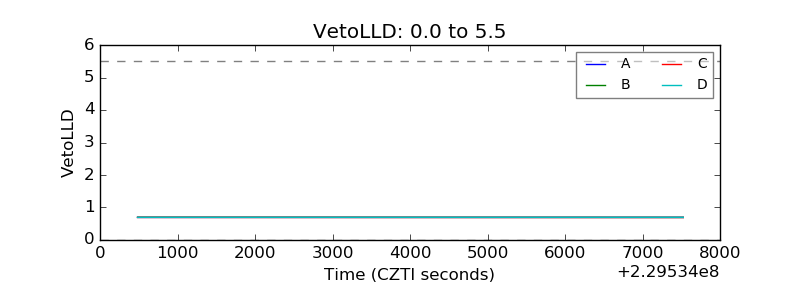 |
| Alpha Counter | 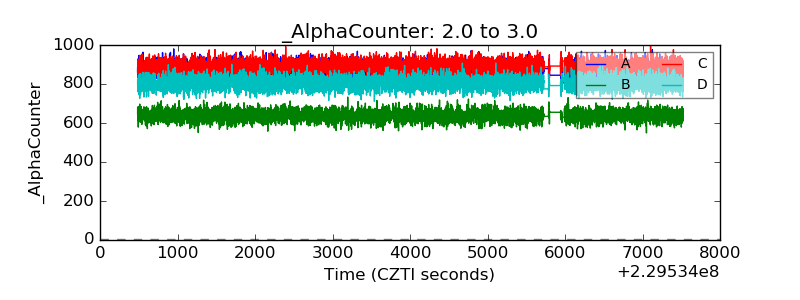 |
| _CPM_Rate | 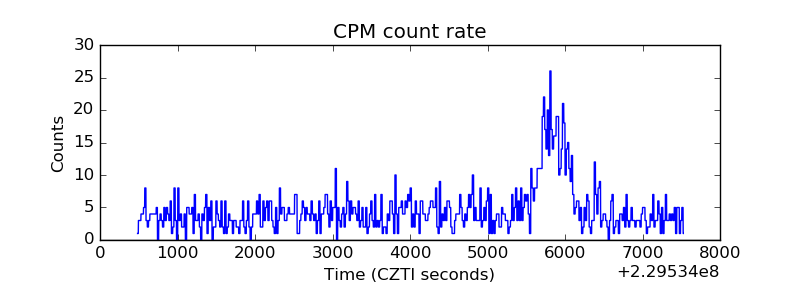 |
| CZT Counter | 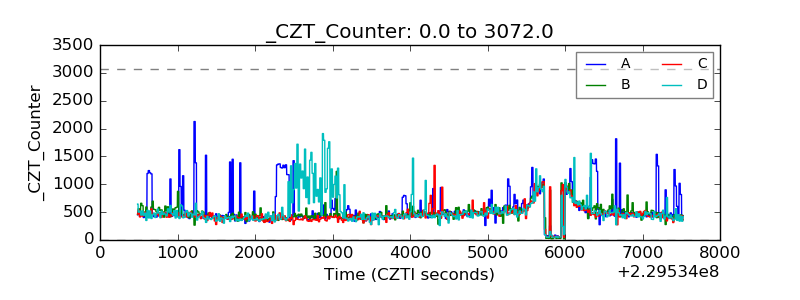 |
| +2.5 Volts monitor |  |
| +5 Volts monitor |  |
| _ROLL_ROT | 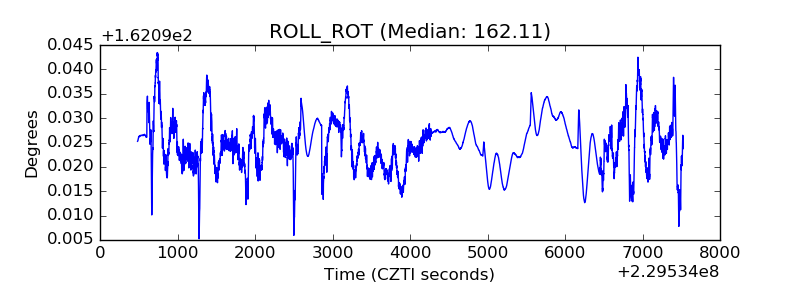 |
| _Roll_DEC | 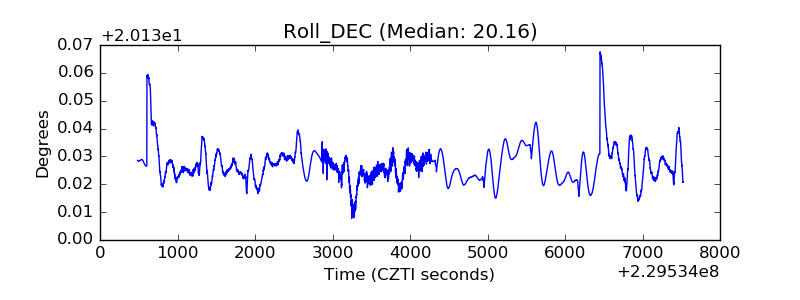 |
| _Roll_RA |  |
| Veto Counter | 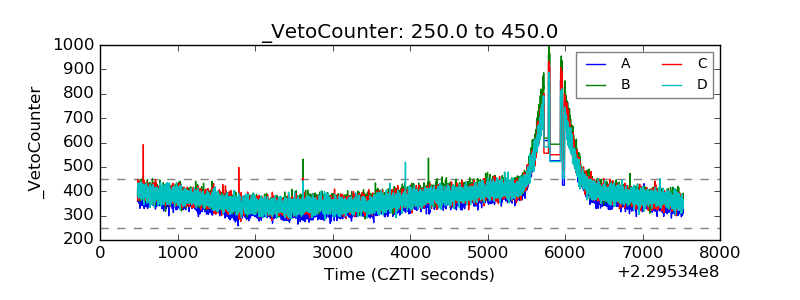 |