| Param | Original file | Final file |
|---|---|---|
| Filename | modeM0/AS1T01_163T01_9000001152_08302cztM0_level2.evt | modeM0/AS1T01_163T01_9000001152_08302cztM0_level2_quad_clean.evt |
| Size (bytes) | 187,896,960 | 48,885,120 |
| Size | 179.2 MB | 46.6 MB |
| Events in quadrant A | 1,297,670 | 325,395 |
| Events in quadrant B | 1,496,210 | 326,624 |
| Events in quadrant C | 1,262,696 | 324,182 |
| Events in quadrant D | 1,451,178 | 313,759 |
| Mode M9 | |||
|---|---|---|---|
| Quadrant | BADHDUFLAG | Total packets | Discarded packets |
| A | 0 | 7 | 0 |
| B | 0 | 7 | 0 |
| C | 0 | 7 | 0 |
| D | 0 | 7 | 0 |
| Mode M0 | |||
|---|---|---|---|
| Quadrant | BADHDUFLAG | Total packets | Discarded packets |
| A | 0 | 5498 | 1 |
| B | 0 | 6188 | 1 |
| C | 0 | 5427 | 1 |
| D | 0 | 6010 | 1 |
| Mode SS | |||
|---|---|---|---|
| Quadrant | BADHDUFLAG | Total packets | Discarded packets |
| A | 0 | 54 | 0 |
| B | 0 | 54 | 0 |
| C | 0 | 54 | 0 |
| D | 0 | 54 | 0 |
| Quadrant | Total seconds | Saturated seconds | Saturation percentage |
|---|---|---|---|
| A | 2659 | 26 | 0.977811% |
| B | 2659 | 40 | 1.504325% |
| C | 2659 | 11 | 0.413689% |
| D | 2659 | 30 | 1.128244% |
Noise dominated data is calculated using 1-second bins in cleaned event files. If a bin has >2000 counts, and if more than 50% of those come from <1% of pixels, then it is considered to be noise-dominated and hence unusable.
| Quadrant | # 1 sec bins | Bins with >0 counts | Bins with >2000 counts | High rate bins dominated by noise | Noise dominated (total time) | Noise dominated (detector-on time) | Marked lightcurve |
|---|---|---|---|---|---|---|---|
| A | 3369 | 2660 | 1 | 1 | 0.03% | 0.04% | 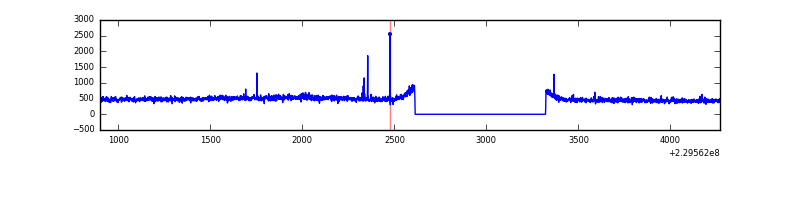 |
| B | 3369 | 2660 | 1 | 1 | 0.03% | 0.04% | 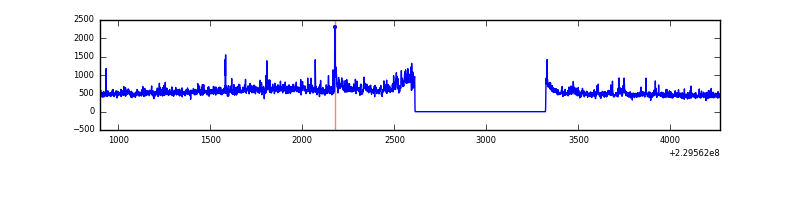 |
| C | 3369 | 2660 | 0 | 0 | 0.00% | 0.00% | 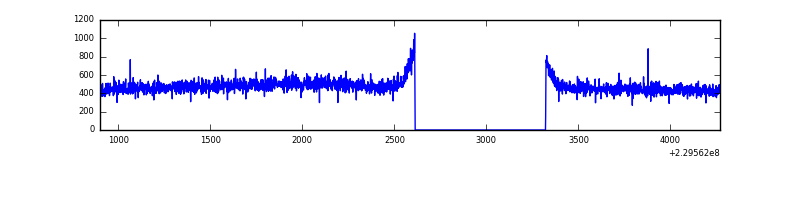 |
| D | 3369 | 2660 | 22 | 22 | 0.65% | 0.83% | 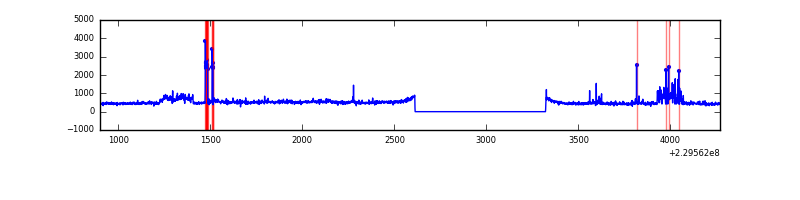 |
Top three noisy pixels from each quadrant. If the there are fewer than three noisy pixels in the level2.evt file, extra rows are filled as -1
| Pixel properties | Quadrant properties | ||||||
|---|---|---|---|---|---|---|---|
| Quadrant | DetID | PixID | Counts | Sigma | Mean | Median | Sigma |
| A | 13 | 251 | 11387 | 156.13 | 332 | 324 | 70.9 |
| A | 13 | 14 | 3648 | 46.91 | 332 | 324 | 70.9 |
| A | 0 | 226 | 3231 | 41.03 | 332 | 324 | 70.9 |
| B | 0 | 214 | 103550 | 1547.78 | 331 | 323 | 66.7 |
| B | 0 | 219 | 60307 | 899.4 | 331 | 323 | 66.7 |
| B | 0 | 230 | 12811 | 187.24 | 331 | 323 | 66.7 |
| C | 13 | 61 | 2534 | 28.71 | 323 | 325 | 76.9 |
| C | 1 | 3 | 1120 | 10.33 | 323 | 325 | 76.9 |
| C | 3 | 202 | 770 | 5.78 | 323 | 325 | 76.9 |
| D | 8 | 230 | 89504 | 1028.4 | 322 | 314 | 86.7 |
| D | 13 | 105 | 88359 | 1015.2 | 322 | 314 | 86.7 |
| D | 2 | 14 | 30234 | 344.99 | 322 | 314 | 86.7 |
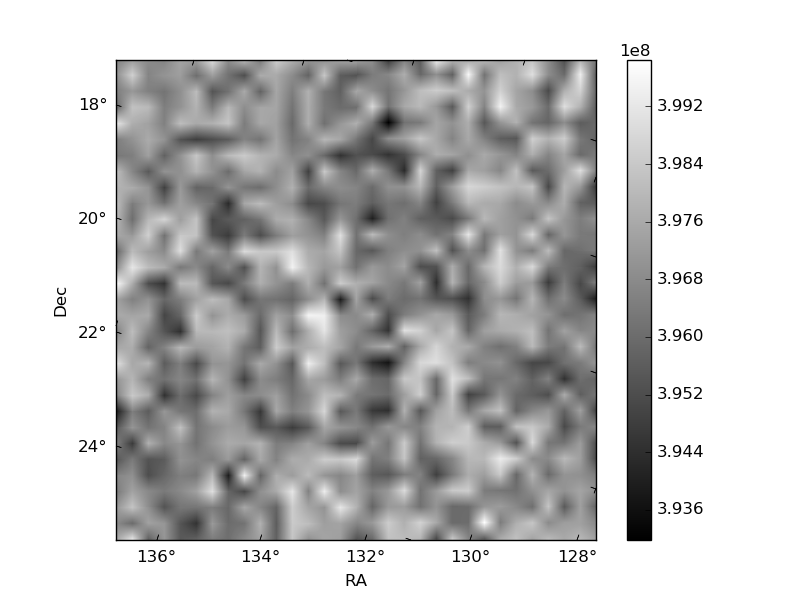
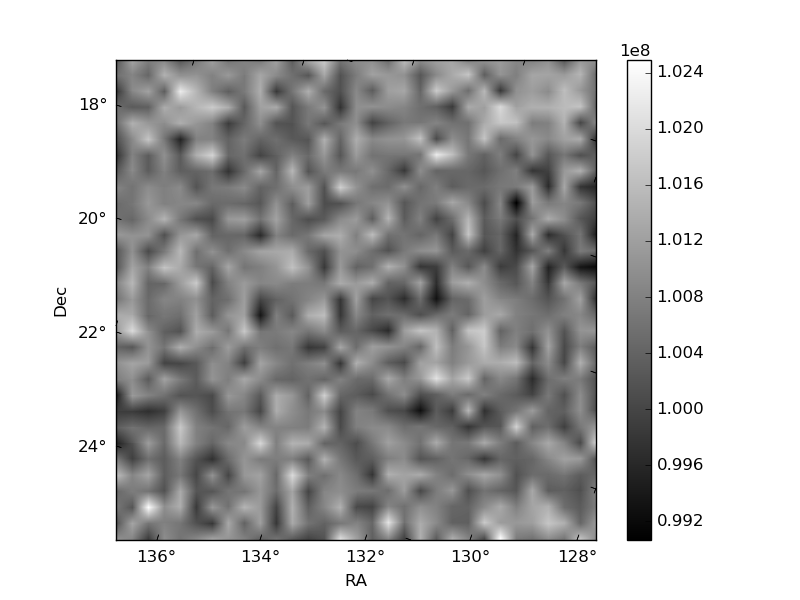
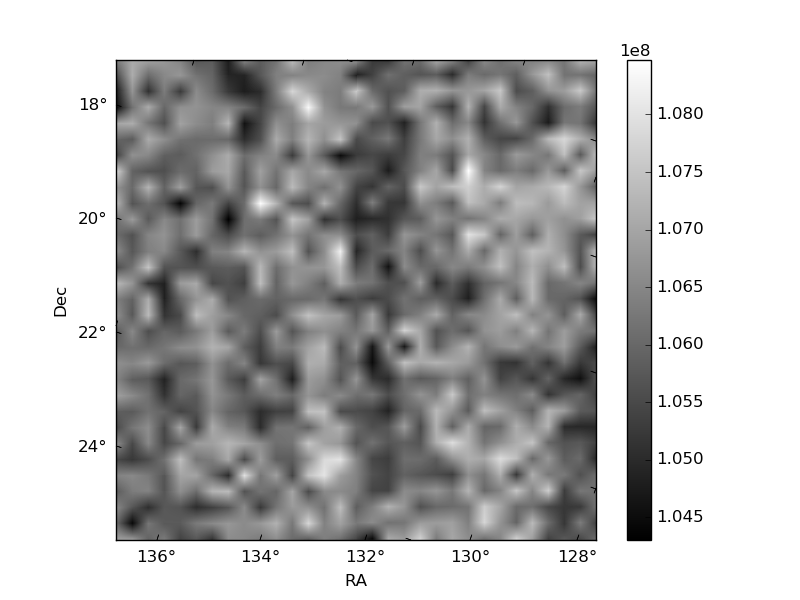
Histogram calculated using DETX and DETY for each event in the final _common_clean file
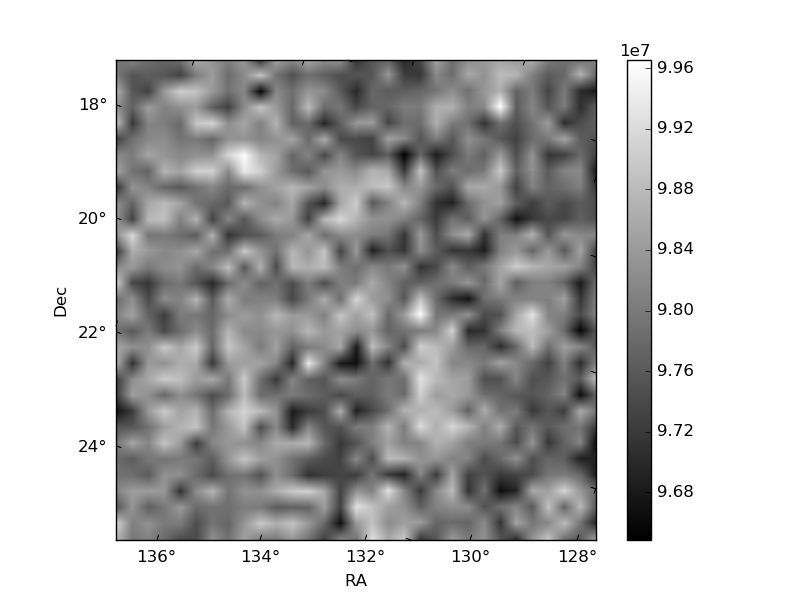
| Quadrant A | 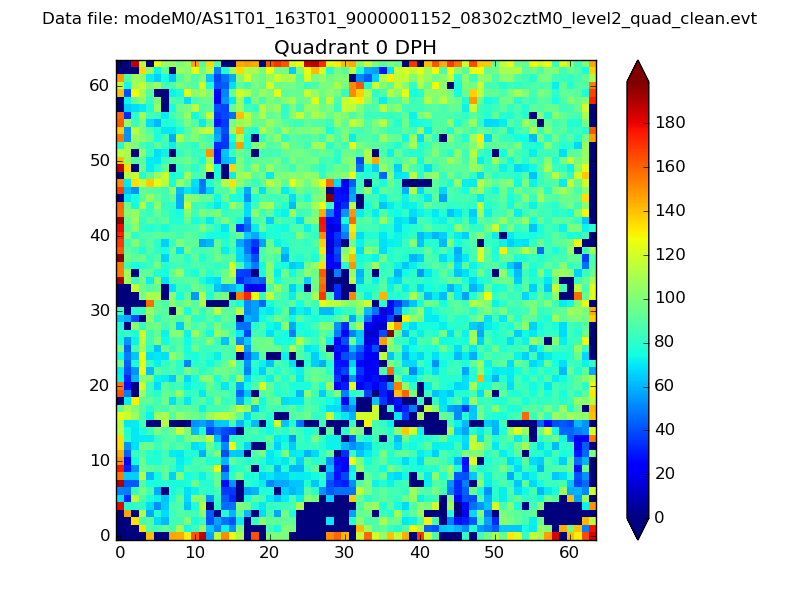 |
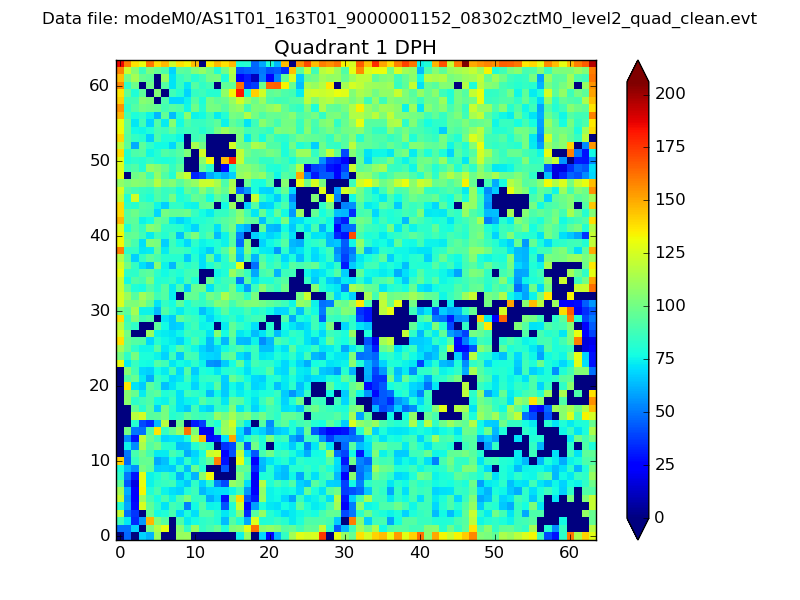 |
Quadrant B |
|---|---|---|---|
| Quadrant D | 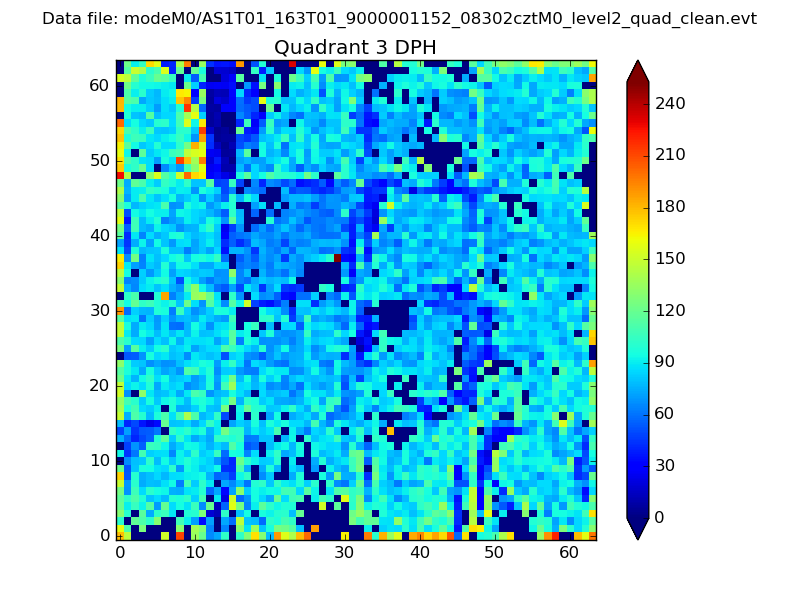 |
 |
Quadrant C |
| Plot type | Count rate plots | Images |
|---|---|---|
| Comparison with Poisson distribution Blue bars denote a histogram of data divided into 1 sec bins. Red curve is a Poisson curve with rate = median count rate of data. |
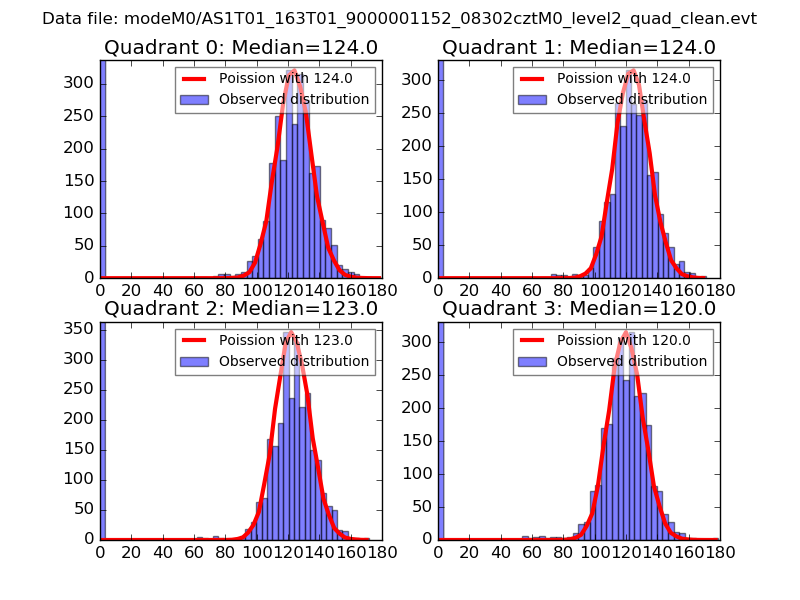 |
 |
| Quadrant-wise count rates Data is divided into 100 sec bins |
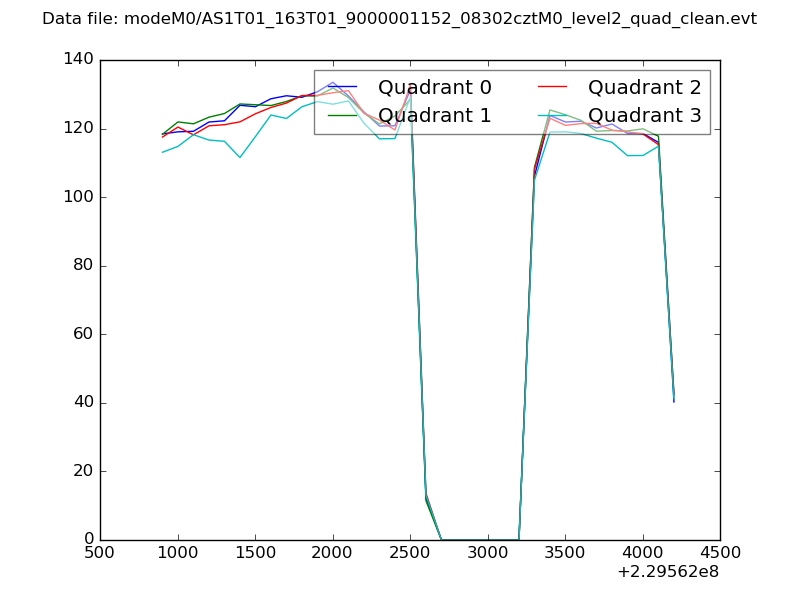 |
|
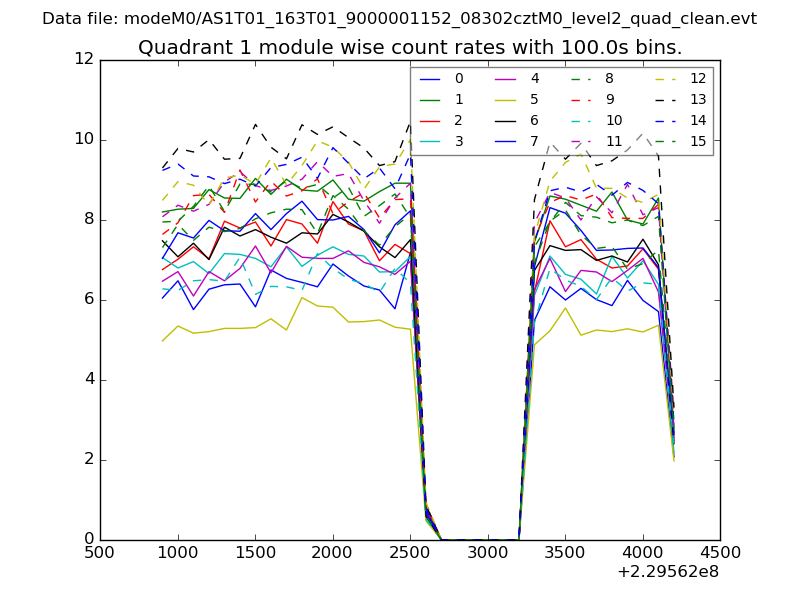
| Module-wise count rates for Quadrant A Data is divided into 100 sec bins |
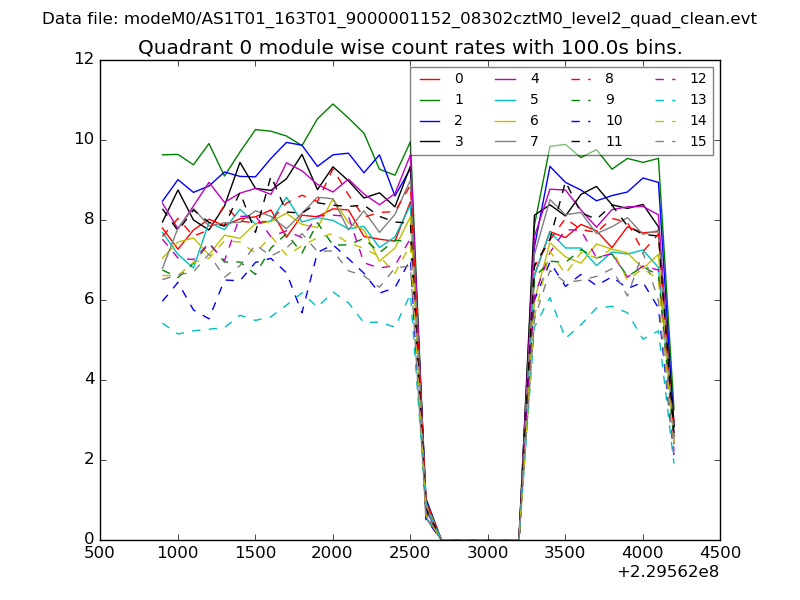 |
 |
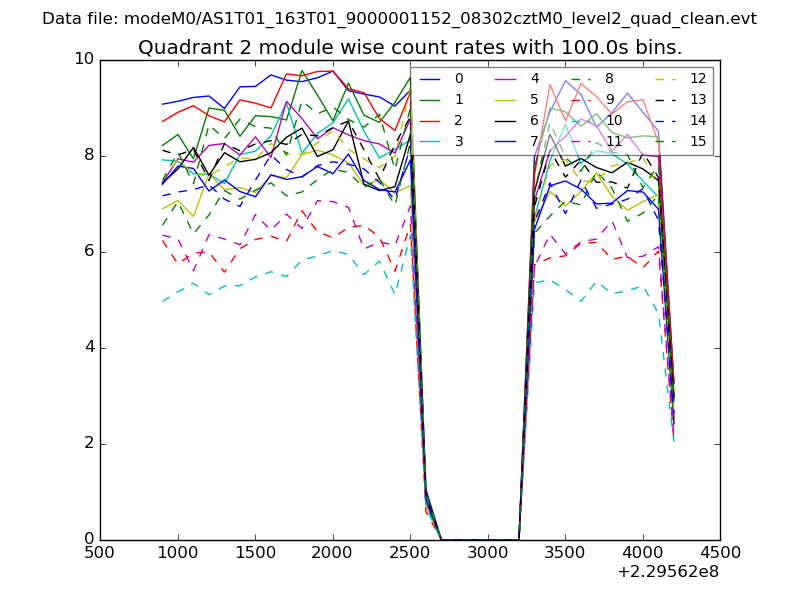
| Module-wise count rates for Quadrant B Data is divided into 100 sec bins |
 |
 |
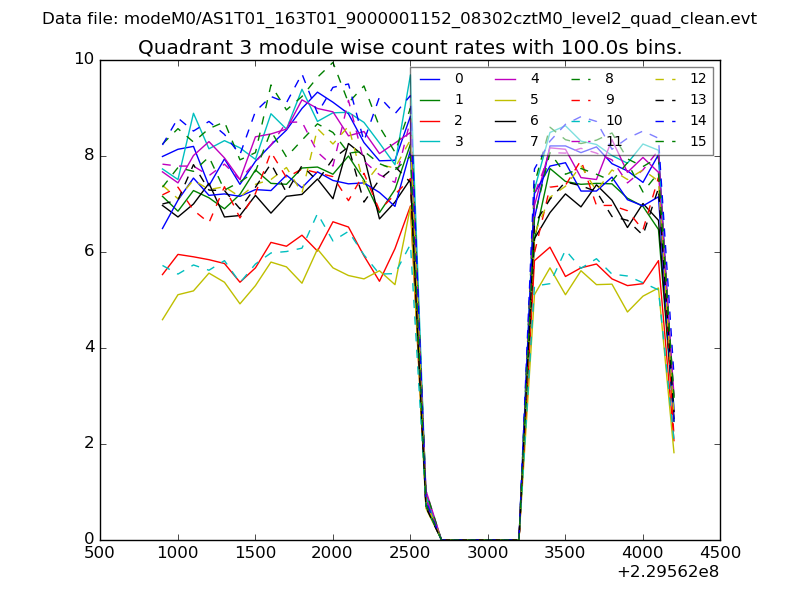
| Module-wise count rates for Quadrant C Data is divided into 100 sec bins |
 |
 |
| Module-wise count rates for Quadrant D Data is divided into 100 sec bins |
 |
 |
| Parameter | Plot |
|---|---|
| CZT HV Monitor | 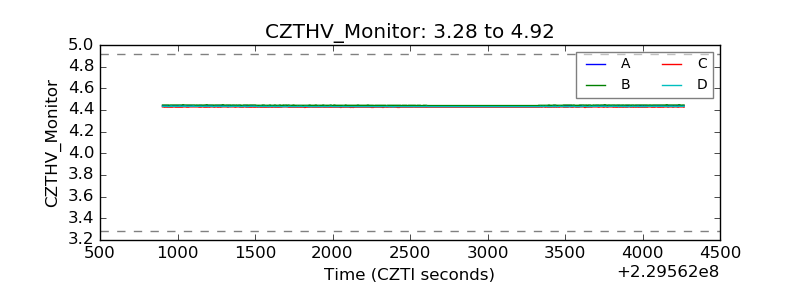 |
| D_VDD | 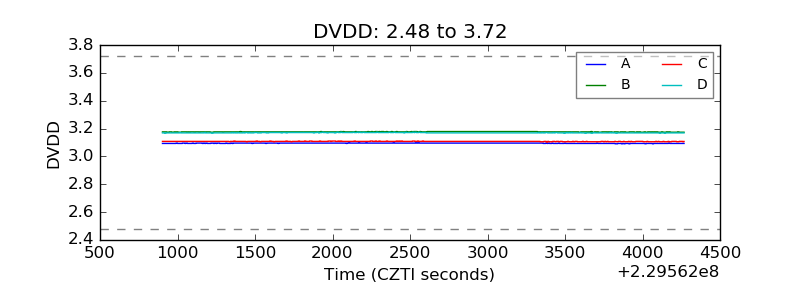 |
| Temperature 1 | 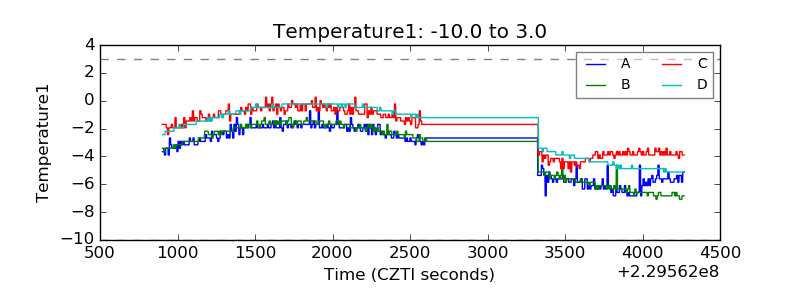 |
| Veto HV Monitor | 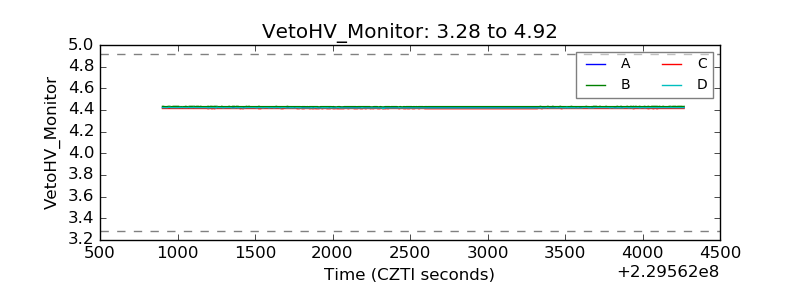 |
| Veto LLD | 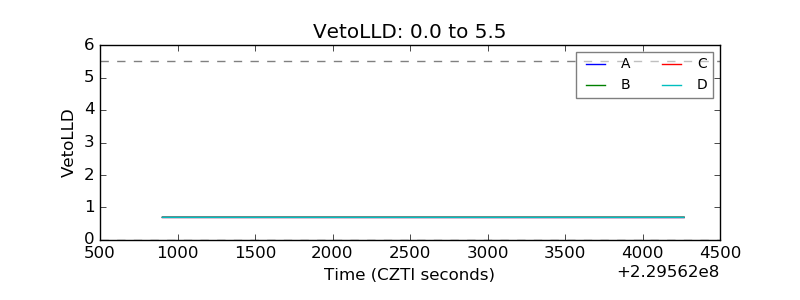 |
| Alpha Counter | 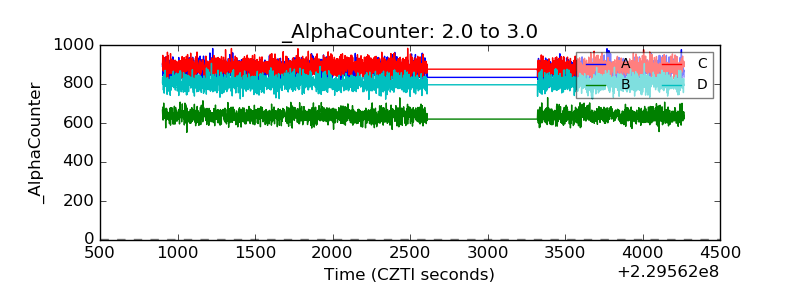 |
| _CPM_Rate | 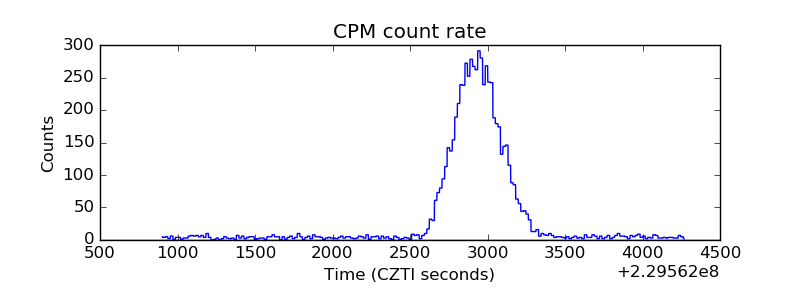 |
| CZT Counter |  |
| +2.5 Volts monitor |  |
| +5 Volts monitor |  |
| _ROLL_ROT | 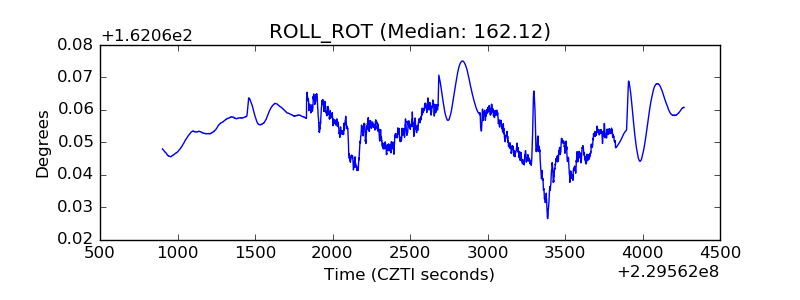 |
| _Roll_DEC | 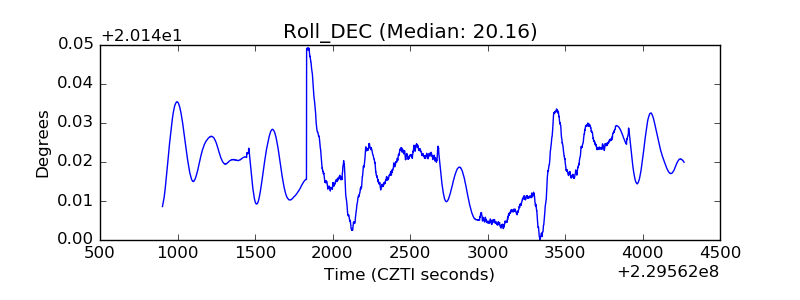 |
| _Roll_RA | 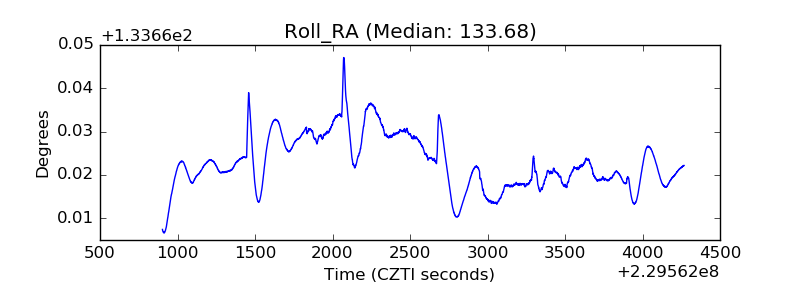 |
| Veto Counter | 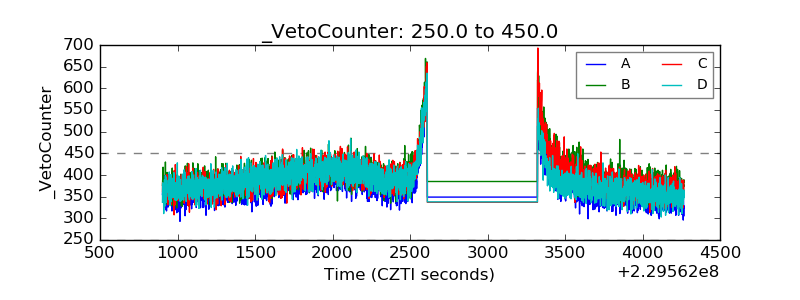 |