| Param | Original file | Final file |
|---|---|---|
| Filename | modeM0/AS1A03_093T01_9000001156cztM0_level2.fits | modeM0/AS1A03_093T01_9000001156cztM0_level2_quad_clean.evt |
| Size (bytes) | 747,524,160 | 734,673,600 |
| Size | 712.9 MB | 700.6 MB |
| Events in quadrant A | 4,250,884 | 3,857,369 |
| Events in quadrant B | 4,453,404 | 4,568,883 |
| Events in quadrant C | 4,520,602 | 4,337,501 |
| Events in quadrant D | 3,942,146 | 4,018,914 |
| Mode M9 | |||
|---|---|---|---|
| Quadrant | BADHDUFLAG | Total packets | Discarded packets |
| A | 0 | 124 | 0 |
| B | 0 | 124 | 0 |
| C | 0 | 124 | 0 |
| D | 0 | 124 | 0 |
| Mode M0 | |||
|---|---|---|---|
| Quadrant | BADHDUFLAG | Total packets | Discarded packets |
| A | 0 | 228568 | 0 |
| B | 0 | 170304 | 0 |
| C | 0 | 165650 | 0 |
| D | 0 | 169869 | 0 |
| Mode SS | |||
|---|---|---|---|
| Quadrant | BADHDUFLAG | Total packets | Discarded packets |
| A | 0 | 1624 | 0 |
| B | 0 | 1624 | 0 |
| C | 0 | 1624 | 0 |
| D | 0 | 1624 | 0 |
| Quadrant | Total seconds | Saturated seconds | Saturation percentage |
|---|---|---|---|
| A | 79746 | 9872 | 12.379304% |
| B | 79748 | 1293 | 1.621357% |
| C | 79746 | 765 | 0.959296% |
| D | 79749 | 1016 | 1.273997% |
Noise dominated data is calculated using 1-second bins in cleaned event files. If a bin has >2000 counts, and if more than 50% of those come from <1% of pixels, then it is considered to be noise-dominated and hence unusable.
| Quadrant | # 1 sec bins | Bins with >0 counts | Bins with >2000 counts | High rate bins dominated by noise | Noise dominated (total time) | Noise dominated (detector-on time) | Marked lightcurve |
|---|---|---|---|---|---|---|---|
| A | 92032 | 77880 | 0 | 0 | 0.00% | 0.00% |  |
| B | 92032 | 79744 | 0 | 0 | 0.00% | 0.00% | 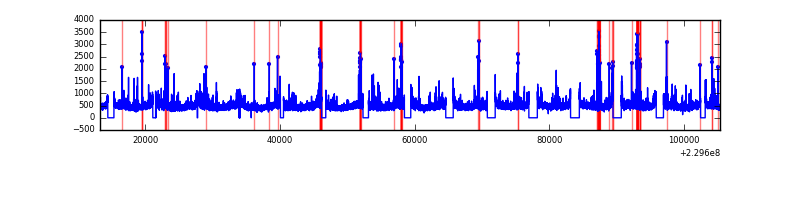 |
| C | 92032 | 79749 | 0 | 0 | 0.00% | 0.00% | 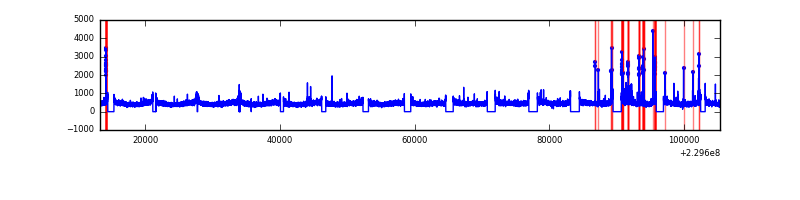 |
| D | 92032 | 79748 | 0 | 0 | 0.00% | 0.00% | 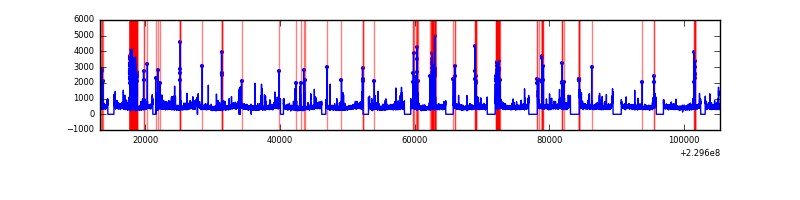 |
Top three noisy pixels from each quadrant. If the there are fewer than three noisy pixels in the level2.evt file, extra rows are filled as -1
| Pixel properties | Quadrant properties | ||||||
|---|---|---|---|---|---|---|---|
| Quadrant | DetID | PixID | Counts | Sigma | Mean | Median | Sigma |
| A | 0 | 29 | 4041 | 10.71 | 1105 | 1031 | 281.0 |
| A | 7 | 110 | 3502 | 8.79 | 1105 | 1031 | 281.0 |
| A | 0 | 30 | 3115 | 7.42 | 1105 | 1031 | 281.0 |
| B | 2 | 9 | 3903 | 11.91 | 1172 | 1113 | 234.4 |
| B | 14 | 254 | 3022 | 8.15 | 1172 | 1113 | 234.4 |
| B | 12 | 226 | 2977 | 7.95 | 1172 | 1113 | 234.4 |
| C | 1 | 80 | 3242 | 6.76 | 1193 | 1101 | 316.5 |
| C | 12 | 241 | 3235 | 6.74 | 1193 | 1101 | 316.5 |
| C | 1 | 81 | 3233 | 6.74 | 1193 | 1101 | 316.5 |
| D | 3 | 14 | 2981 | 6.5 | 1124 | 1018 | 302.0 |
| D | 7 | 5 | 2861 | 6.1 | 1124 | 1018 | 302.0 |
| D | 1 | 19 | 2842 | 6.04 | 1124 | 1018 | 302.0 |
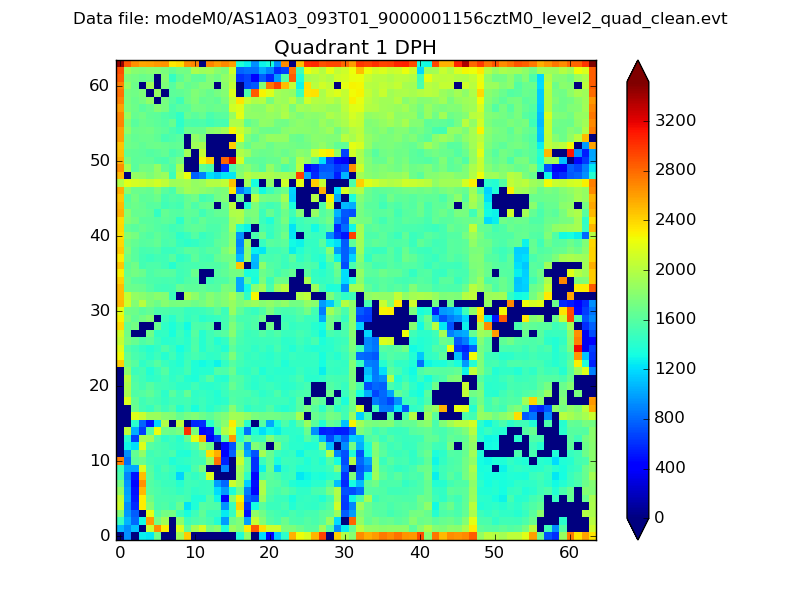
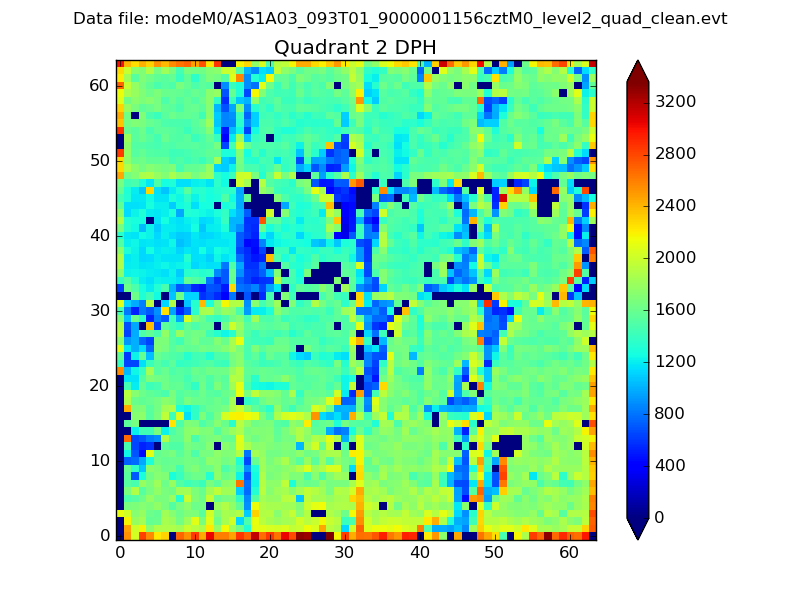
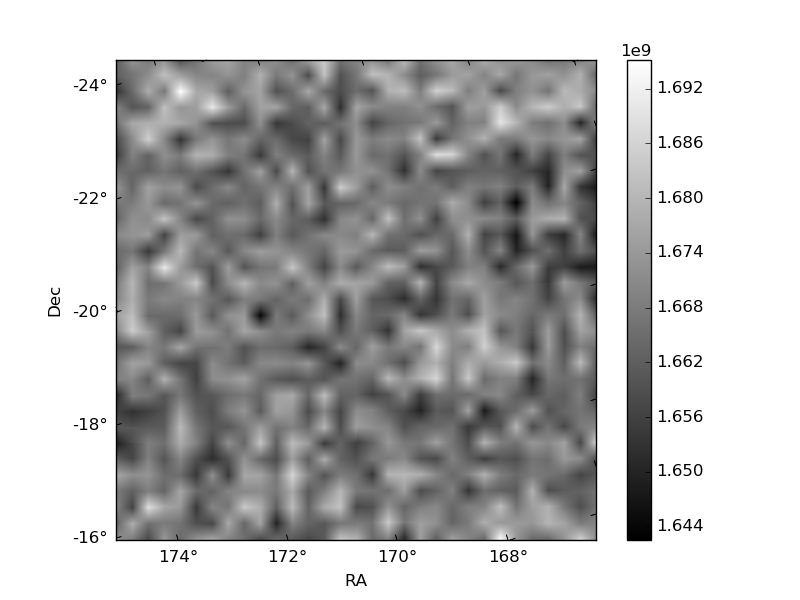
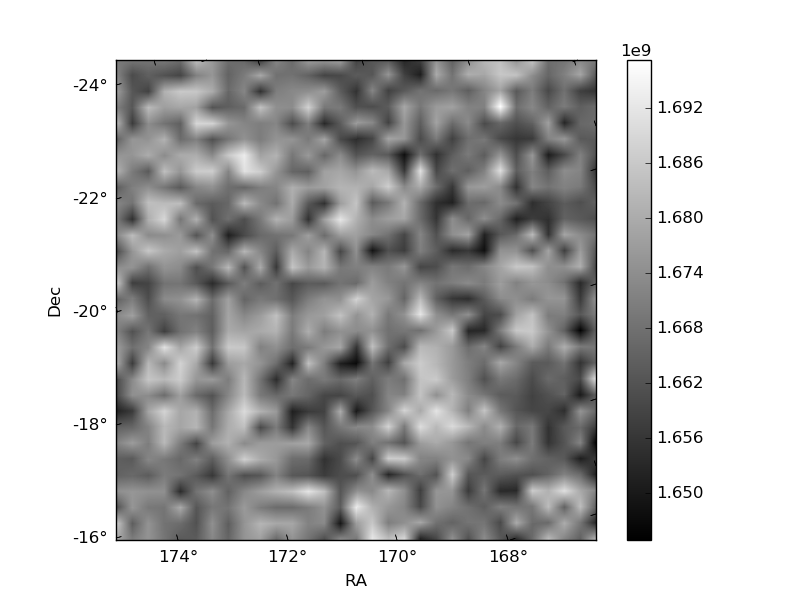
Histogram calculated using DETX and DETY for each event in the final _common_clean file
| Quadrant A | 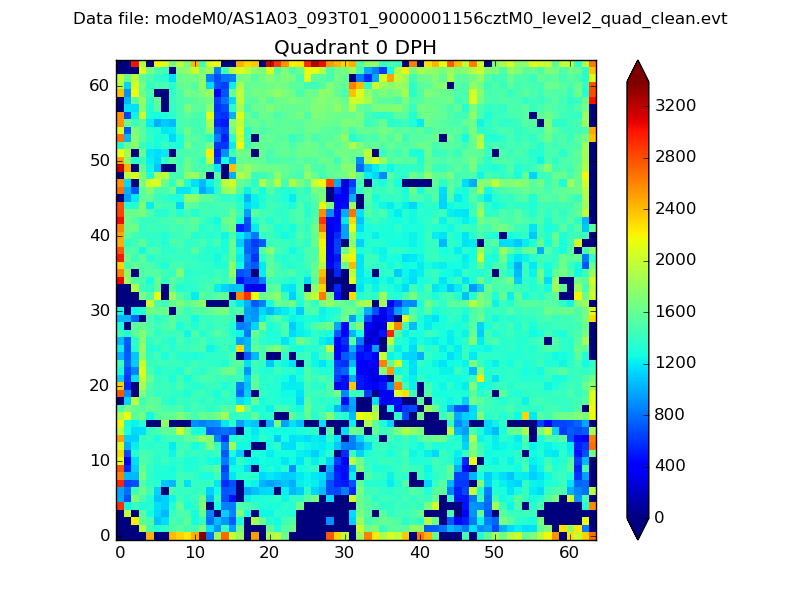 |
 |
Quadrant B |
|---|---|---|---|
| Quadrant D | 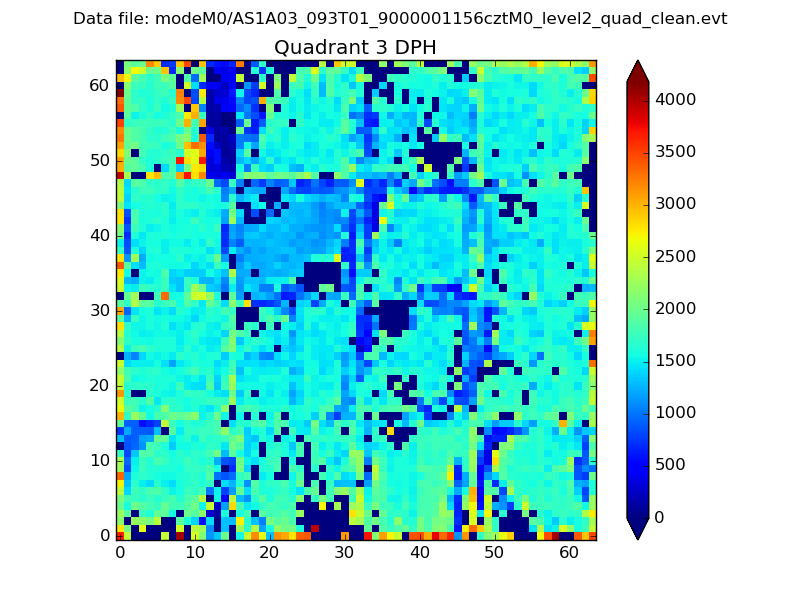 |
 |
Quadrant C |
| Plot type | Count rate plots | Images |
|---|---|---|
| Comparison with Poisson distribution Blue bars denote a histogram of data divided into 1 sec bins. Red curve is a Poisson curve with rate = median count rate of data. |
 |
 |
| Quadrant-wise count rates Data is divided into 100 sec bins |
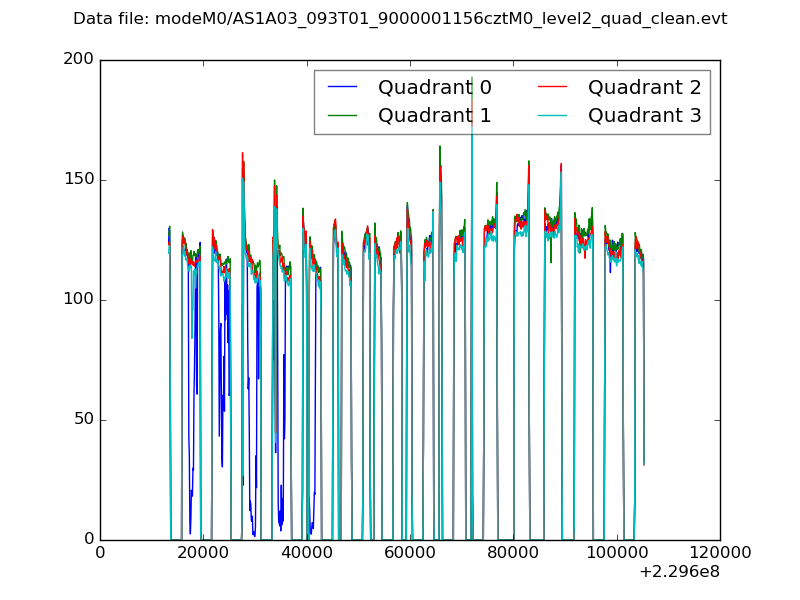 |
|
| Module-wise count rates for Quadrant A Data is divided into 100 sec bins |
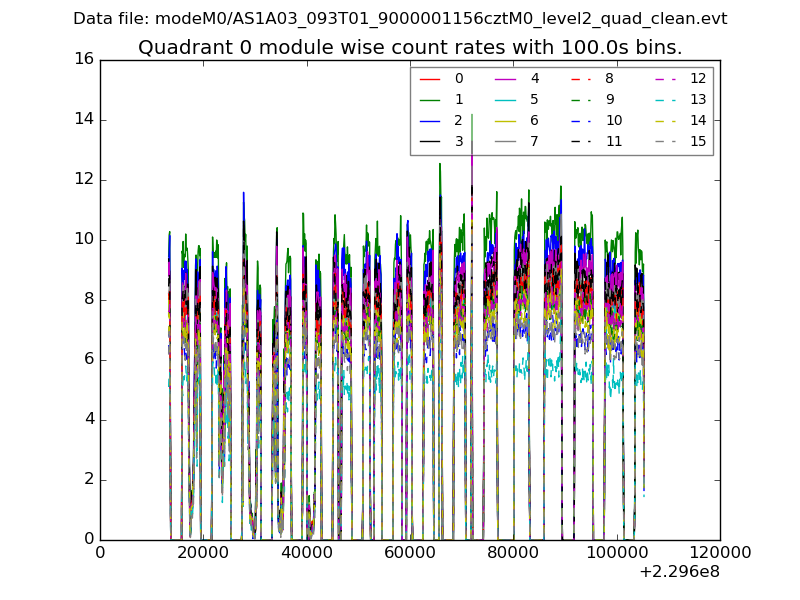 |
 |
| Module-wise count rates for Quadrant B Data is divided into 100 sec bins |
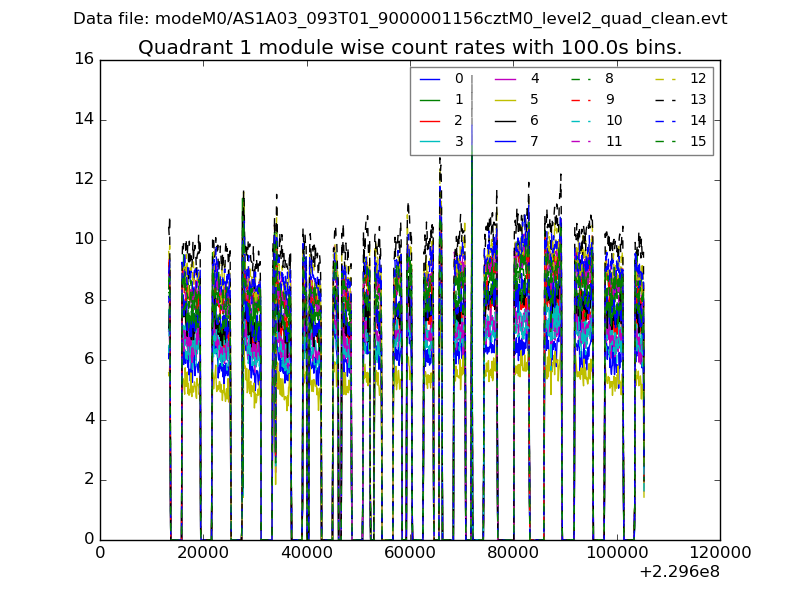 |
 |
| Module-wise count rates for Quadrant C Data is divided into 100 sec bins |
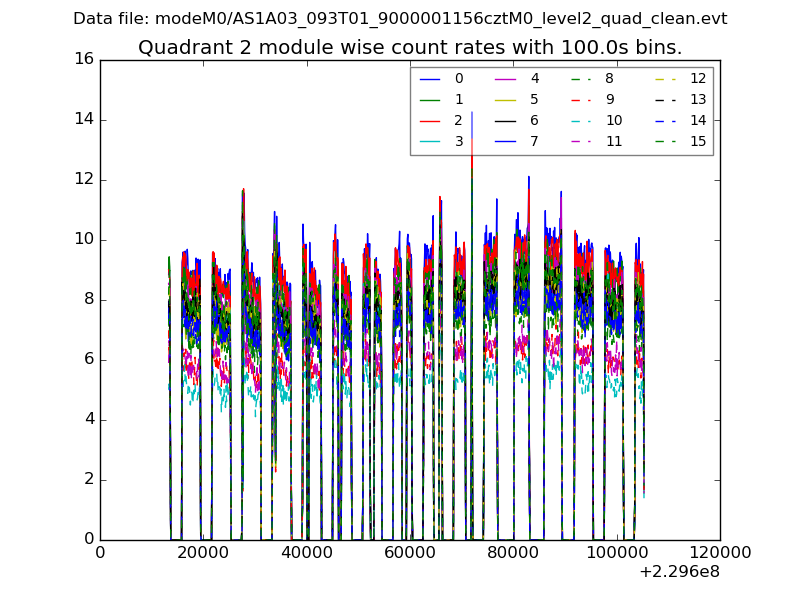 |
 |
| Module-wise count rates for Quadrant D Data is divided into 100 sec bins |
 |
 |
| Parameter | Plot |
|---|---|
| CZT HV Monitor |  |
| D_VDD | 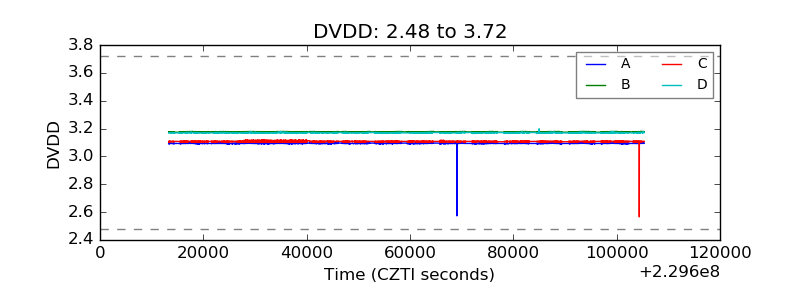 |
| Temperature 1 |  |
| Veto HV Monitor | 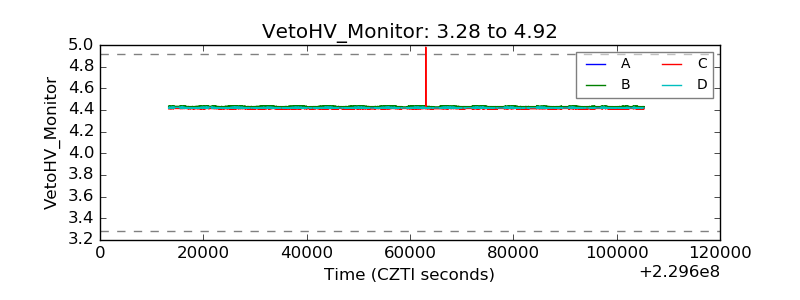 |
| Veto LLD |  |
| Alpha Counter |  |
| _CPM_Rate | 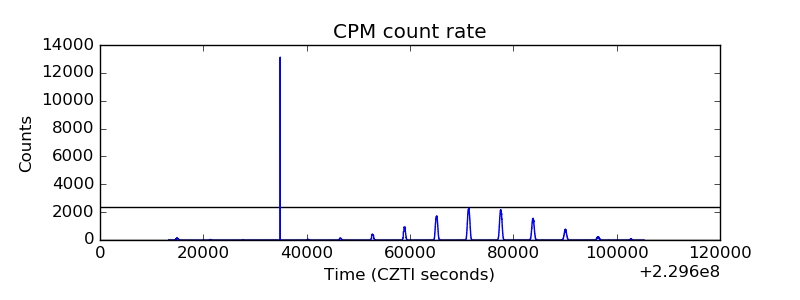 |
| CZT Counter |  |
| +2.5 Volts monitor |  |
| +5 Volts monitor |  |
| _ROLL_ROT | 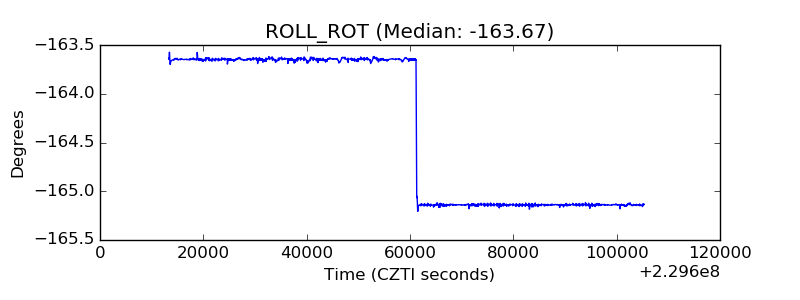 |
| _Roll_DEC | 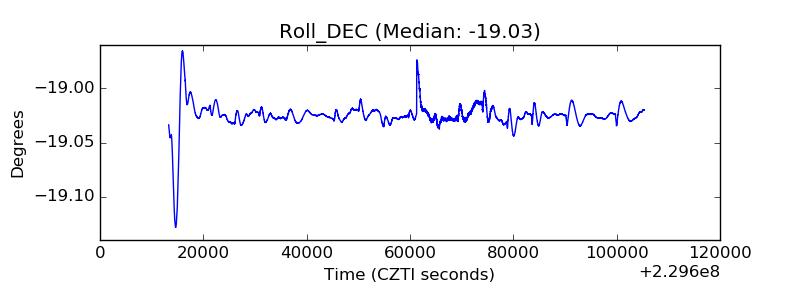 |
| _Roll_RA | 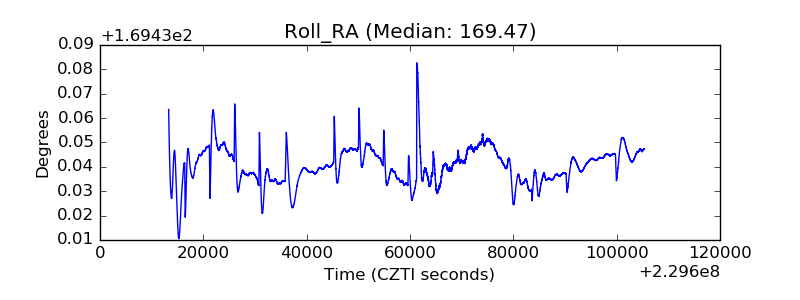 |
| Veto Counter | 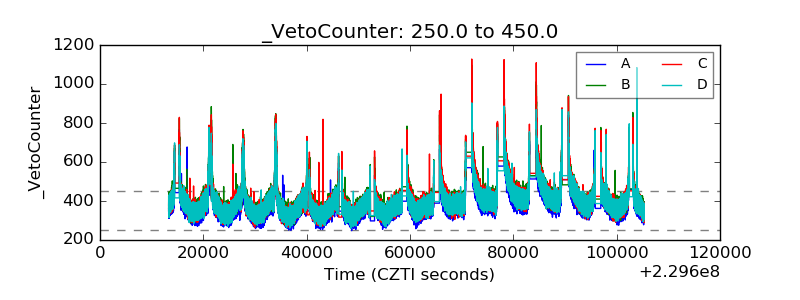 |