| Param | Original file | Final file |
|---|---|---|
| Filename | modeM0/AS1A03_093T01_9000001156_08310cztM0_level2.evt | modeM0/AS1A03_093T01_9000001156_08310cztM0_level2_quad_clean.evt |
| Size (bytes) | 189,558,720 | 25,479,360 |
| Size | 180.8 MB | 24.3 MB |
| Events in quadrant A | 1,623,912 | 146,692 |
| Events in quadrant B | 1,328,574 | 150,709 |
| Events in quadrant C | 1,305,825 | 147,992 |
| Events in quadrant D | 1,308,622 | 144,225 |
| Mode M9 | |||
|---|---|---|---|
| Quadrant | BADHDUFLAG | Total packets | Discarded packets |
| A | 0 | 9 | 0 |
| B | 0 | 9 | 0 |
| C | 0 | 9 | 0 |
| D | 0 | 9 | 0 |
| Mode M0 | |||
|---|---|---|---|
| Quadrant | BADHDUFLAG | Total packets | Discarded packets |
| A | 0 | 6507 | 2 |
| B | 0 | 5428 | 1 |
| C | 0 | 5458 | 1 |
| D | 0 | 5501 | 1 |
| Mode SS | |||
|---|---|---|---|
| Quadrant | BADHDUFLAG | Total packets | Discarded packets |
| A | 0 | 54 | 0 |
| B | 0 | 54 | 0 |
| C | 0 | 54 | 0 |
| D | 0 | 54 | 0 |
| Quadrant | Total seconds | Saturated seconds | Saturation percentage |
|---|---|---|---|
| A | 2522 | 116 | 4.599524% |
| B | 2522 | 89 | 3.528945% |
| C | 2522 | 71 | 2.815226% |
| D | 2522 | 64 | 2.537669% |
Noise dominated data is calculated using 1-second bins in cleaned event files. If a bin has >2000 counts, and if more than 50% of those come from <1% of pixels, then it is considered to be noise-dominated and hence unusable.
| Quadrant | # 1 sec bins | Bins with >0 counts | Bins with >2000 counts | High rate bins dominated by noise | Noise dominated (total time) | Noise dominated (detector-on time) | Marked lightcurve |
|---|---|---|---|---|---|---|---|
| A | 3437 | 2523 | 0 | 0 | 0.00% | 0.00% | 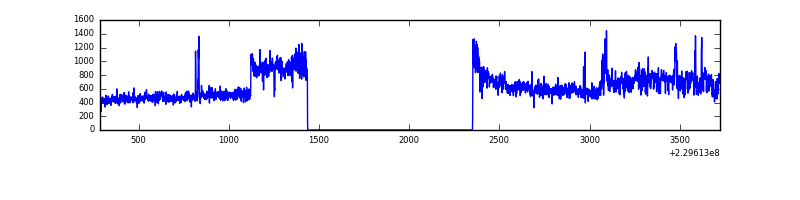 |
| B | 3437 | 2522 | 1 | 1 | 0.03% | 0.04% | 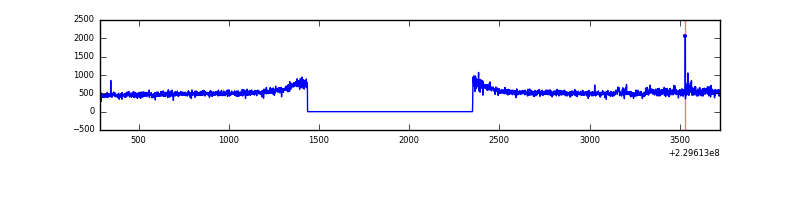 |
| C | 3437 | 2523 | 14 | 14 | 0.41% | 0.55% | 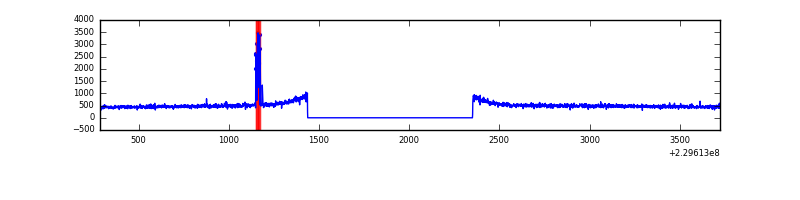 |
| D | 3437 | 2523 | 4 | 4 | 0.12% | 0.16% | 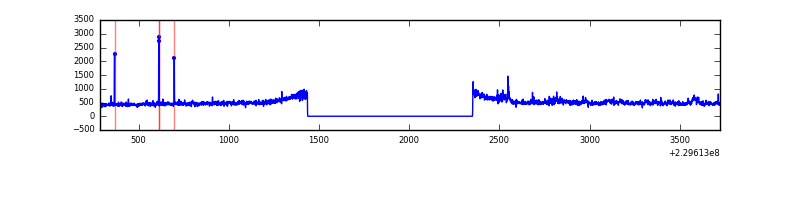 |
Top three noisy pixels from each quadrant. If the there are fewer than three noisy pixels in the level2.evt file, extra rows are filled as -1
| Pixel properties | Quadrant properties | ||||||
|---|---|---|---|---|---|---|---|
| Quadrant | DetID | PixID | Counts | Sigma | Mean | Median | Sigma |
| A | 0 | 23 | 207226 | 2981.76 | 329 | 321 | 69.4 |
| A | 14 | 111 | 114802 | 1649.82 | 329 | 321 | 69.4 |
| A | 0 | 226 | 16835 | 237.99 | 329 | 321 | 69.4 |
| B | 0 | 214 | 29409 | 438.34 | 332 | 324 | 66.4 |
| B | 12 | 111 | 7222 | 103.96 | 332 | 324 | 66.4 |
| B | 11 | 111 | 5810 | 82.68 | 332 | 324 | 66.4 |
| C | 9 | 54 | 49030 | 638.18 | 321 | 322 | 76.3 |
| C | 13 | 61 | 2425 | 27.55 | 321 | 322 | 76.3 |
| C | 9 | 68 | 1142 | 10.74 | 321 | 322 | 76.3 |
| D | 13 | 169 | 30053 | 367.36 | 321 | 312 | 81.0 |
| D | 12 | 221 | 18286 | 222.01 | 321 | 312 | 81.0 |
| D | 2 | 136 | 14961 | 180.94 | 321 | 312 | 81.0 |
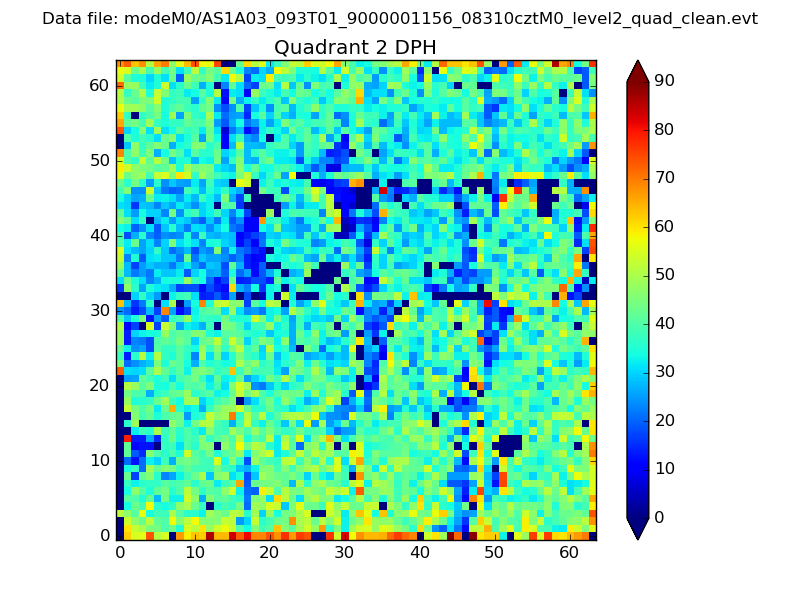
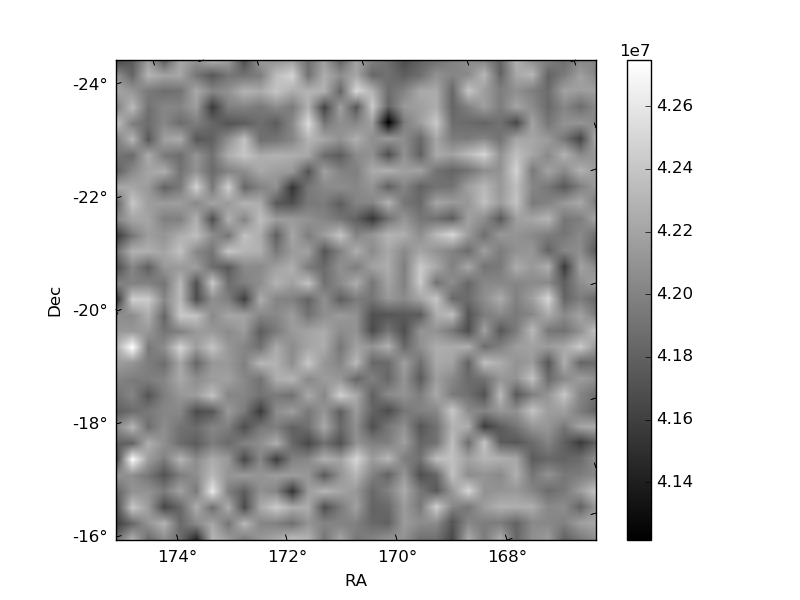
Histogram calculated using DETX and DETY for each event in the final _common_clean file
| Quadrant A |  |
 |
Quadrant B |
|---|---|---|---|
| Quadrant D | 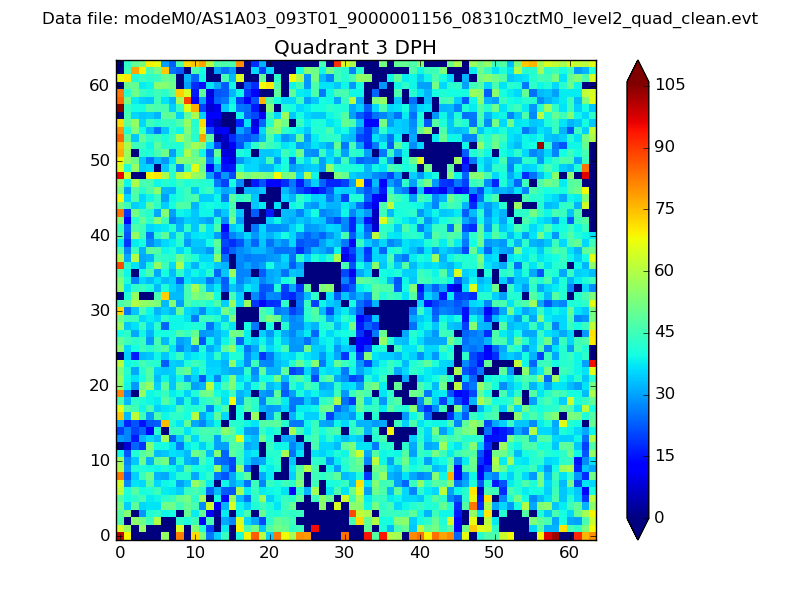 |
 |
Quadrant C |
| Plot type | Count rate plots | Images |
|---|---|---|
| Comparison with Poisson distribution Blue bars denote a histogram of data divided into 1 sec bins. Red curve is a Poisson curve with rate = median count rate of data. |
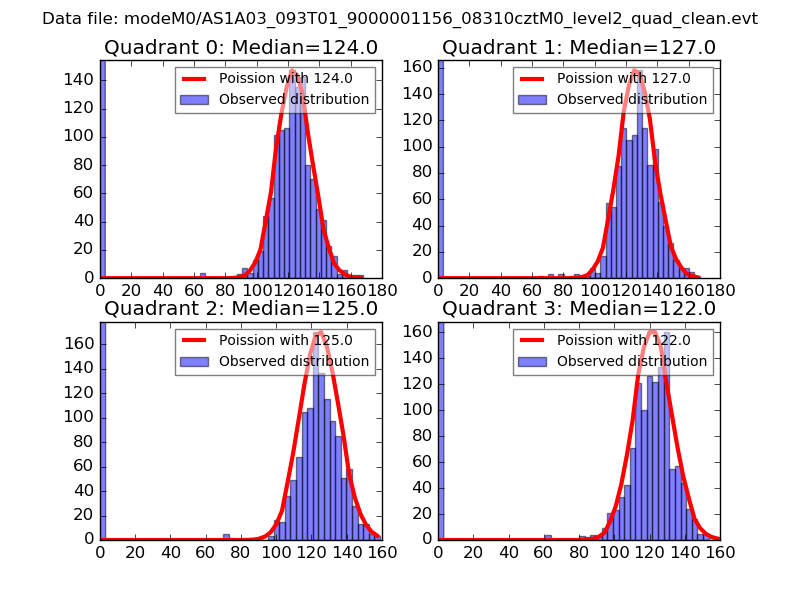 |
 |
| Quadrant-wise count rates Data is divided into 100 sec bins |
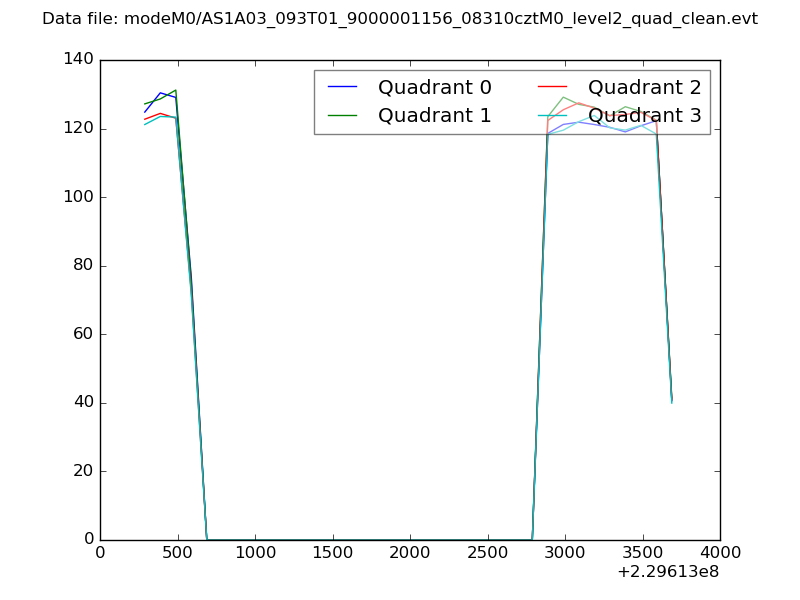 |
|
| Module-wise count rates for Quadrant A Data is divided into 100 sec bins |
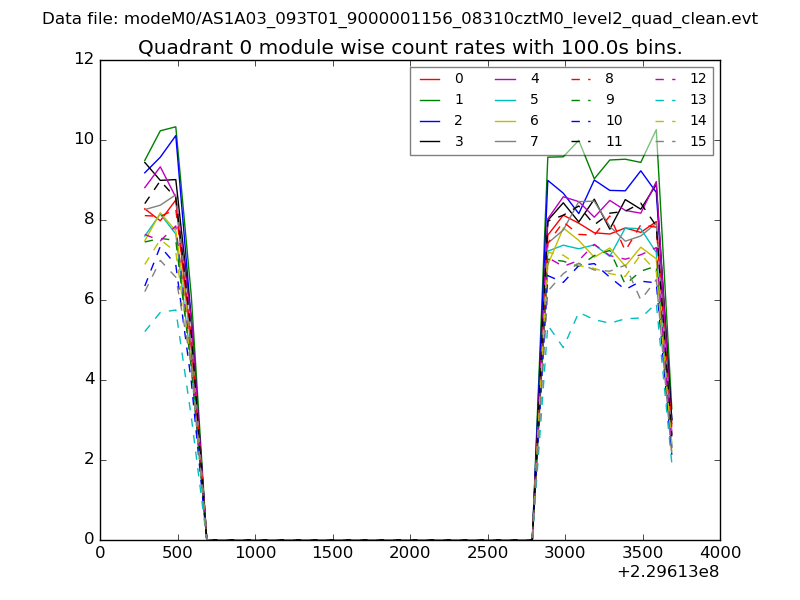 |
 |
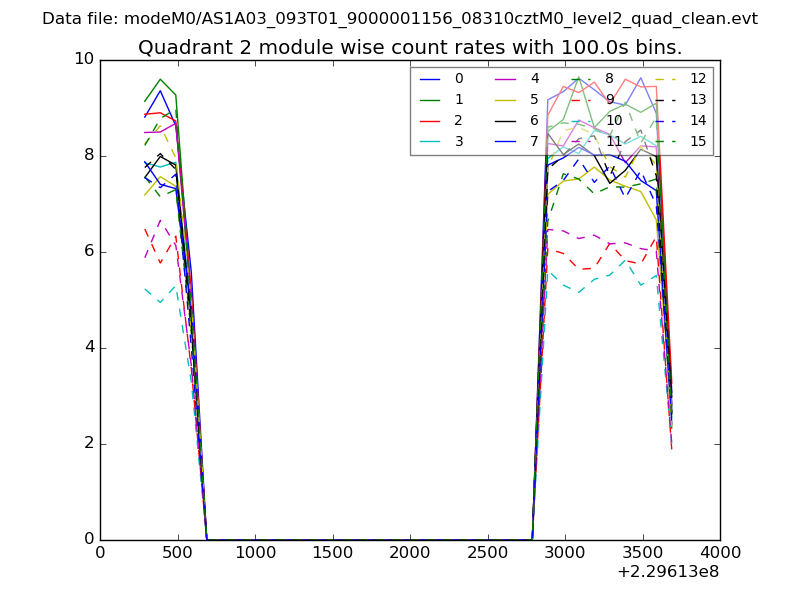
| Module-wise count rates for Quadrant B Data is divided into 100 sec bins |
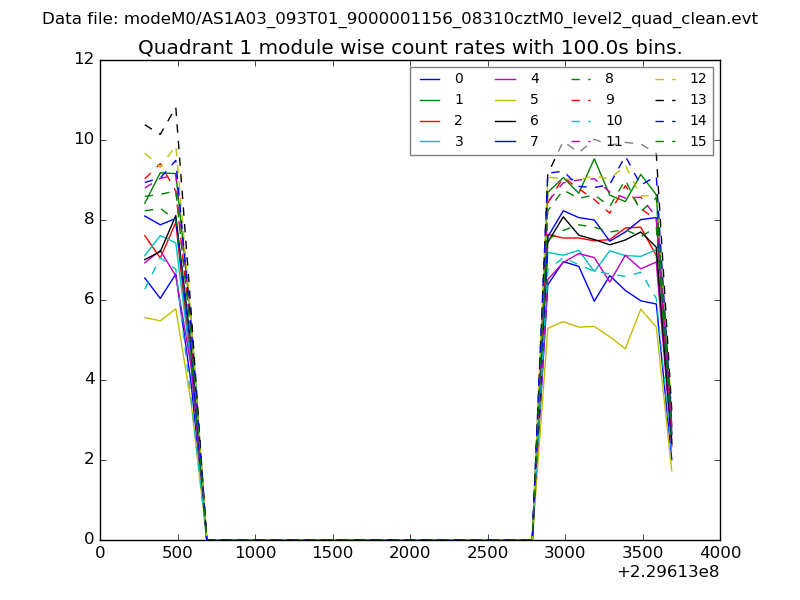 |
 |
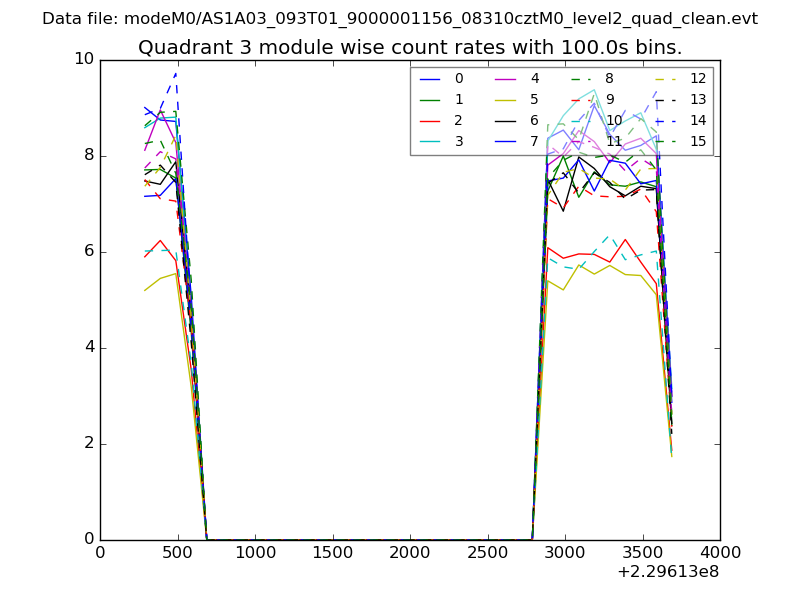
| Module-wise count rates for Quadrant C Data is divided into 100 sec bins |
 |
 |
| Module-wise count rates for Quadrant D Data is divided into 100 sec bins |
 |
 |
| Parameter | Plot |
|---|---|
| CZT HV Monitor | 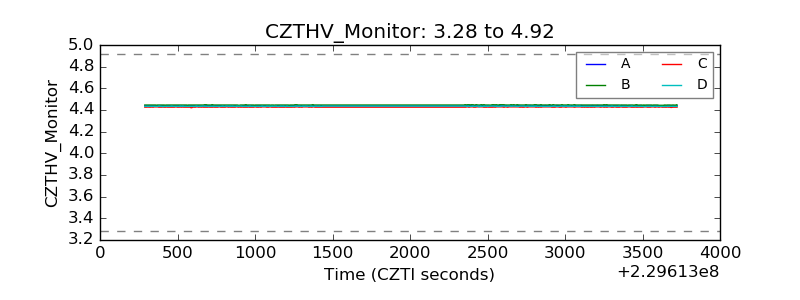 |
| D_VDD | 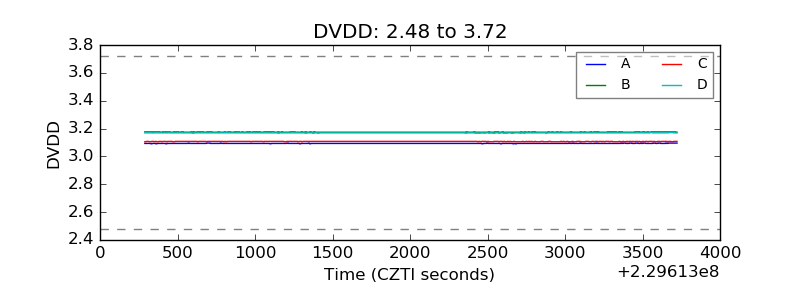 |
| Temperature 1 | 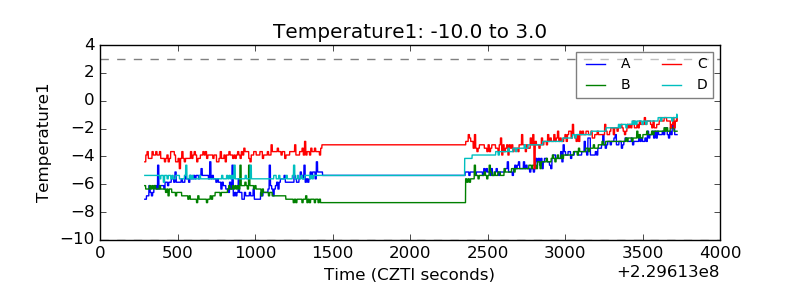 |
| Veto HV Monitor | 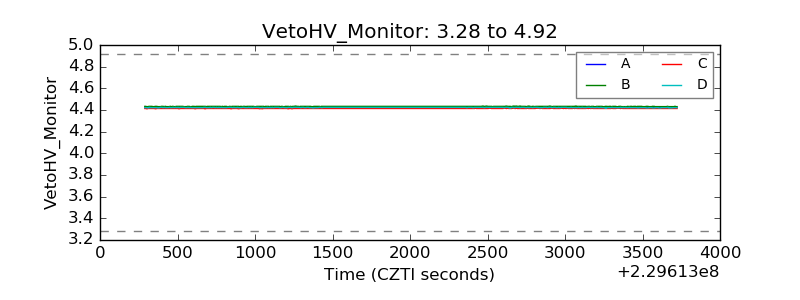 |
| Veto LLD | 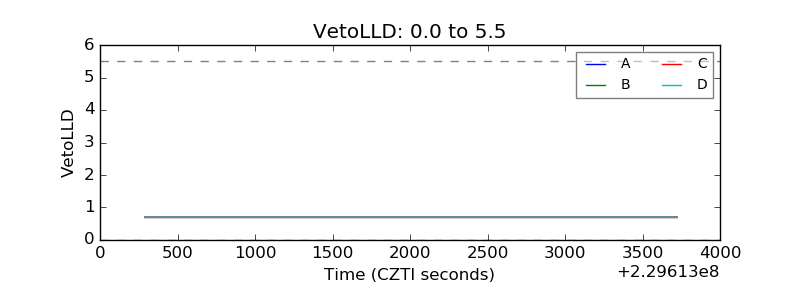 |
| Alpha Counter | 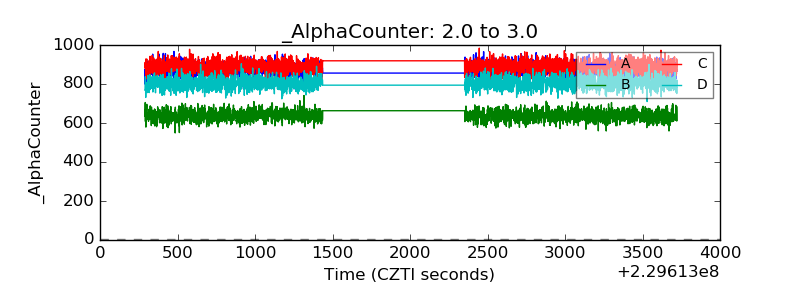 |
| _CPM_Rate | 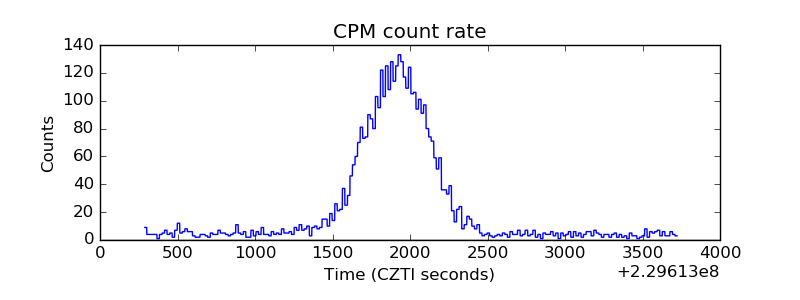 |
| CZT Counter | 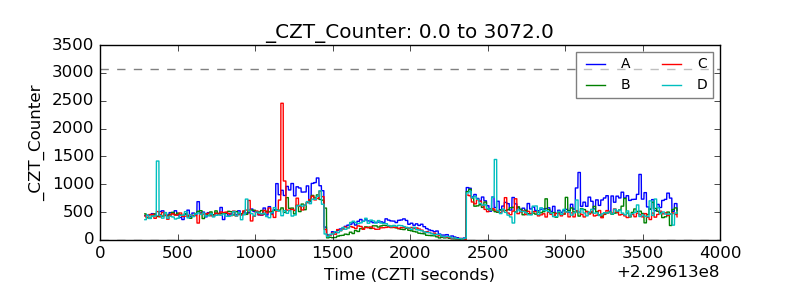 |
| +2.5 Volts monitor |  |
| +5 Volts monitor | 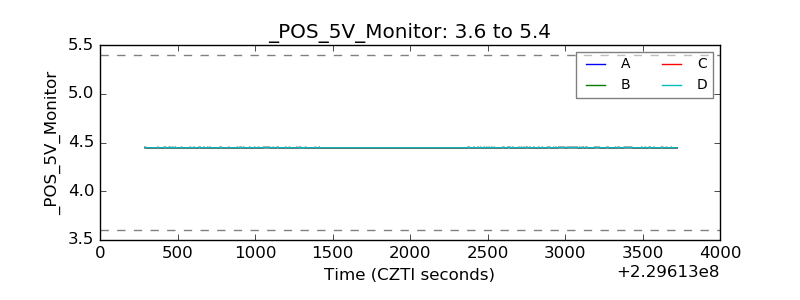 |
| _ROLL_ROT | 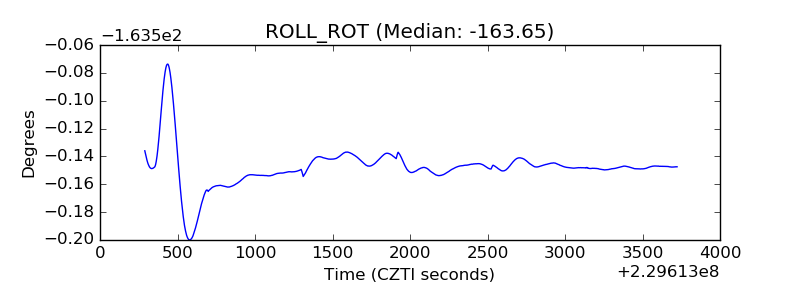 |
| _Roll_DEC | 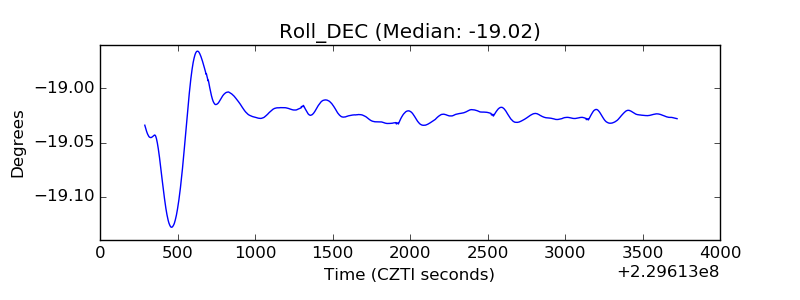 |
| _Roll_RA | 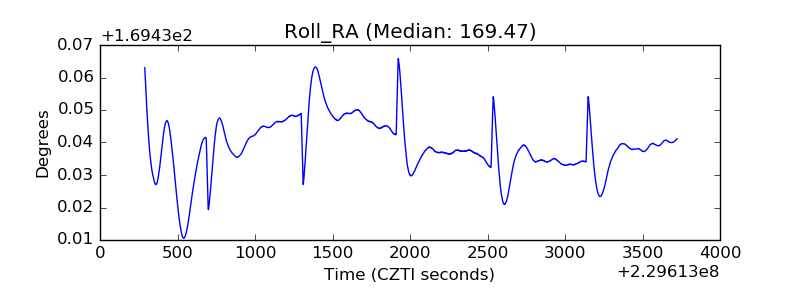 |
| Veto Counter | 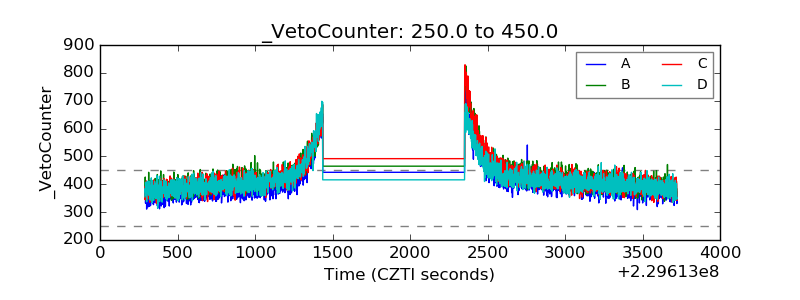 |