| Param | Original file | Final file |
|---|---|---|
| Filename | modeM0/AS1A03_093T01_9000001156_08311cztM0_level2.evt | modeM0/AS1A03_093T01_9000001156_08311cztM0_level2_quad_clean.evt |
| Size (bytes) | 611,084,160 | 86,091,840 |
| Size | 582.8 MB | 82.1 MB |
| Events in quadrant A | 7,886,888 | 446,484 |
| Events in quadrant B | 3,340,881 | 580,484 |
| Events in quadrant C | 2,981,607 | 571,325 |
| Events in quadrant D | 3,849,887 | 548,056 |
| Mode M9 | |||
|---|---|---|---|
| Quadrant | BADHDUFLAG | Total packets | Discarded packets |
| A | 0 | 4 | 0 |
| B | 0 | 4 | 0 |
| C | 0 | 4 | 0 |
| D | 0 | 4 | 0 |
| Mode M0 | |||
|---|---|---|---|
| Quadrant | BADHDUFLAG | Total packets | Discarded packets |
| A | 0 | 28034 | 2 |
| B | 0 | 14192 | 1 |
| C | 0 | 13574 | 1 |
| D | 0 | 15971 | 1 |
| Mode SS | |||
|---|---|---|---|
| Quadrant | BADHDUFLAG | Total packets | Discarded packets |
| A | 0 | 134 | 0 |
| B | 0 | 134 | 0 |
| C | 0 | 134 | 0 |
| D | 0 | 134 | 0 |
| Quadrant | Total seconds | Saturated seconds | Saturation percentage |
|---|---|---|---|
| A | 6596 | 1981 | 30.033354% |
| B | 6596 | 165 | 2.501516% |
| C | 6596 | 71 | 1.076410% |
| D | 6596 | 254 | 3.850819% |
Noise dominated data is calculated using 1-second bins in cleaned event files. If a bin has >2000 counts, and if more than 50% of those come from <1% of pixels, then it is considered to be noise-dominated and hence unusable.
| Quadrant | # 1 sec bins | Bins with >0 counts | Bins with >2000 counts | High rate bins dominated by noise | Noise dominated (total time) | Noise dominated (detector-on time) | Marked lightcurve |
|---|---|---|---|---|---|---|---|
| A | 7040 | 6596 | 1518 | 1518 | 21.56% | 23.01% | 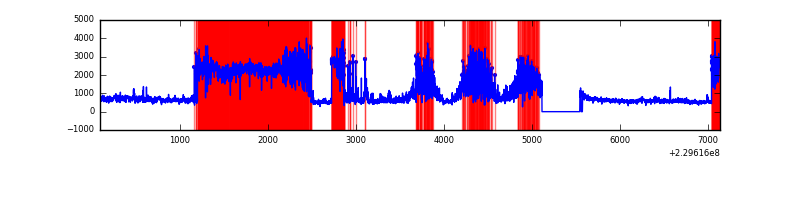 |
| B | 7041 | 6597 | 8 | 8 | 0.11% | 0.12% | 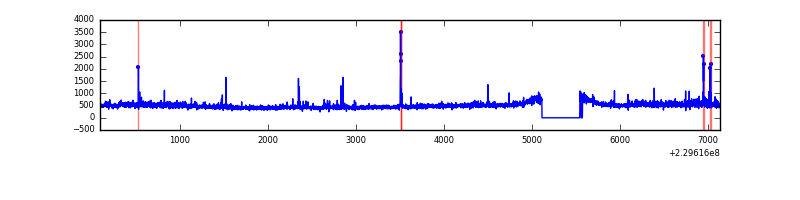 |
| C | 7041 | 6598 | 0 | 0 | 0.00% | 0.00% | 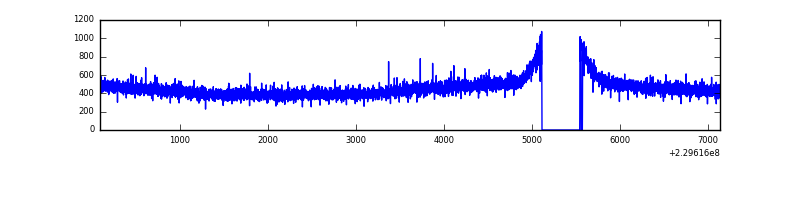 |
| D | 7041 | 6597 | 170 | 170 | 2.41% | 2.58% | 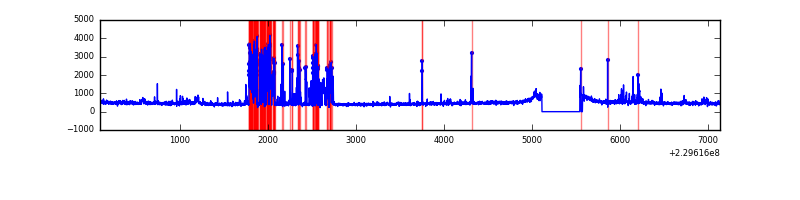 |
Top three noisy pixels from each quadrant. If the there are fewer than three noisy pixels in the level2.evt file, extra rows are filled as -1
| Pixel properties | Quadrant properties | ||||||
|---|---|---|---|---|---|---|---|
| Quadrant | DetID | PixID | Counts | Sigma | Mean | Median | Sigma |
| A | 15 | 234 | 4696338 | 33856.14 | 667 | 652 | 138.7 |
| A | 0 | 23 | 419734 | 3021.6 | 667 | 652 | 138.7 |
| A | 14 | 111 | 132461 | 950.35 | 667 | 652 | 138.7 |
| B | 0 | 214 | 155029 | 1000.98 | 794 | 775 | 154.1 |
| B | 4 | 81 | 40912 | 260.46 | 794 | 775 | 154.1 |
| B | 0 | 219 | 20429 | 127.54 | 794 | 775 | 154.1 |
| C | 13 | 61 | 5788 | 27.99 | 764 | 768 | 179.3 |
| C | 9 | 54 | 2126 | 7.57 | 764 | 768 | 179.3 |
| C | 3 | 202 | 1833 | 5.94 | 764 | 768 | 179.3 |
| D | 1 | 7 | 743662 | 3682.38 | 760 | 739 | 201.8 |
| D | 12 | 221 | 61429 | 300.82 | 760 | 739 | 201.8 |
| D | 12 | 233 | 35111 | 170.37 | 760 | 739 | 201.8 |
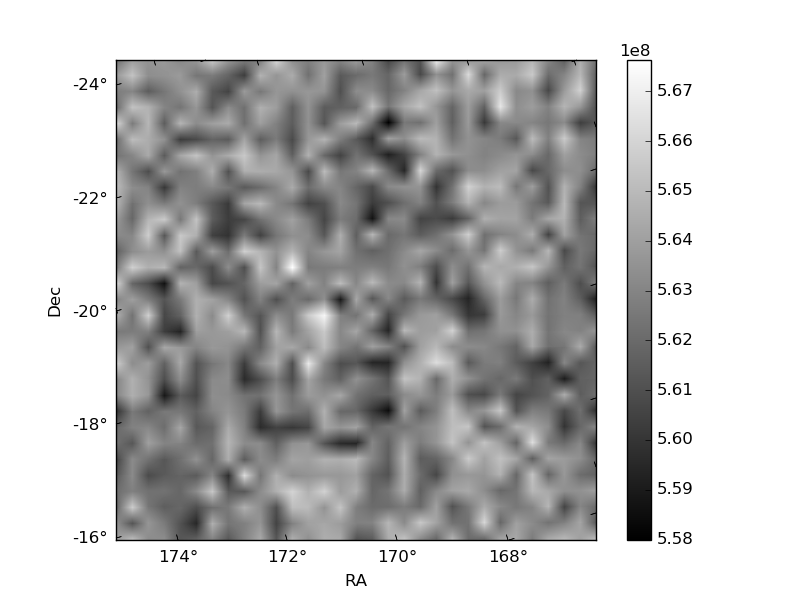
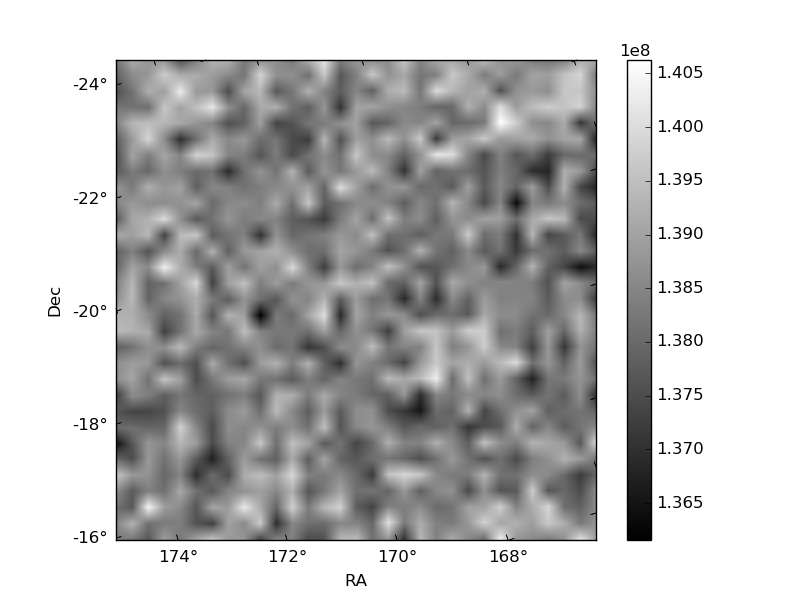
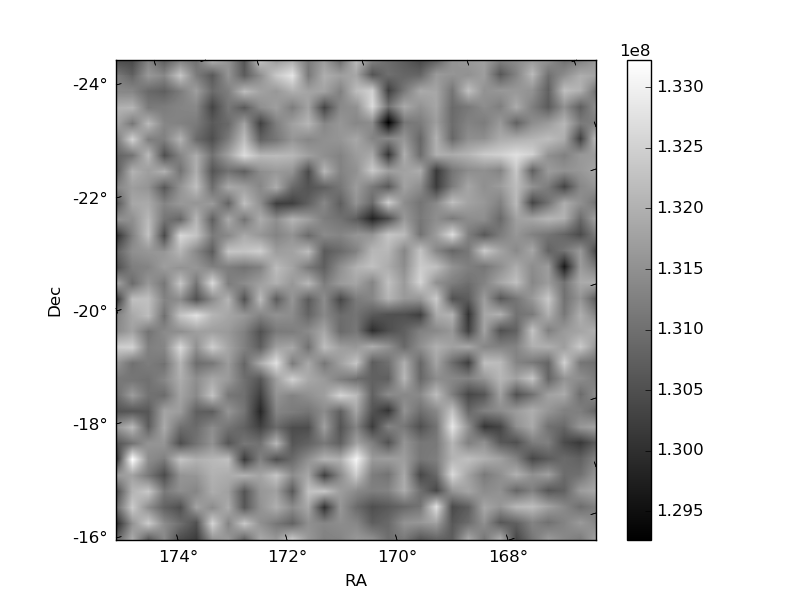
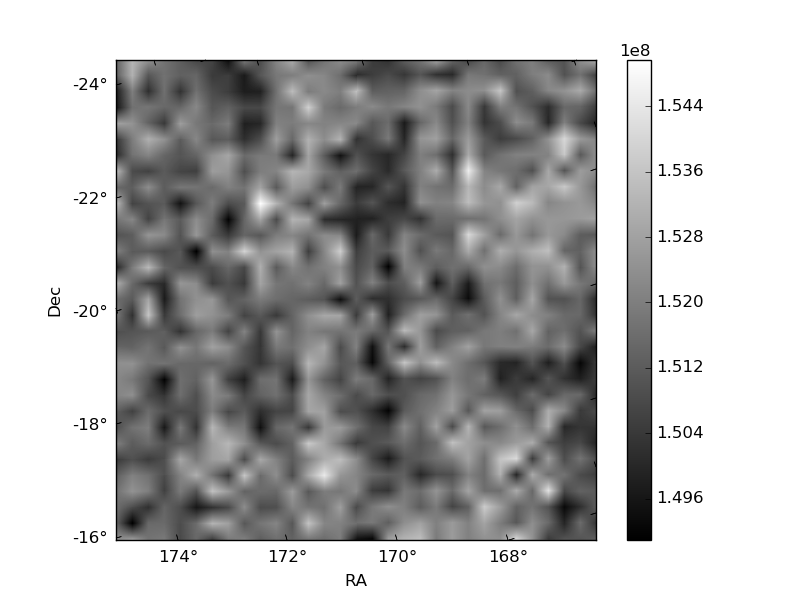
Histogram calculated using DETX and DETY for each event in the final _common_clean file
| Quadrant A | 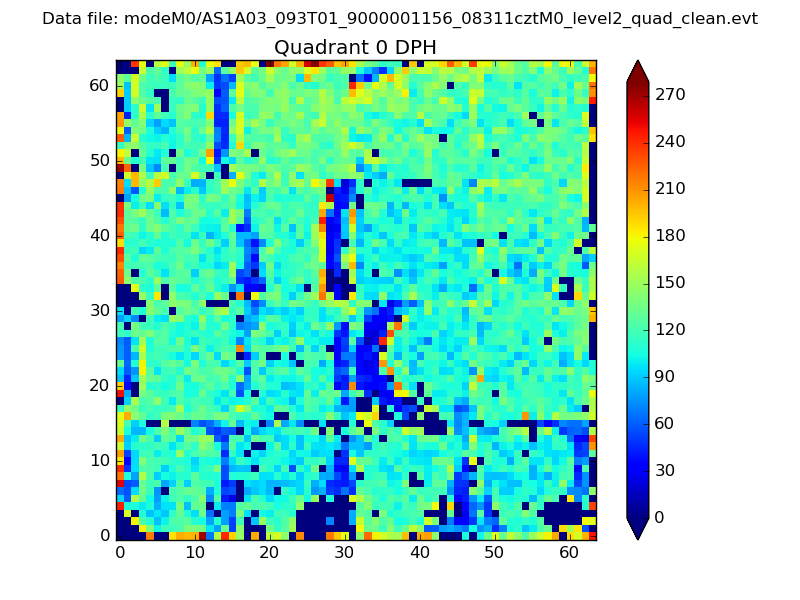 |
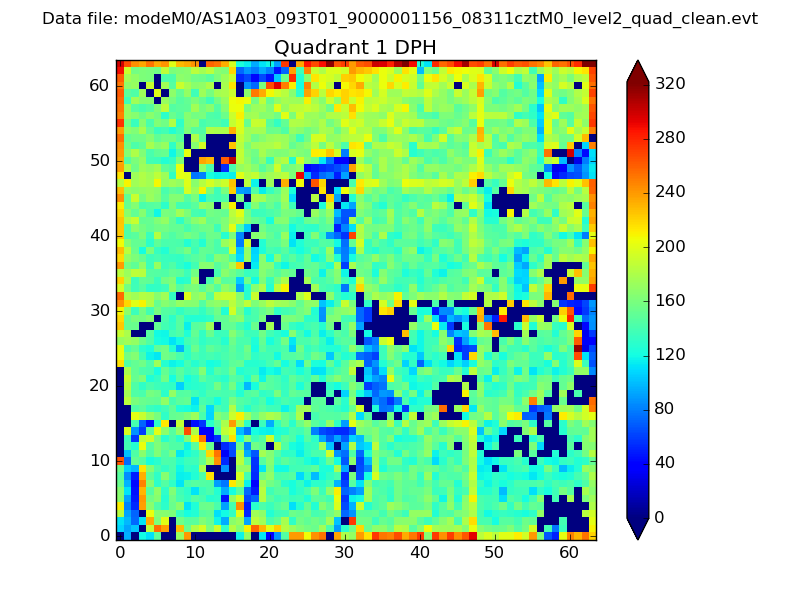 |
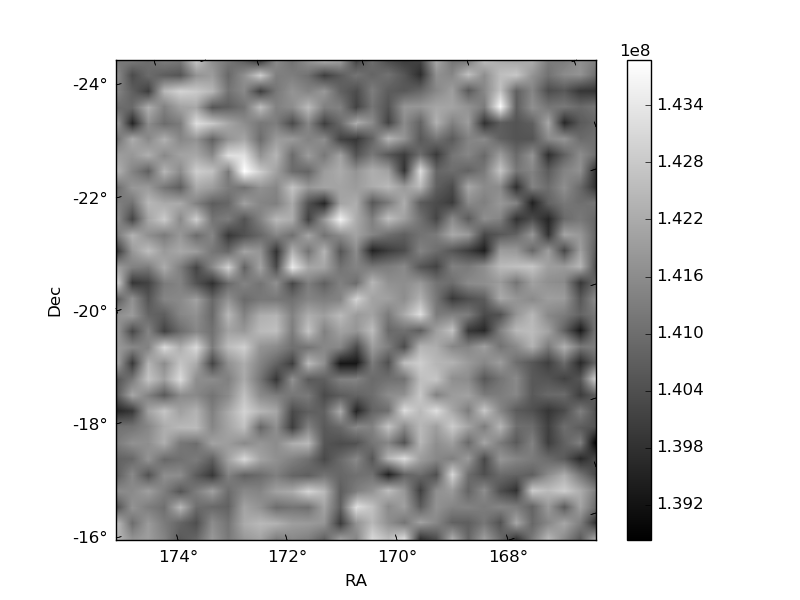
Quadrant B |
|---|---|---|---|
| Quadrant D | 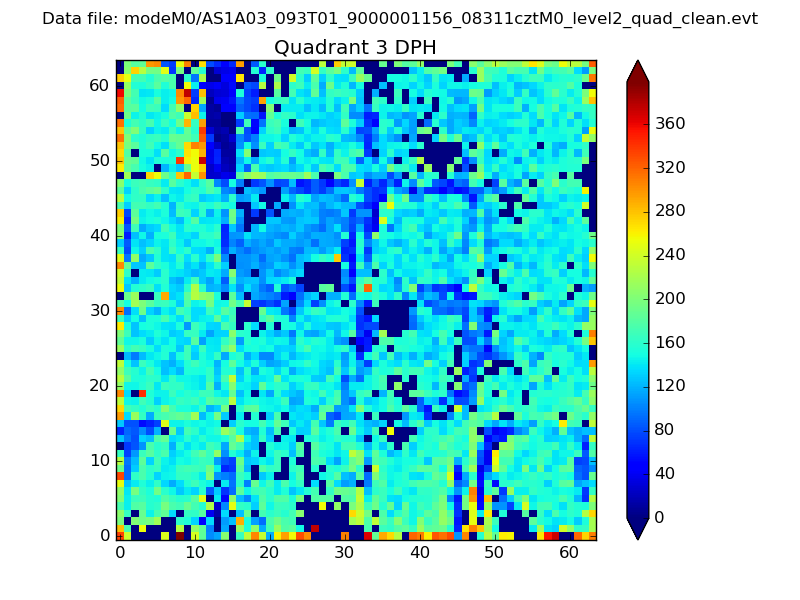 |
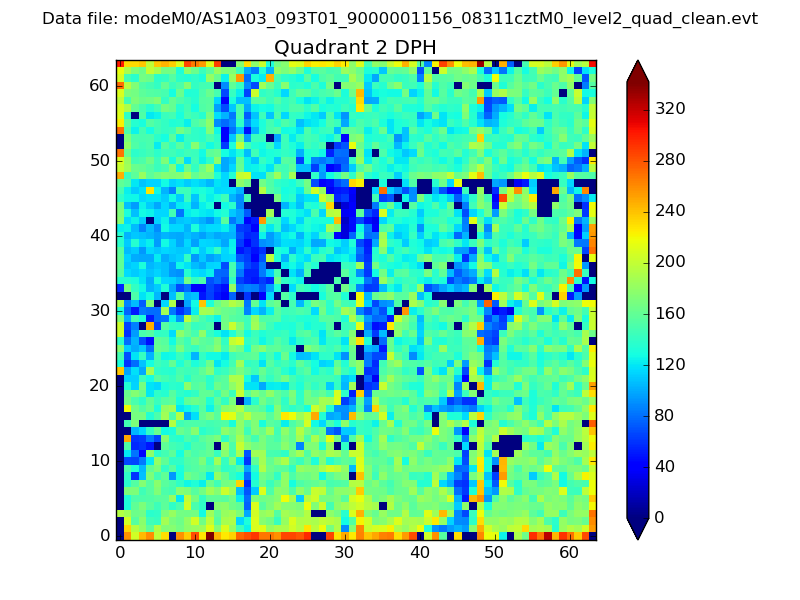 |
Quadrant C |
| Plot type | Count rate plots | Images |
|---|---|---|
| Comparison with Poisson distribution Blue bars denote a histogram of data divided into 1 sec bins. Red curve is a Poisson curve with rate = median count rate of data. |
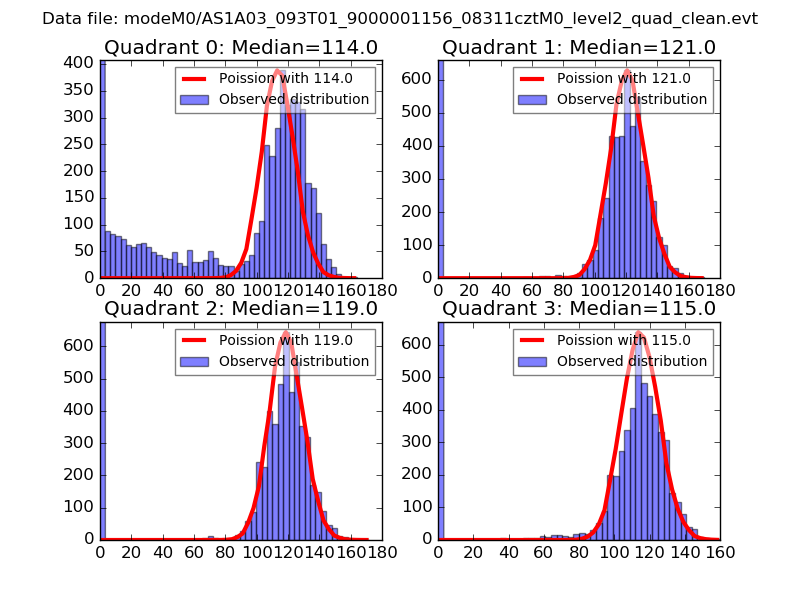 |
 |
| Quadrant-wise count rates Data is divided into 100 sec bins |
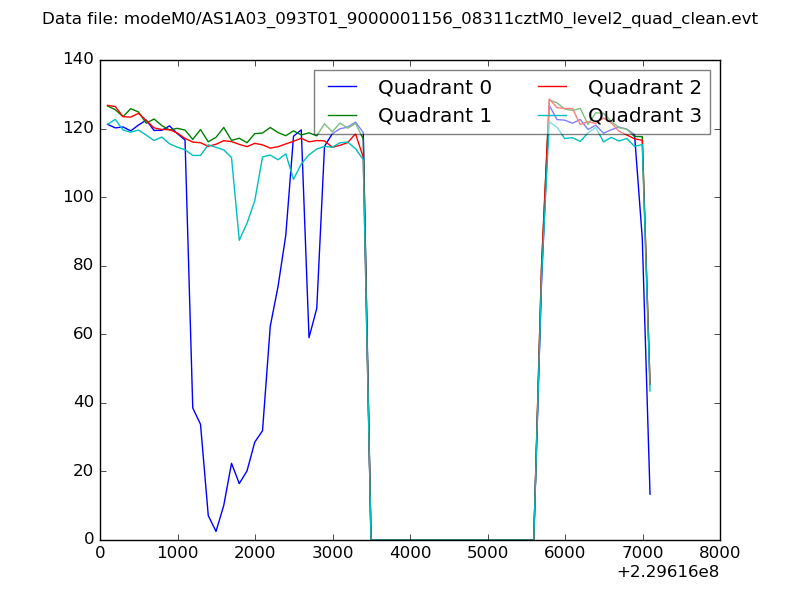 |
|
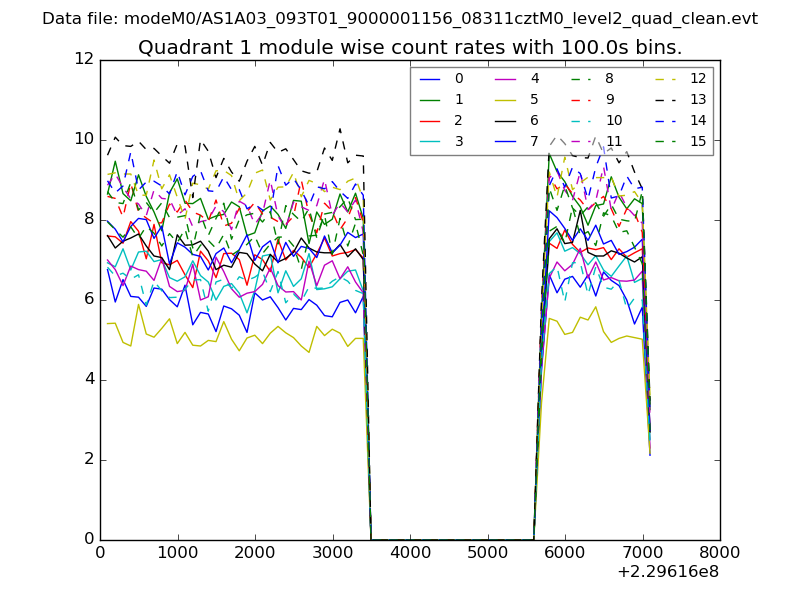
| Module-wise count rates for Quadrant A Data is divided into 100 sec bins |
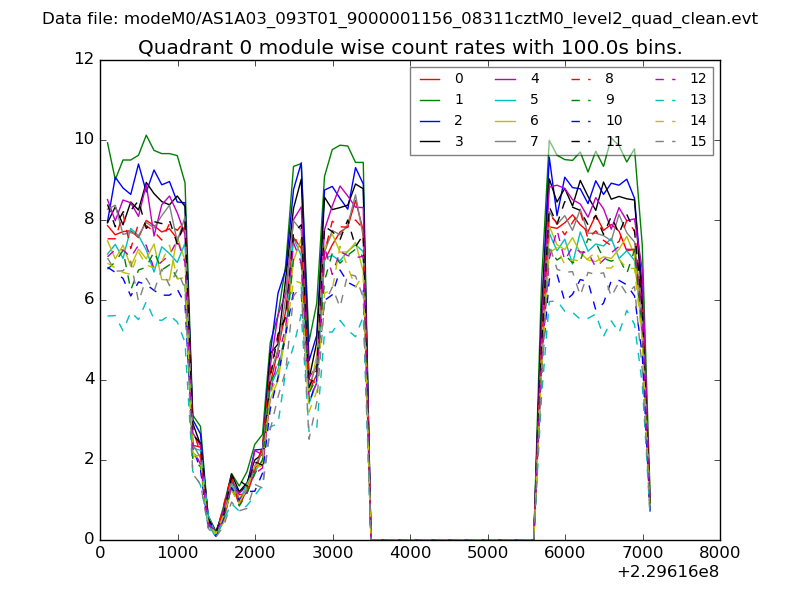 |
 |
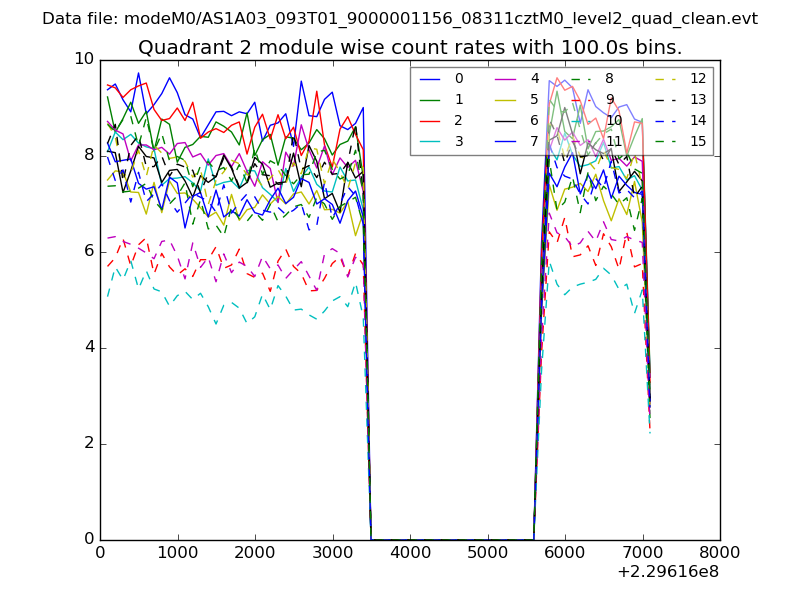
| Module-wise count rates for Quadrant B Data is divided into 100 sec bins |
 |
 |
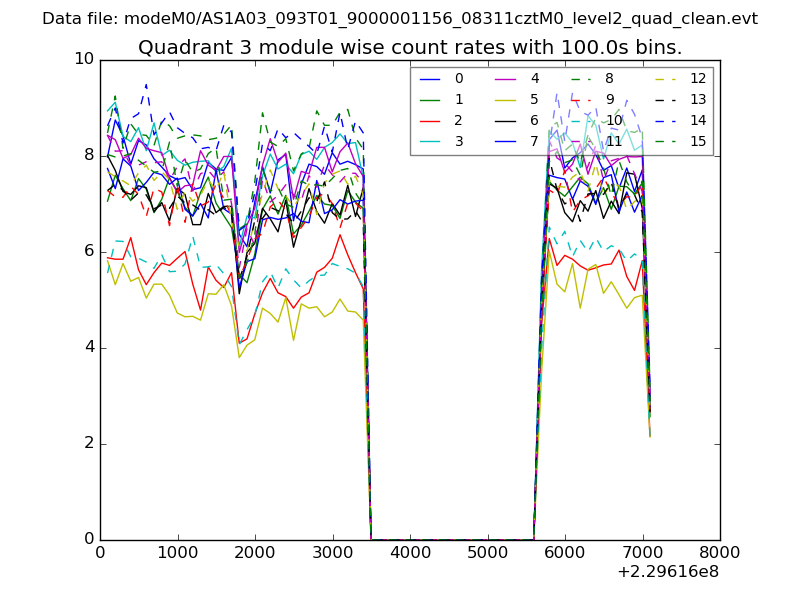
| Module-wise count rates for Quadrant C Data is divided into 100 sec bins |
 |
 |
| Module-wise count rates for Quadrant D Data is divided into 100 sec bins |
 |
 |
| Parameter | Plot |
|---|---|
| CZT HV Monitor | 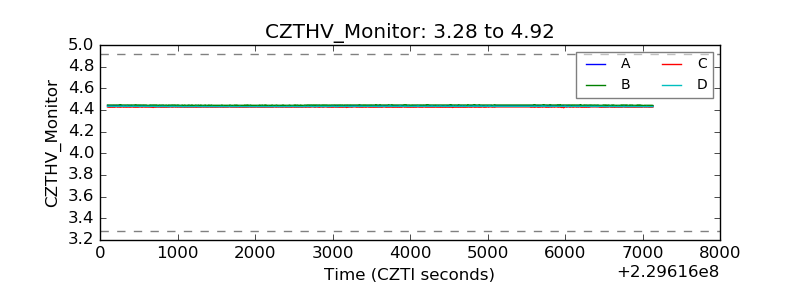 |
| D_VDD | 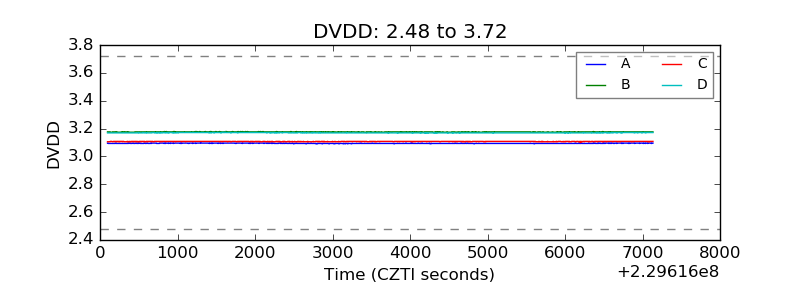 |
| Temperature 1 | 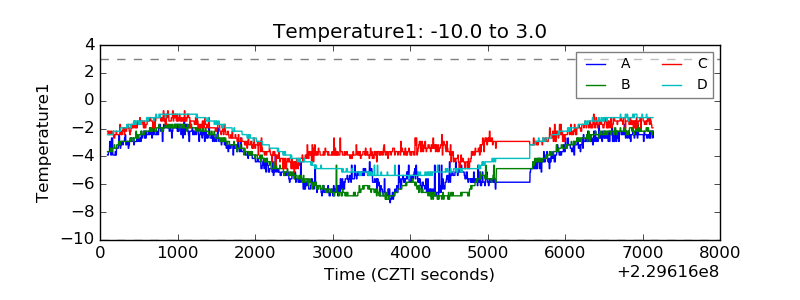 |
| Veto HV Monitor |  |
| Veto LLD | 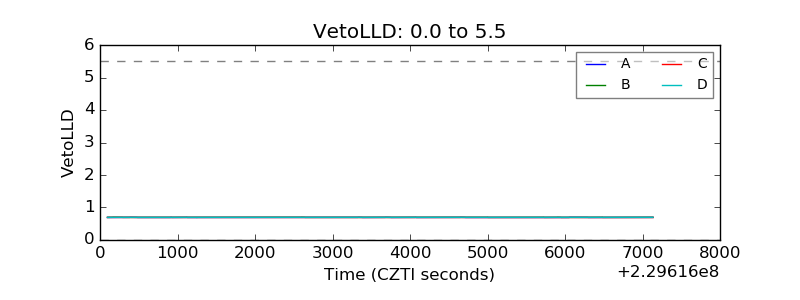 |
| Alpha Counter | 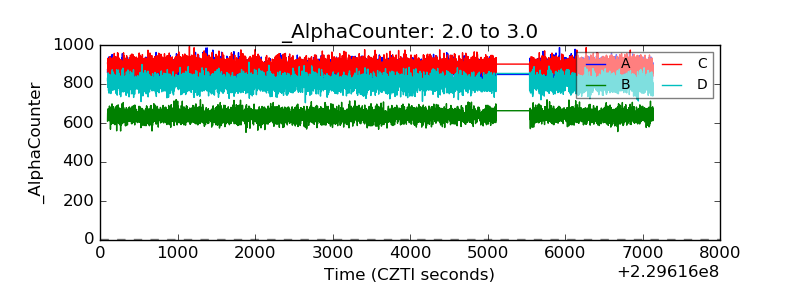 |
| _CPM_Rate | 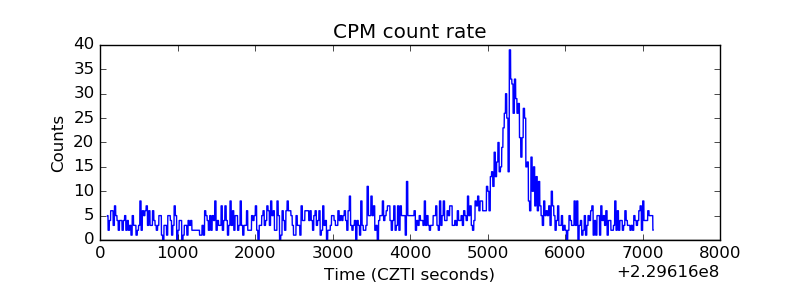 |
| CZT Counter | 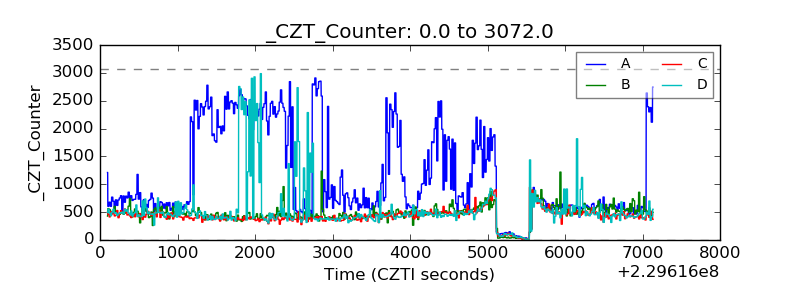 |
| +2.5 Volts monitor | 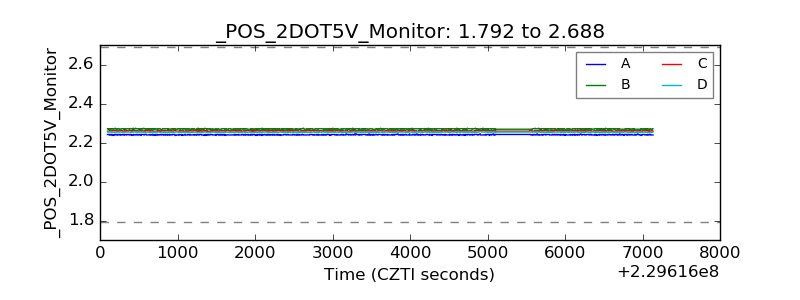 |
| +5 Volts monitor | 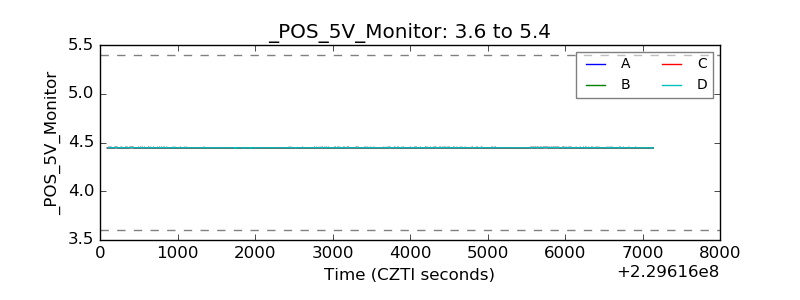 |
| _ROLL_ROT | 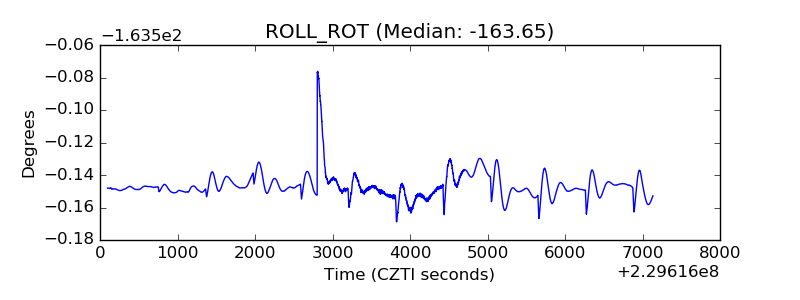 |
| _Roll_DEC | 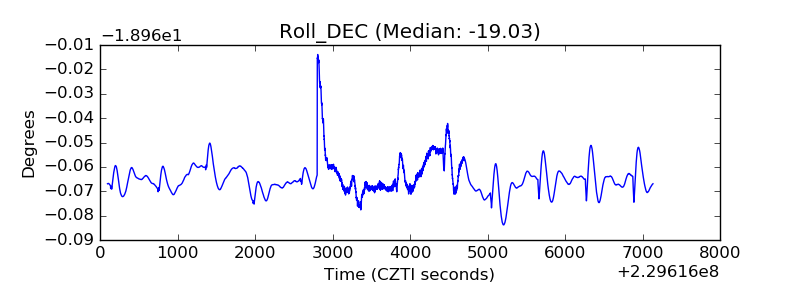 |
| _Roll_RA | 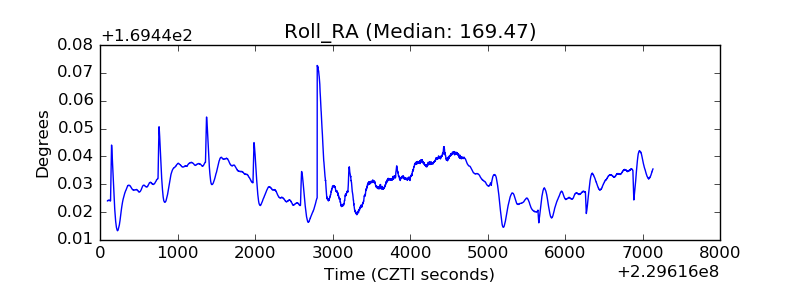 |
| Veto Counter | 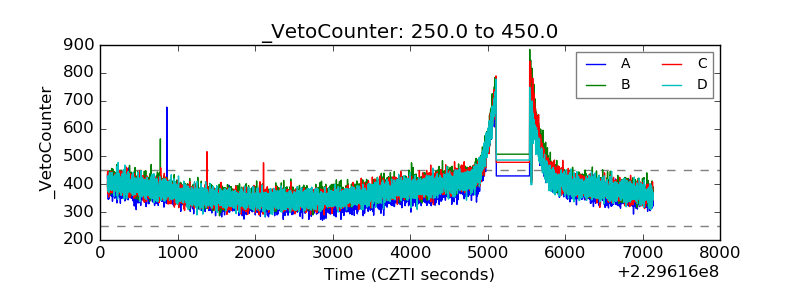 |