| Param | Original file | Final file |
|---|---|---|
| Filename | modeM0/AS1A03_093T01_9000001156_08312cztM0_level2.evt | modeM0/AS1A03_093T01_9000001156_08312cztM0_level2_quad_clean.evt |
| Size (bytes) | 721,886,400 | 91,684,800 |
| Size | 688.4 MB | 87.4 MB |
| Events in quadrant A | 10,662,405 | 450,056 |
| Events in quadrant B | 3,764,950 | 619,439 |
| Events in quadrant C | 3,351,892 | 607,089 |
| Events in quadrant D | 3,585,782 | 587,995 |
| Mode M0 | |||
|---|---|---|---|
| Quadrant | BADHDUFLAG | Total packets | Discarded packets |
| A | 0 | 36633 | 2 |
| B | 0 | 15943 | 1 |
| C | 0 | 15212 | 1 |
| D | 0 | 15791 | 1 |
| Mode SS | |||
|---|---|---|---|
| Quadrant | BADHDUFLAG | Total packets | Discarded packets |
| A | 0 | 148 | 0 |
| B | 0 | 148 | 0 |
| C | 0 | 148 | 0 |
| D | 0 | 148 | 0 |
| Quadrant | Total seconds | Saturated seconds | Saturation percentage |
|---|---|---|---|
| A | 7336 | 2951 | 40.226281% |
| B | 7336 | 134 | 1.826609% |
| C | 7336 | 44 | 0.599782% |
| D | 7336 | 46 | 0.627045% |
Noise dominated data is calculated using 1-second bins in cleaned event files. If a bin has >2000 counts, and if more than 50% of those come from <1% of pixels, then it is considered to be noise-dominated and hence unusable.
| Quadrant | # 1 sec bins | Bins with >0 counts | Bins with >2000 counts | High rate bins dominated by noise | Noise dominated (total time) | Noise dominated (detector-on time) | Marked lightcurve |
|---|---|---|---|---|---|---|---|
| A | 7415 | 7336 | 2295 | 2295 | 30.95% | 31.28% | 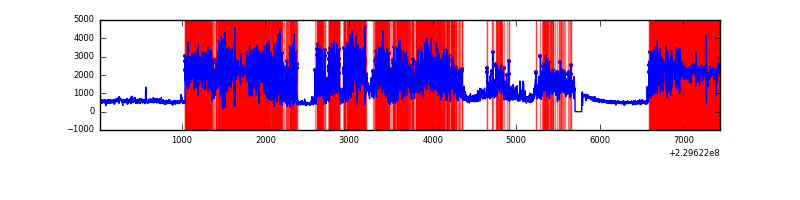 |
| B | 7416 | 7337 | 6 | 6 | 0.08% | 0.08% |  |
| C | 7416 | 7337 | 0 | 0 | 0.00% | 0.00% | 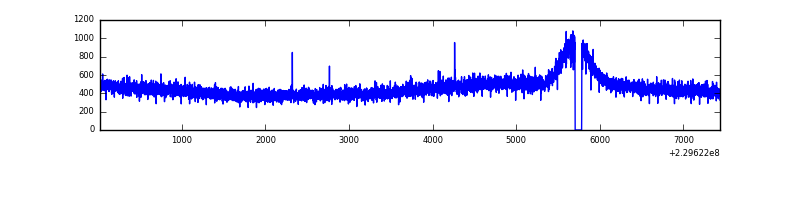 |
| D | 7416 | 7337 | 6 | 6 | 0.08% | 0.08% |  |
Top three noisy pixels from each quadrant. If the there are fewer than three noisy pixels in the level2.evt file, extra rows are filled as -1
| Pixel properties | Quadrant properties | ||||||
|---|---|---|---|---|---|---|---|
| Quadrant | DetID | PixID | Counts | Sigma | Mean | Median | Sigma |
| A | 15 | 234 | 7563522 | 50007.56 | 731 | 713 | 151.2 |
| A | 0 | 23 | 211373 | 1392.95 | 731 | 713 | 151.2 |
| A | 14 | 111 | 26456 | 170.22 | 731 | 713 | 151.2 |
| B | 0 | 214 | 190972 | 1105.23 | 891 | 870 | 172.0 |
| B | 0 | 219 | 37457 | 212.71 | 891 | 870 | 172.0 |
| B | 12 | 111 | 18341 | 101.57 | 891 | 870 | 172.0 |
| C | 13 | 61 | 6543 | 28.26 | 857 | 860 | 201.1 |
| C | 8 | 128 | 4805 | 19.62 | 857 | 860 | 201.1 |
| C | 9 | 54 | 3318 | 12.22 | 857 | 860 | 201.1 |
| D | 1 | 7 | 171275 | 724.73 | 855 | 834 | 235.2 |
| D | 7 | 67 | 38257 | 159.13 | 855 | 834 | 235.2 |
| D | 12 | 221 | 37735 | 156.91 | 855 | 834 | 235.2 |
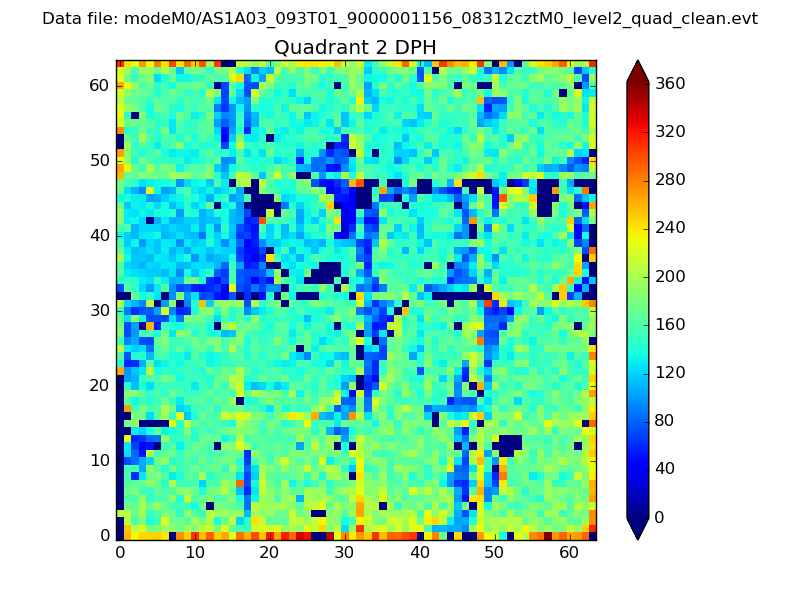
Histogram calculated using DETX and DETY for each event in the final _common_clean file
| Quadrant A | 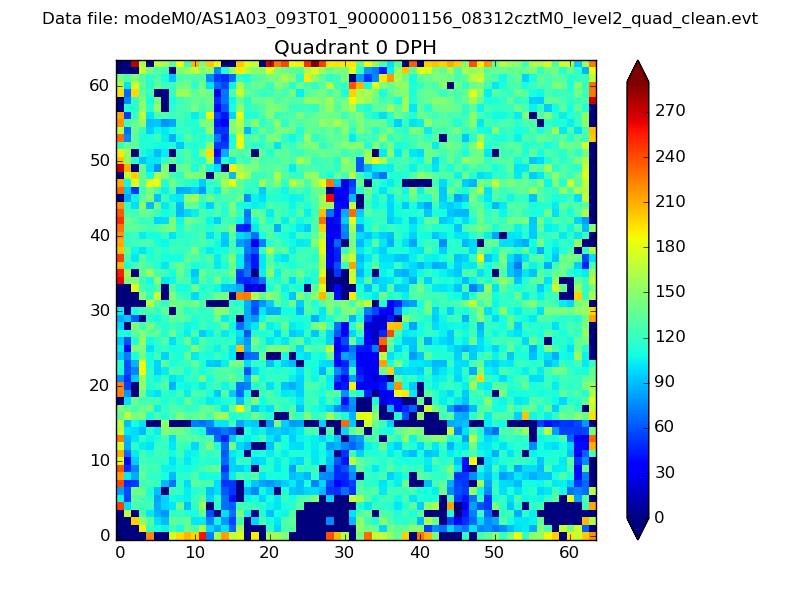 |
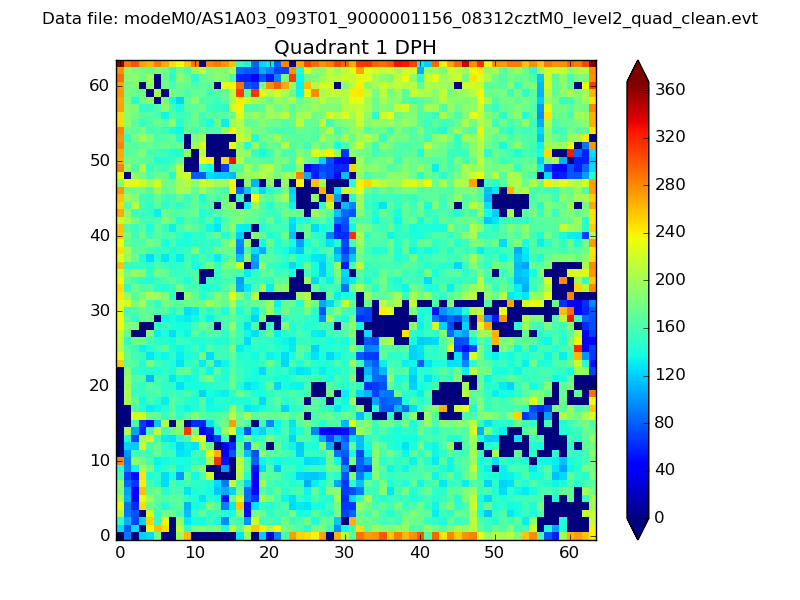 |
Quadrant B |
|---|---|---|---|
| Quadrant D | 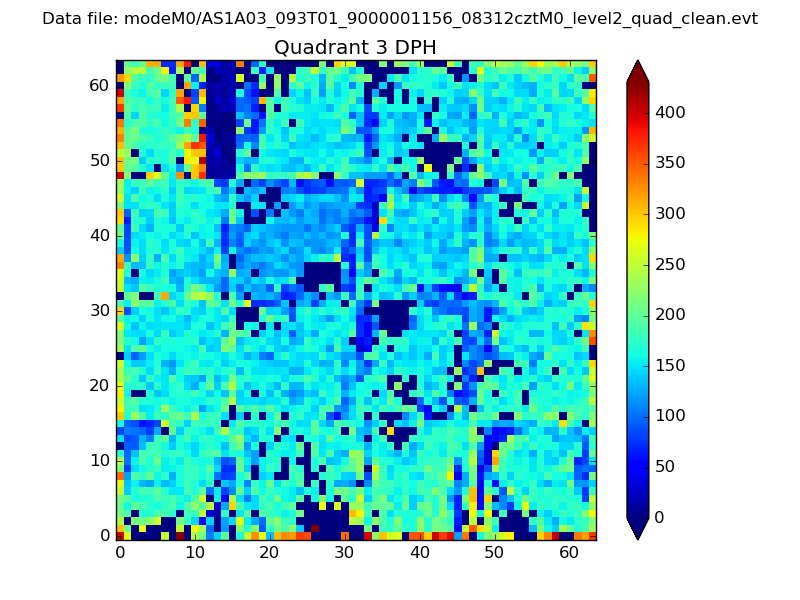 |
 |
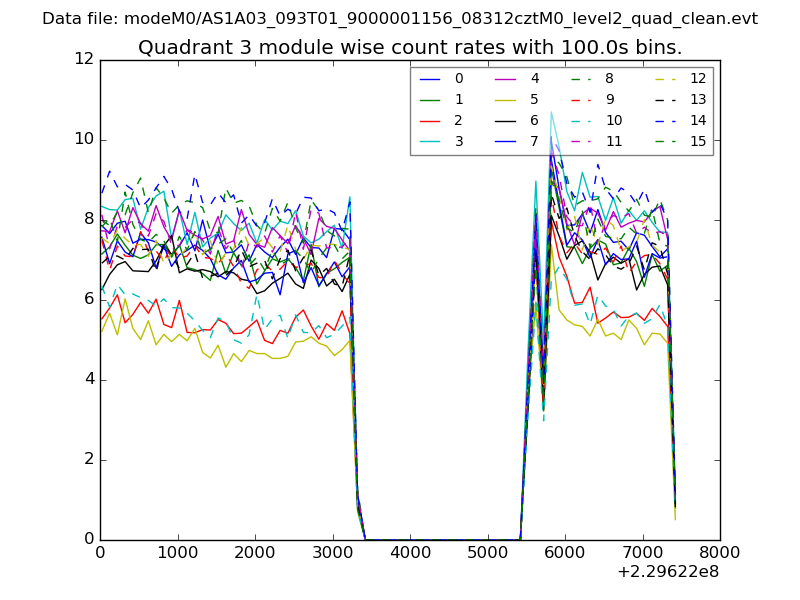
Quadrant C |
| Plot type | Count rate plots | Images |
|---|---|---|
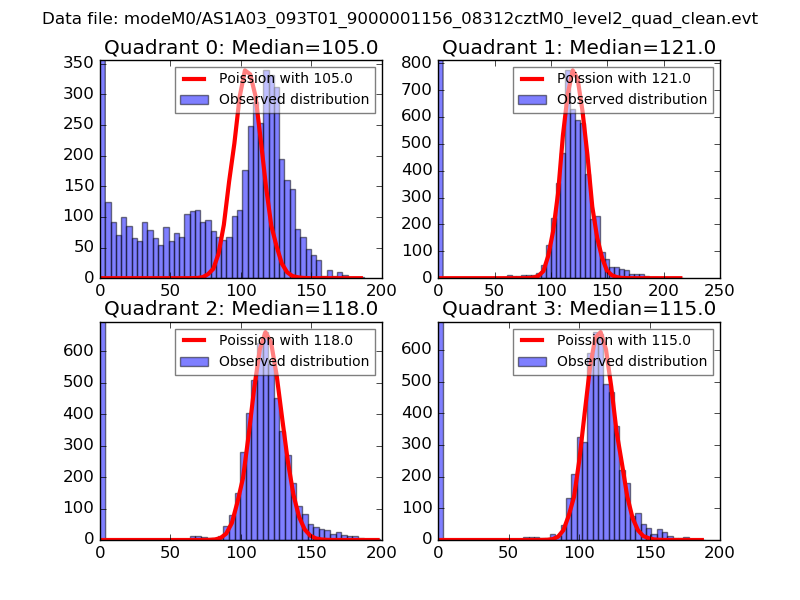
| Comparison with Poisson distribution Blue bars denote a histogram of data divided into 1 sec bins. Red curve is a Poisson curve with rate = median count rate of data. |
 |
 |
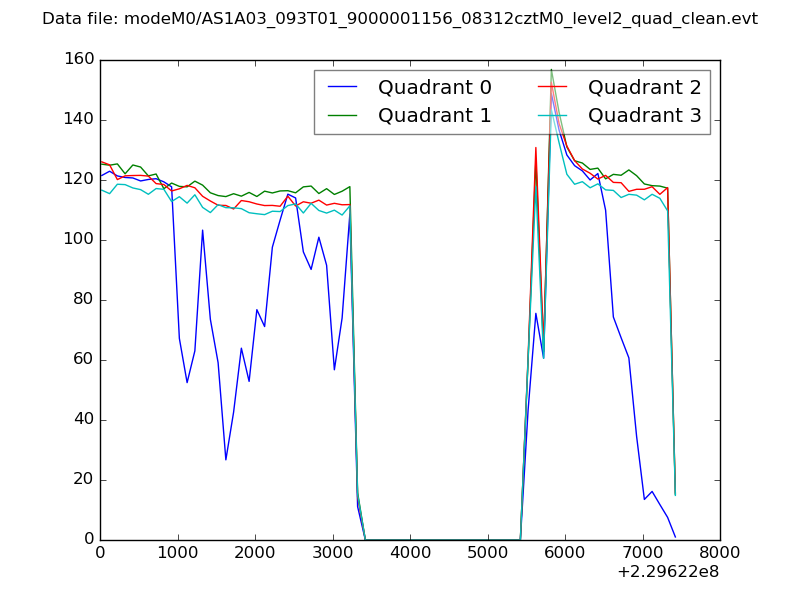
| Quadrant-wise count rates Data is divided into 100 sec bins |
 |
|
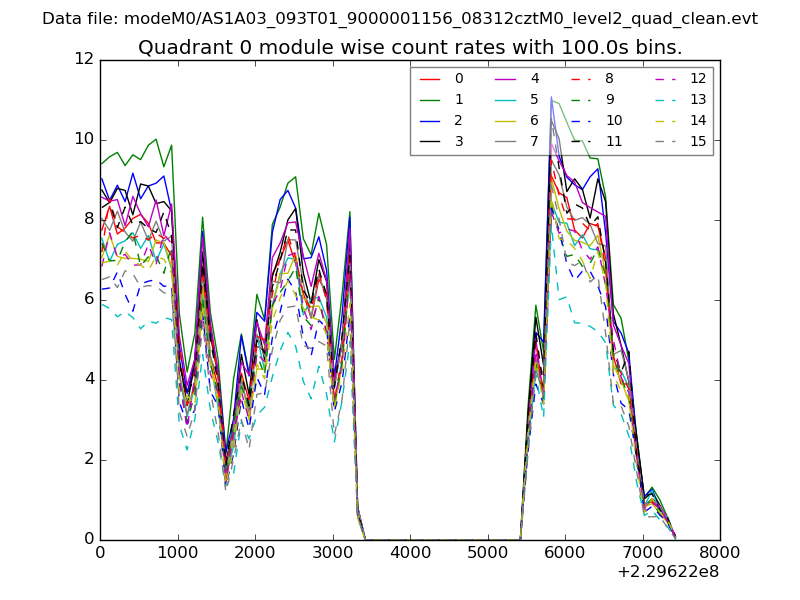
| Module-wise count rates for Quadrant A Data is divided into 100 sec bins |
 |
 |
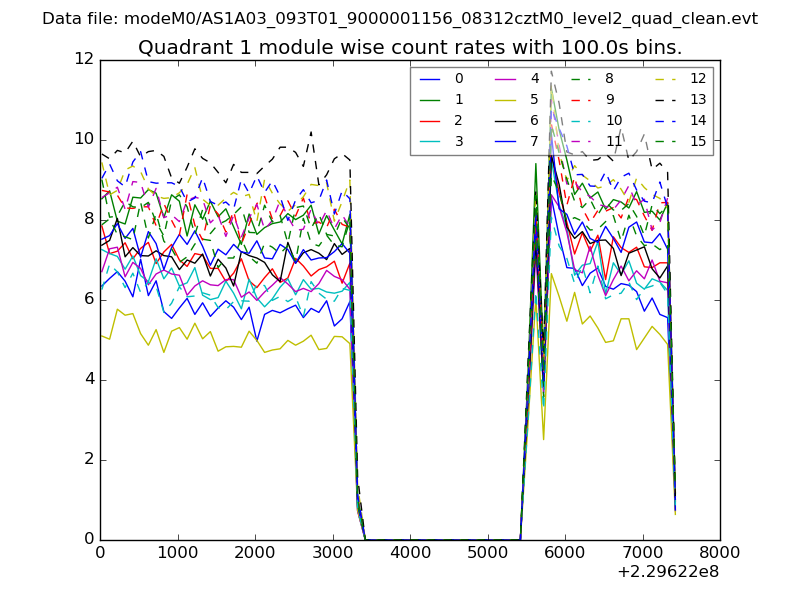
| Module-wise count rates for Quadrant B Data is divided into 100 sec bins |
 |
 |
| Module-wise count rates for Quadrant C Data is divided into 100 sec bins |
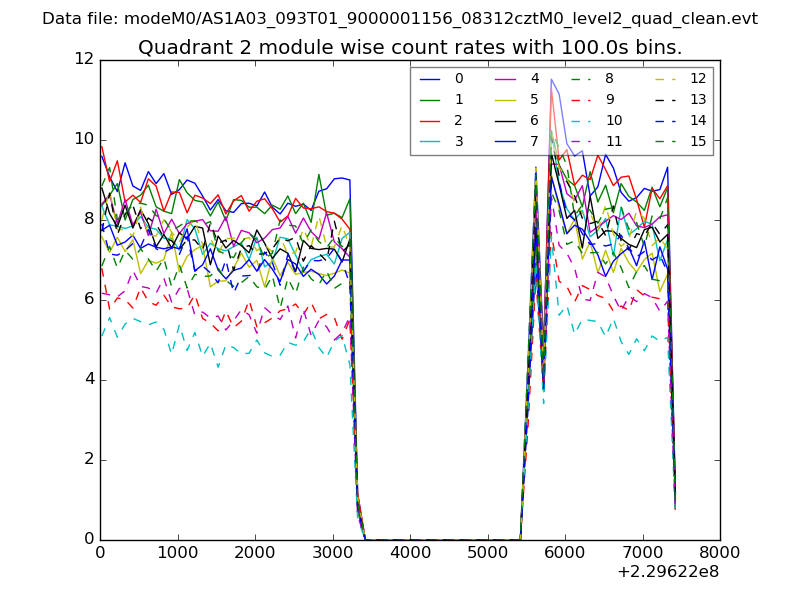 |
 |
| Module-wise count rates for Quadrant D Data is divided into 100 sec bins |
 |
 |
| Parameter | Plot |
|---|---|
| CZT HV Monitor | 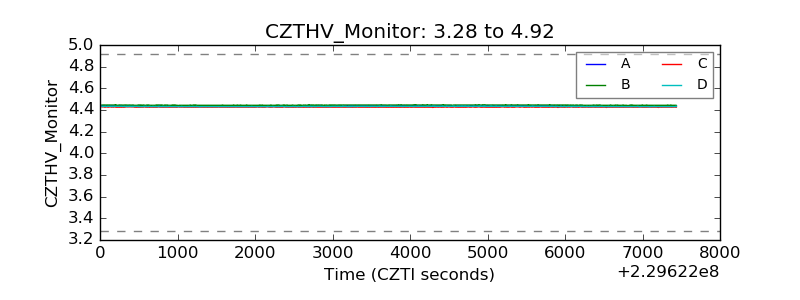 |
| D_VDD | 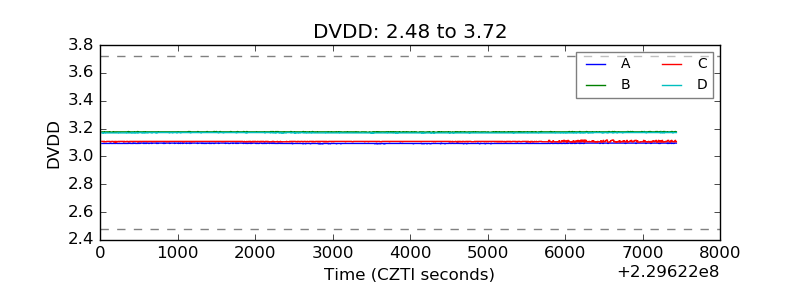 |
| Temperature 1 | 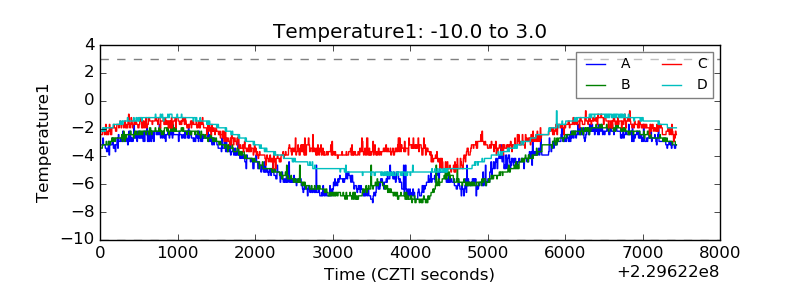 |
| Veto HV Monitor | 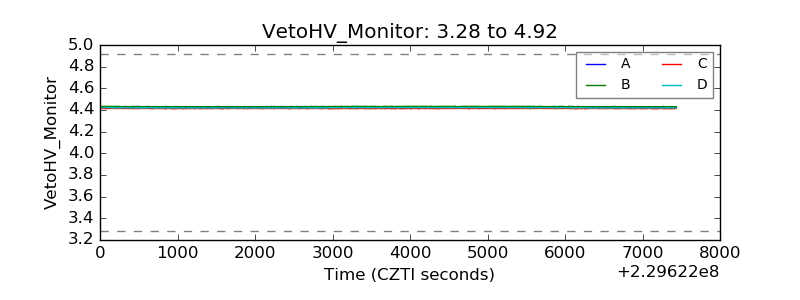 |
| Veto LLD | 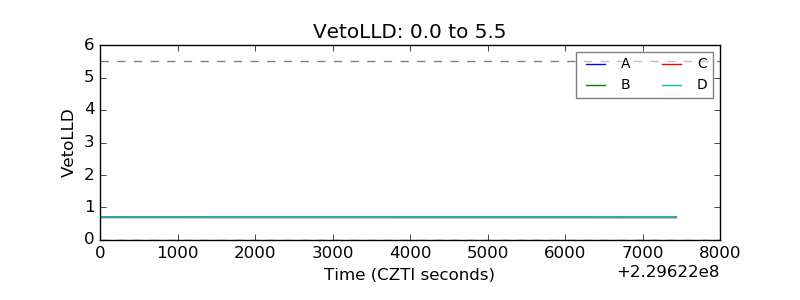 |
| Alpha Counter | 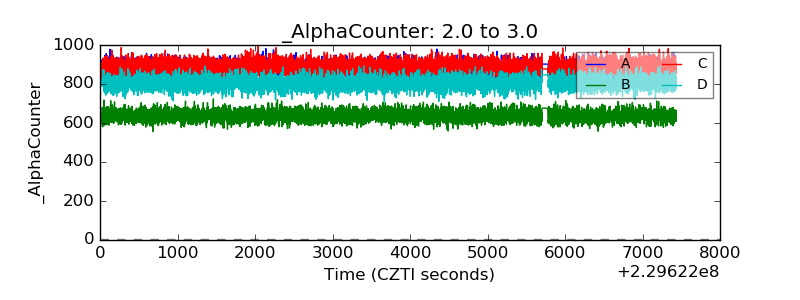 |
| _CPM_Rate | 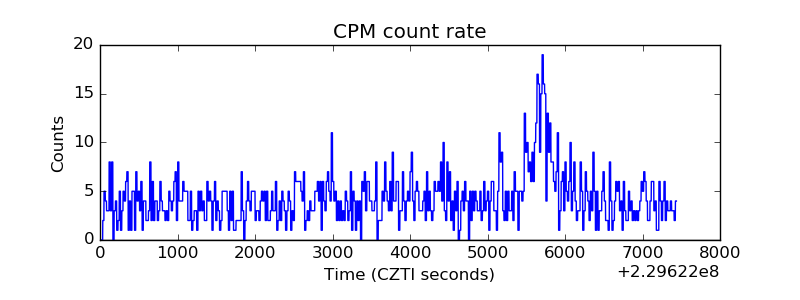 |
| CZT Counter | 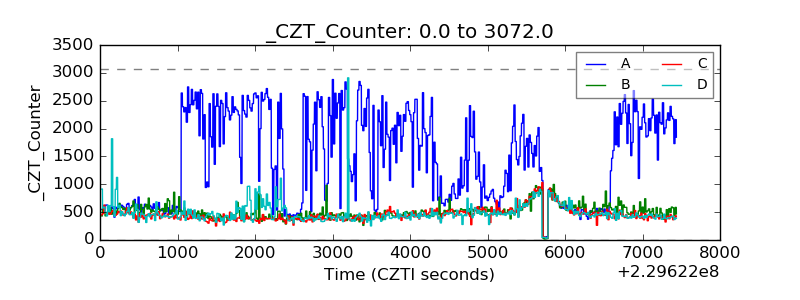 |
| +2.5 Volts monitor |  |
| +5 Volts monitor |  |
| _ROLL_ROT | 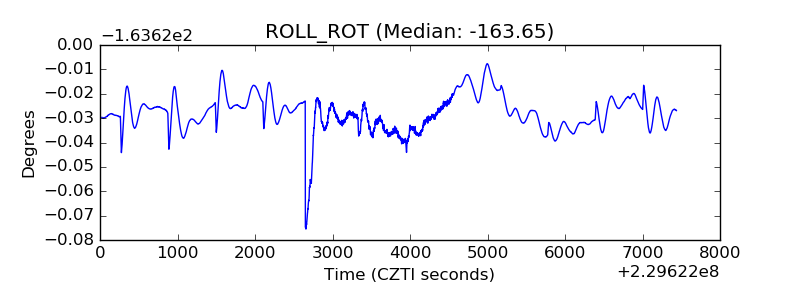 |
| _Roll_DEC |  |
| _Roll_RA | 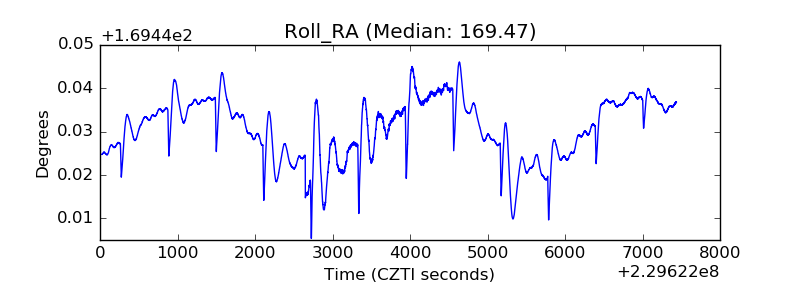 |
| Veto Counter | 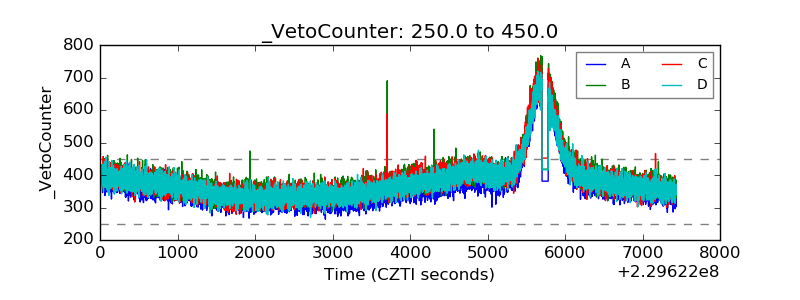 |