| Param | Original file | Final file |
|---|---|---|
| Filename | modeM0/AS1A03_093T01_9000001156_08317cztM0_level2.evt | modeM0/AS1A03_093T01_9000001156_08317cztM0_level2_quad_clean.evt |
| Size (bytes) | 1,508,149,440 | 250,410,240 |
| Size | 1.4 GB | 238.8 MB |
| Events in quadrant A | 13,518,193 | 1,414,572 |
| Events in quadrant B | 10,810,639 | 1,579,722 |
| Events in quadrant C | 9,860,176 | 1,542,761 |
| Events in quadrant D | 9,970,228 | 1,504,756 |
| Mode M9 | |||
|---|---|---|---|
| Quadrant | BADHDUFLAG | Total packets | Discarded packets |
| A | 0 | 30 | 0 |
| B | 0 | 30 | 0 |
| C | 0 | 30 | 0 |
| D | 0 | 30 | 0 |
| Mode M0 | |||
|---|---|---|---|
| Quadrant | BADHDUFLAG | Total packets | Discarded packets |
| A | 0 | 55518 | 5 |
| B | 0 | 47199 | 4 |
| C | 0 | 45348 | 4 |
| D | 0 | 46196 | 4 |
| Mode SS | |||
|---|---|---|---|
| Quadrant | BADHDUFLAG | Total packets | Discarded packets |
| A | 0 | 452 | 0 |
| B | 0 | 452 | 0 |
| C | 0 | 452 | 0 |
| D | 0 | 452 | 0 |
| Quadrant | Total seconds | Saturated seconds | Saturation percentage |
|---|---|---|---|
| A | 22416 | 1446 | 6.450749% |
| B | 22416 | 146 | 0.651320% |
| C | 22416 | 23 | 0.102605% |
| D | 22416 | 42 | 0.187366% |
Noise dominated data is calculated using 1-second bins in cleaned event files. If a bin has >2000 counts, and if more than 50% of those come from <1% of pixels, then it is considered to be noise-dominated and hence unusable.
| Quadrant | # 1 sec bins | Bins with >0 counts | Bins with >2000 counts | High rate bins dominated by noise | Noise dominated (total time) | Noise dominated (detector-on time) | Marked lightcurve |
|---|---|---|---|---|---|---|---|
| A | 25256 | 22420 | 1210 | 1210 | 4.79% | 5.40% | 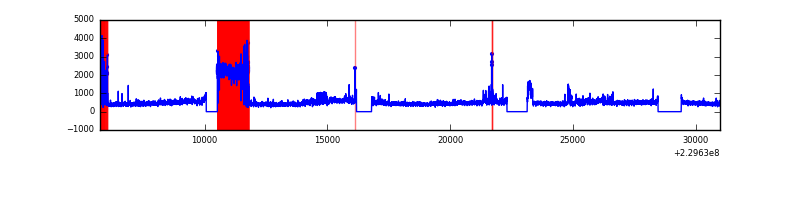 |
| B | 25256 | 22420 | 33 | 33 | 0.13% | 0.15% | 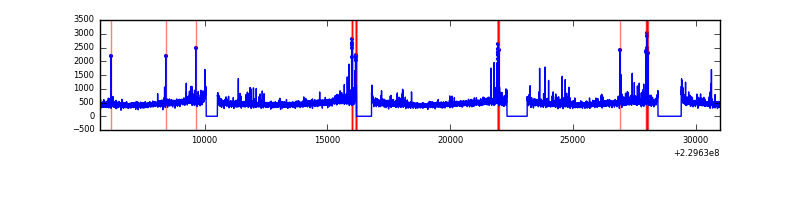 |
| C | 25256 | 22420 | 0 | 0 | 0.00% | 0.00% | 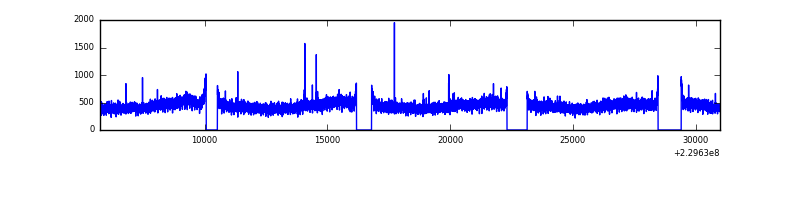 |
| D | 25256 | 22420 | 19 | 19 | 0.08% | 0.08% | 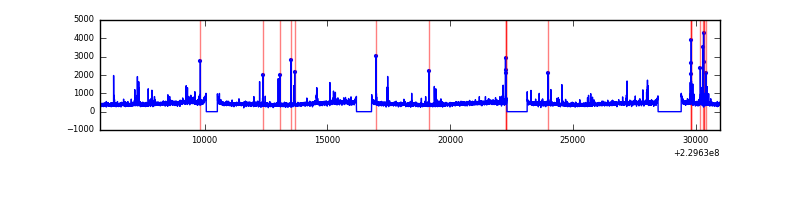 |
Top three noisy pixels from each quadrant. If the there are fewer than three noisy pixels in the level2.evt file, extra rows are filled as -1
| Pixel properties | Quadrant properties | ||||||
|---|---|---|---|---|---|---|---|
| Quadrant | DetID | PixID | Counts | Sigma | Mean | Median | Sigma |
| A | 15 | 234 | 3262497 | 6506.56 | 2462 | 2407 | 501.0 |
| A | 0 | 23 | 385834 | 765.25 | 2462 | 2407 | 501.0 |
| A | 15 | 239 | 283929 | 561.87 | 2462 | 2407 | 501.0 |
| B | 0 | 214 | 229589 | 455.94 | 2618 | 2553 | 498.0 |
| B | 0 | 187 | 154678 | 305.5 | 2618 | 2553 | 498.0 |
| B | 4 | 81 | 103162 | 202.04 | 2618 | 2553 | 498.0 |
| C | 9 | 54 | 20022 | 29.9 | 2520 | 2530 | 585.0 |
| C | 13 | 61 | 19311 | 28.69 | 2520 | 2530 | 585.0 |
| C | 8 | 128 | 11502 | 15.34 | 2520 | 2530 | 585.0 |
| D | 2 | 14 | 184674 | 283.82 | 2505 | 2442 | 642.1 |
| D | 12 | 233 | 103477 | 157.36 | 2505 | 2442 | 642.1 |
| D | 2 | 234 | 74228 | 111.81 | 2505 | 2442 | 642.1 |
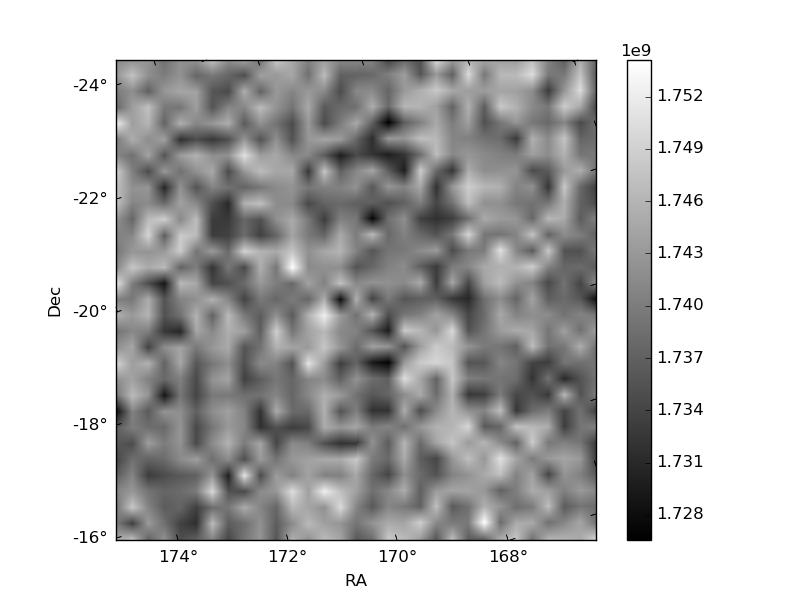
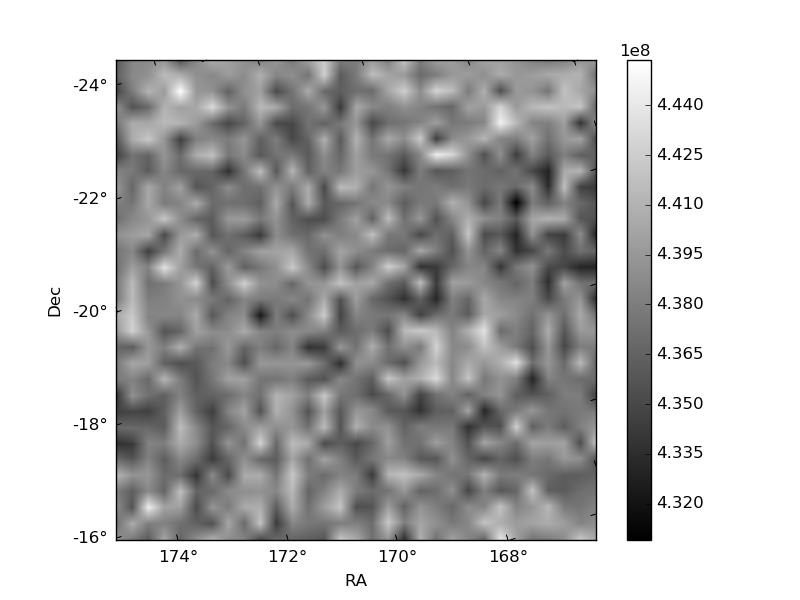
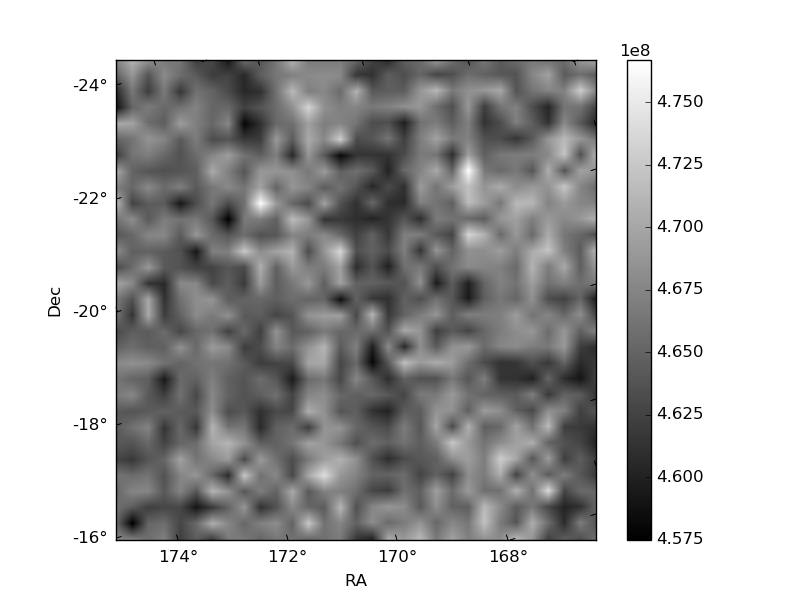
Histogram calculated using DETX and DETY for each event in the final _common_clean file
| Quadrant A | 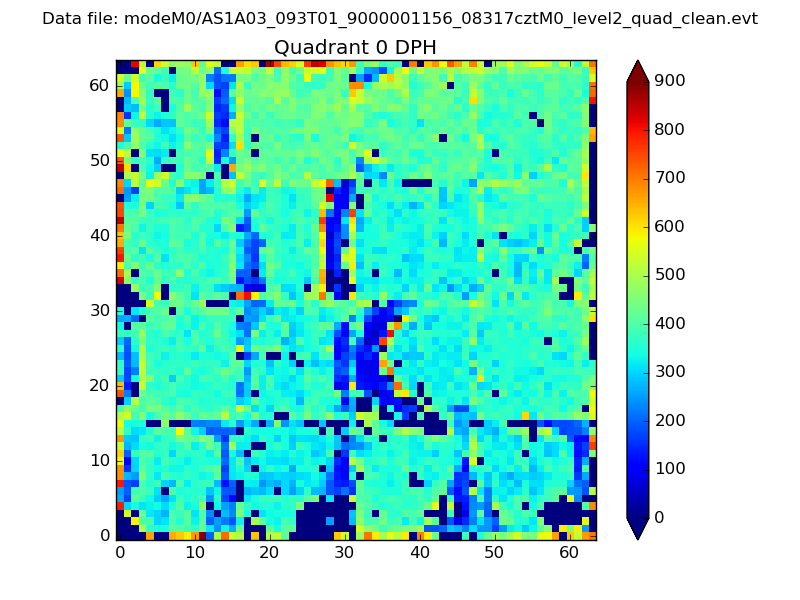 |
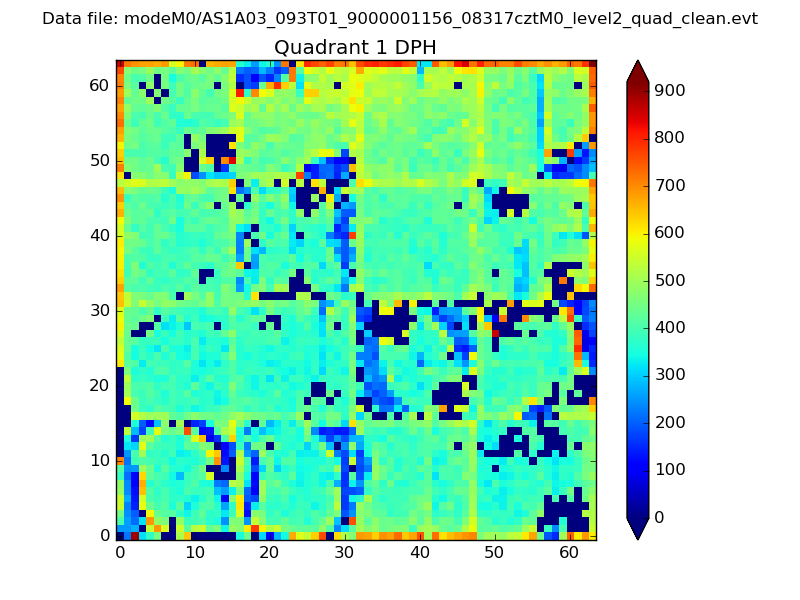 |
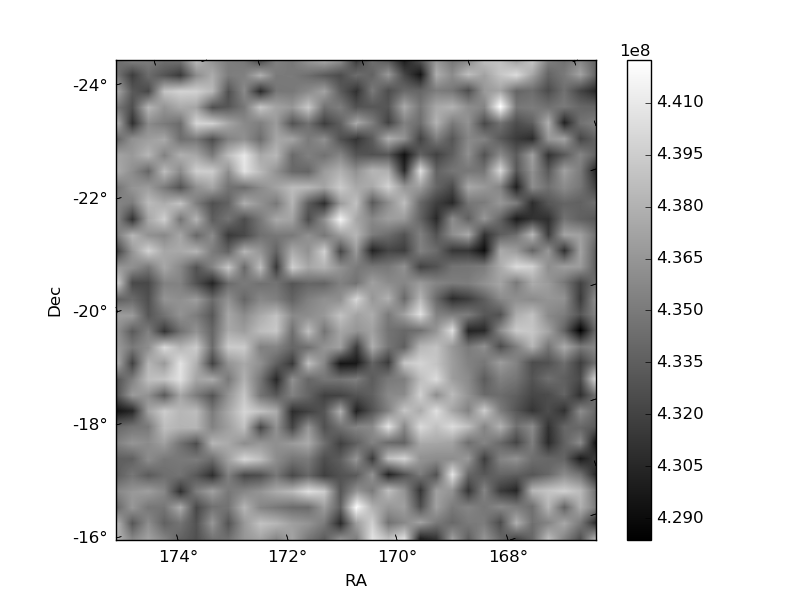
Quadrant B |
|---|---|---|---|
| Quadrant D | 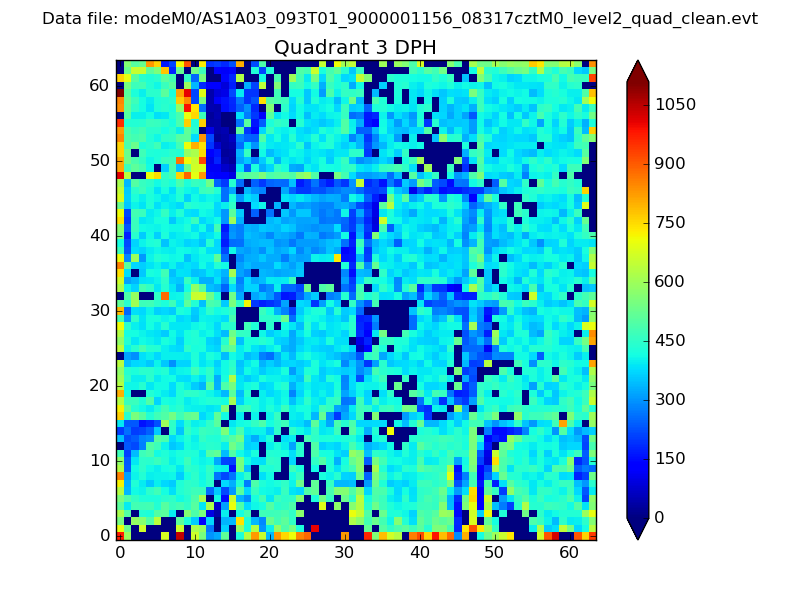 |
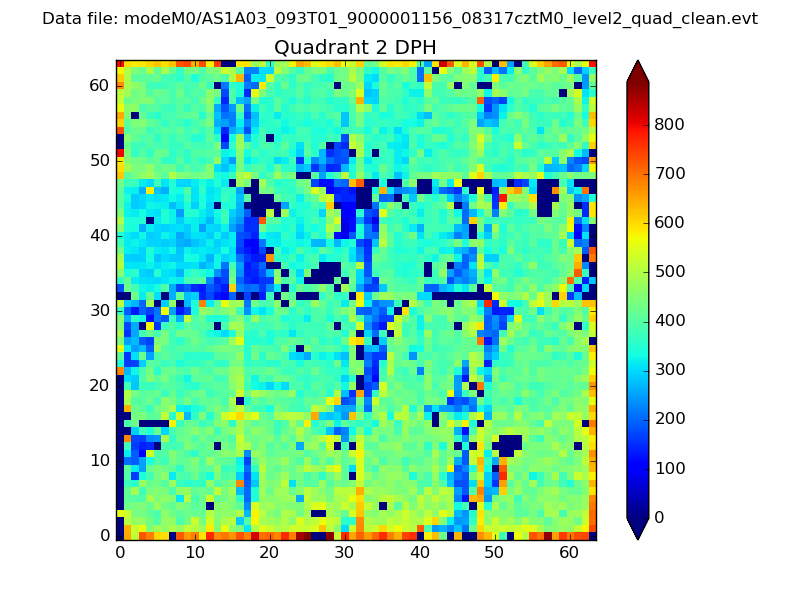 |
Quadrant C |
| Plot type | Count rate plots | Images |
|---|---|---|
| Comparison with Poisson distribution Blue bars denote a histogram of data divided into 1 sec bins. Red curve is a Poisson curve with rate = median count rate of data. |
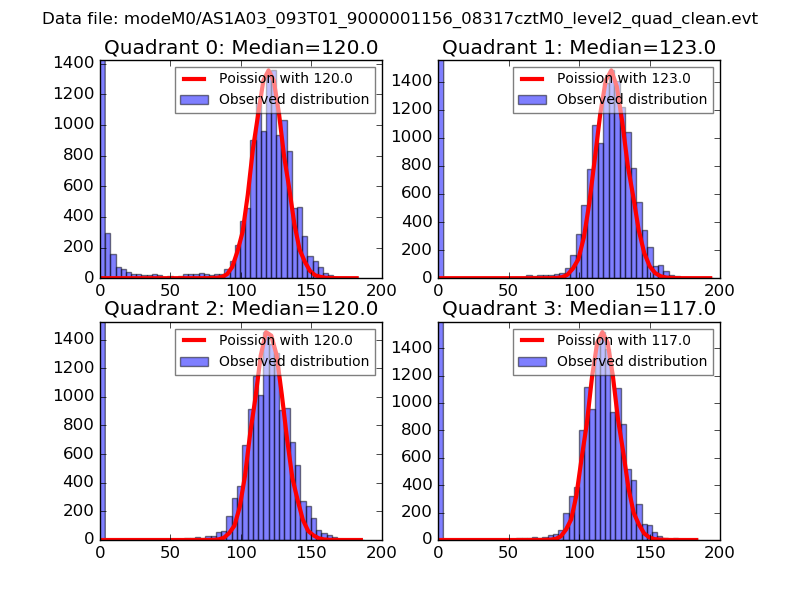 |
 |
| Quadrant-wise count rates Data is divided into 100 sec bins |
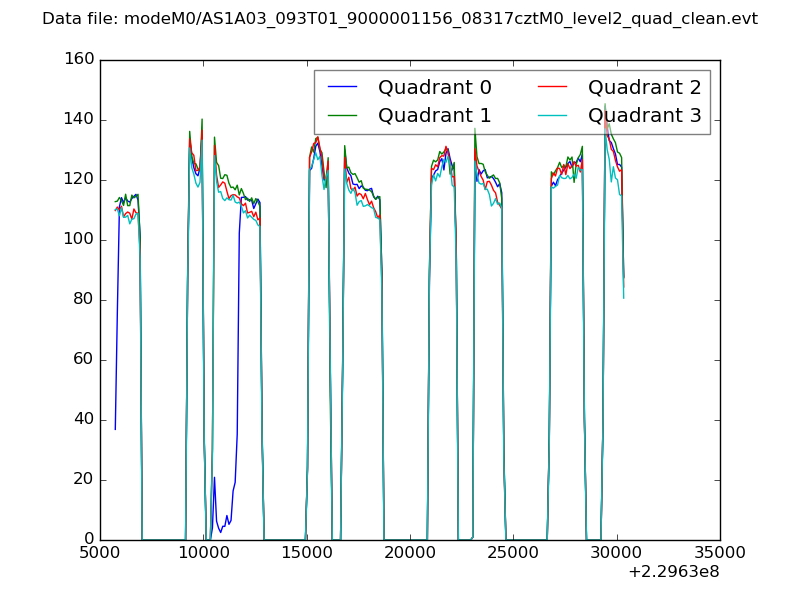 |
|
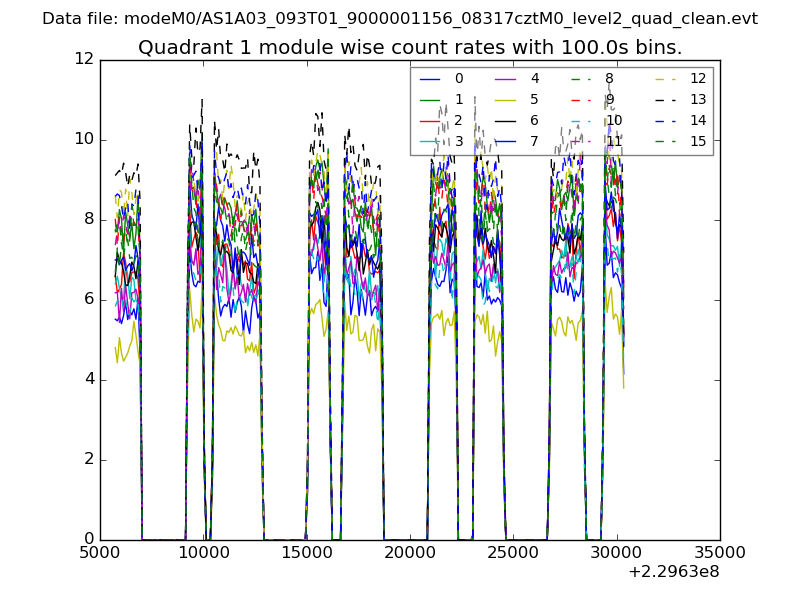
| Module-wise count rates for Quadrant A Data is divided into 100 sec bins |
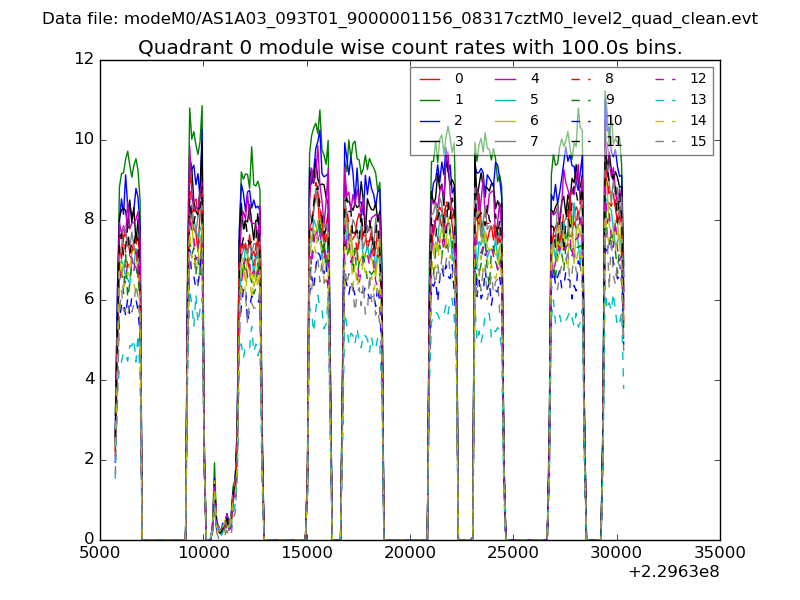 |
 |
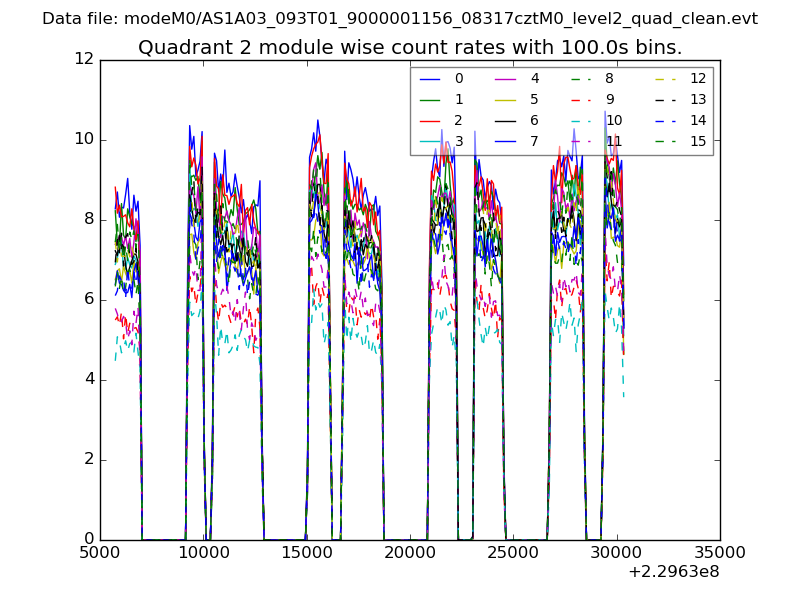
| Module-wise count rates for Quadrant B Data is divided into 100 sec bins |
 |
 |
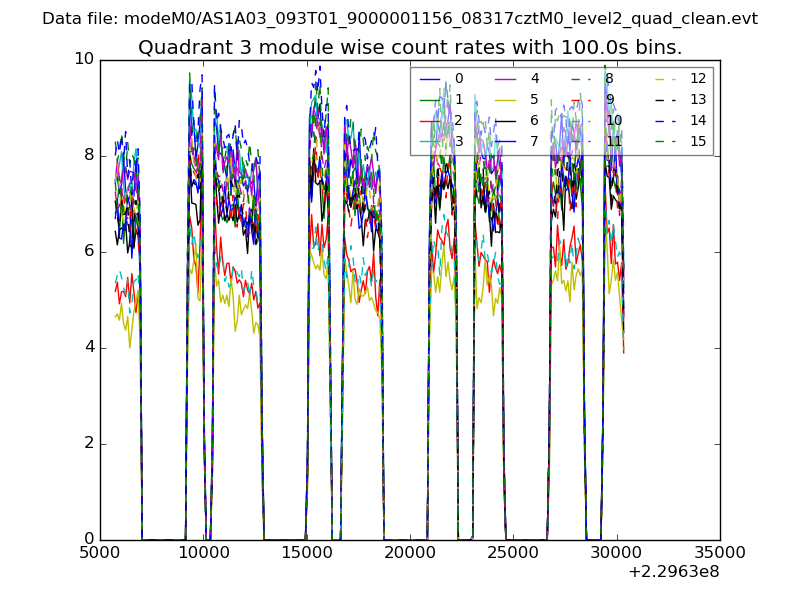
| Module-wise count rates for Quadrant C Data is divided into 100 sec bins |
 |
 |
| Module-wise count rates for Quadrant D Data is divided into 100 sec bins |
 |
 |
| Parameter | Plot |
|---|---|
| CZT HV Monitor | 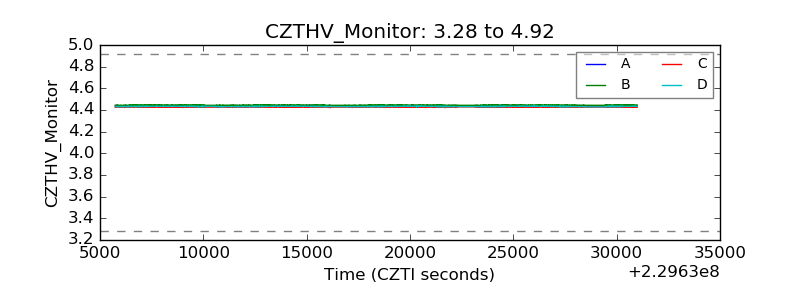 |
| D_VDD |  |
| Temperature 1 | 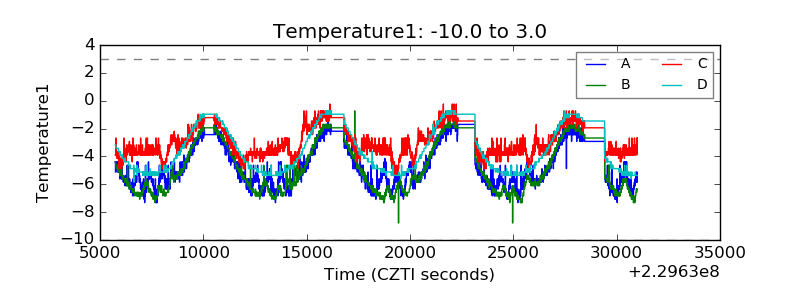 |
| Veto HV Monitor | 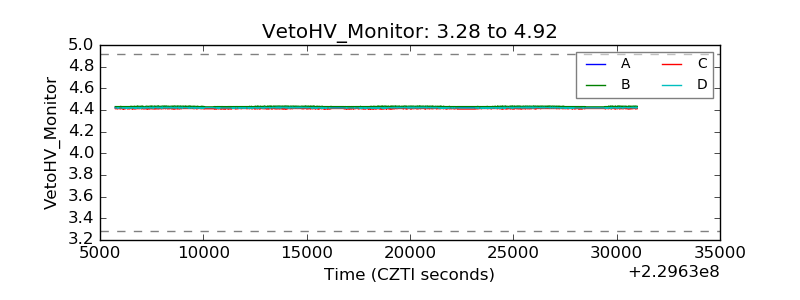 |
| Veto LLD | 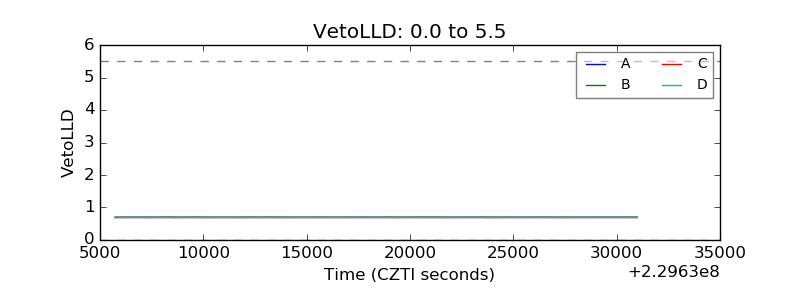 |
| Alpha Counter | 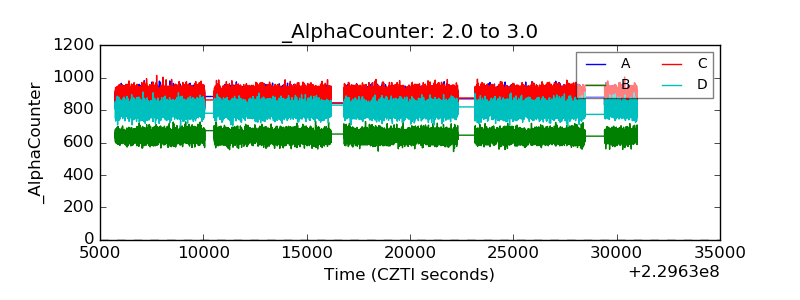 |
| _CPM_Rate | 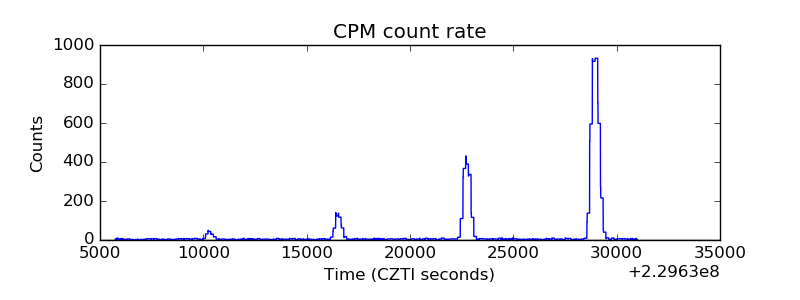 |
| CZT Counter | 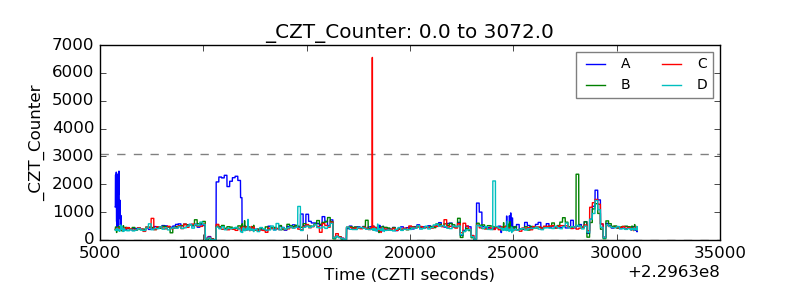 |
| +2.5 Volts monitor |  |
| +5 Volts monitor |  |
| _ROLL_ROT | 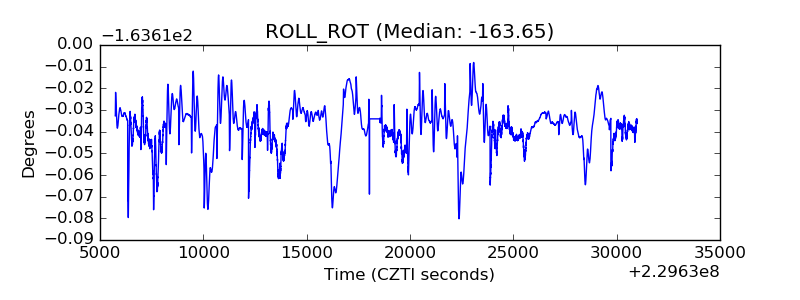 |
| _Roll_DEC | 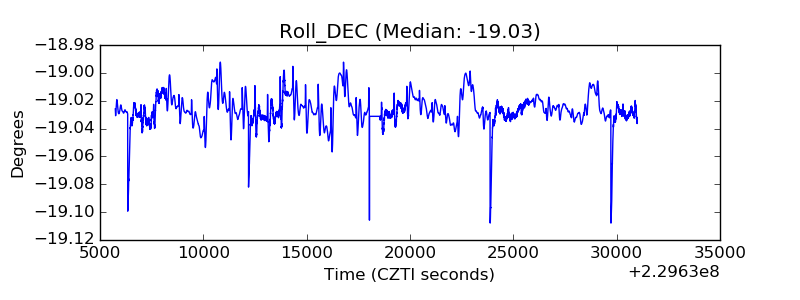 |
| _Roll_RA | 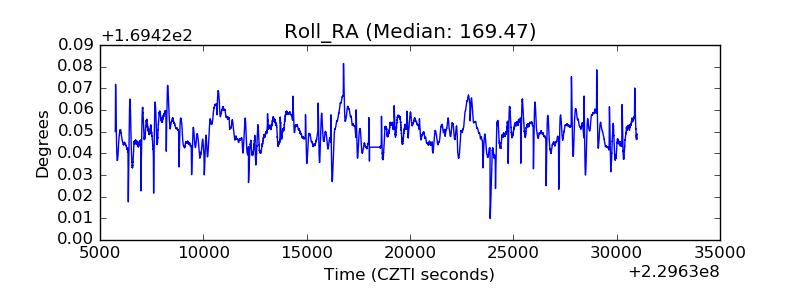 |
| Veto Counter | 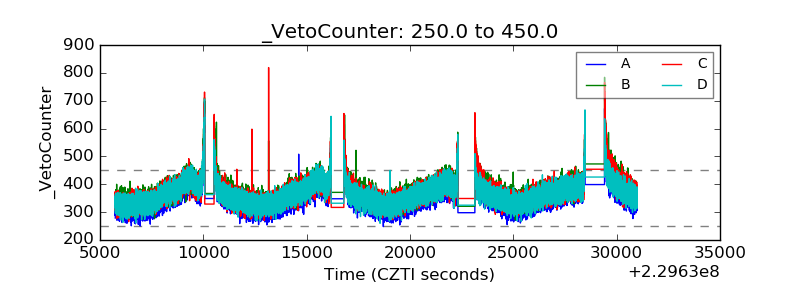 |