| Param | Original file | Final file |
|---|---|---|
| Filename | modeM0/AS1A03_093T01_9000001156_08319cztM0_level2.evt | modeM0/AS1A03_093T01_9000001156_08319cztM0_level2_quad_clean.evt |
| Size (bytes) | 411,805,440 | 68,587,200 |
| Size | 392.7 MB | 65.4 MB |
| Events in quadrant A | 3,039,722 | 409,799 |
| Events in quadrant B | 3,103,852 | 419,729 |
| Events in quadrant C | 2,864,277 | 409,183 |
| Events in quadrant D | 3,029,796 | 392,964 |
| Mode M9 | |||
|---|---|---|---|
| Quadrant | BADHDUFLAG | Total packets | Discarded packets |
| A | 0 | 11 | 0 |
| B | 0 | 11 | 0 |
| C | 0 | 11 | 0 |
| D | 0 | 11 | 0 |
| Mode M0 | |||
|---|---|---|---|
| Quadrant | BADHDUFLAG | Total packets | Discarded packets |
| A | 0 | 13314 | 2 |
| B | 0 | 13275 | 1 |
| C | 0 | 12880 | 1 |
| D | 0 | 13553 | 1 |
| Mode SS | |||
|---|---|---|---|
| Quadrant | BADHDUFLAG | Total packets | Discarded packets |
| A | 0 | 130 | 0 |
| B | 0 | 130 | 0 |
| C | 0 | 130 | 0 |
| D | 0 | 130 | 0 |
| Quadrant | Total seconds | Saturated seconds | Saturation percentage |
|---|---|---|---|
| A | 6376 | 51 | 0.799875% |
| B | 6376 | 17 | 0.266625% |
| C | 6376 | 5 | 0.078419% |
| D | 6376 | 54 | 0.846926% |
Noise dominated data is calculated using 1-second bins in cleaned event files. If a bin has >2000 counts, and if more than 50% of those come from <1% of pixels, then it is considered to be noise-dominated and hence unusable.
| Quadrant | # 1 sec bins | Bins with >0 counts | Bins with >2000 counts | High rate bins dominated by noise | Noise dominated (total time) | Noise dominated (detector-on time) | Marked lightcurve |
|---|---|---|---|---|---|---|---|
| A | 7496 | 6376 | 15 | 15 | 0.20% | 0.24% | 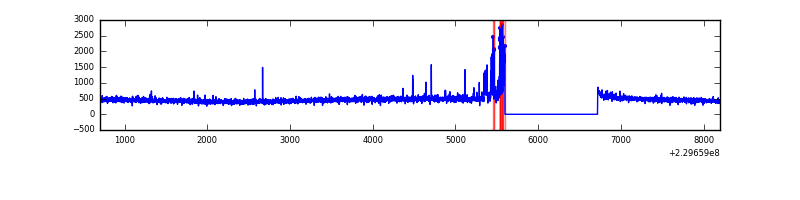 |
| B | 7496 | 6377 | 0 | 0 | 0.00% | 0.00% | 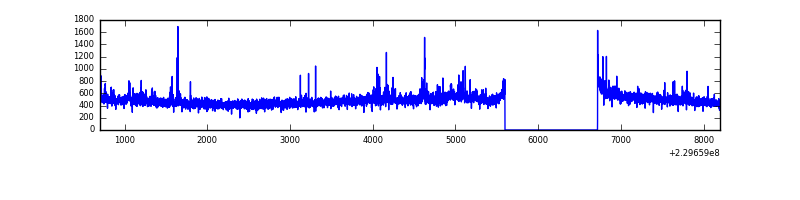 |
| C | 7496 | 6377 | 0 | 0 | 0.00% | 0.00% | 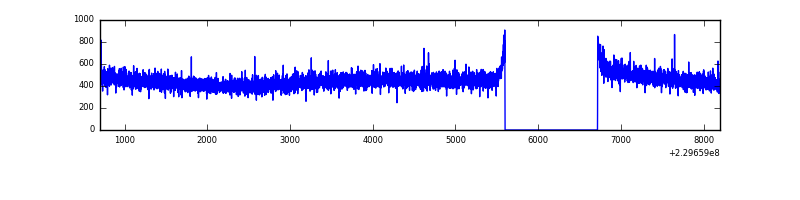 |
| D | 7496 | 6377 | 45 | 45 | 0.60% | 0.71% | 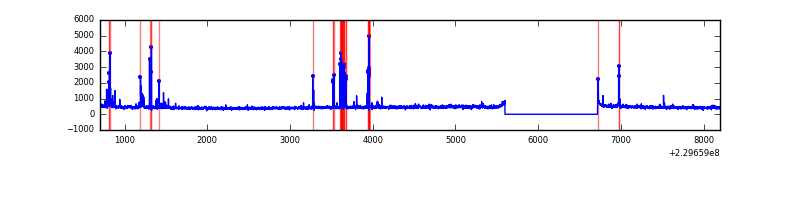 |
Top three noisy pixels from each quadrant. If the there are fewer than three noisy pixels in the level2.evt file, extra rows are filled as -1
| Pixel properties | Quadrant properties | ||||||
|---|---|---|---|---|---|---|---|
| Quadrant | DetID | PixID | Counts | Sigma | Mean | Median | Sigma |
| A | 15 | 239 | 128809 | 834.08 | 749 | 733 | 153.6 |
| A | 13 | 251 | 14222 | 87.85 | 749 | 733 | 153.6 |
| A | 15 | 223 | 8093 | 47.93 | 749 | 733 | 153.6 |
| B | 0 | 214 | 57097 | 390.0 | 761 | 744 | 144.5 |
| B | 4 | 81 | 34228 | 231.73 | 761 | 744 | 144.5 |
| B | 0 | 231 | 26395 | 177.52 | 761 | 744 | 144.5 |
| C | 13 | 61 | 5726 | 29.19 | 733 | 735 | 171.0 |
| C | 8 | 128 | 4153 | 19.99 | 733 | 735 | 171.0 |
| C | 8 | 112 | 2235 | 8.77 | 733 | 735 | 171.0 |
| D | 1 | 52 | 130603 | 664.78 | 719 | 707 | 195.4 |
| D | 2 | 14 | 102064 | 518.72 | 719 | 707 | 195.4 |
| D | 12 | 221 | 38954 | 195.74 | 719 | 707 | 195.4 |
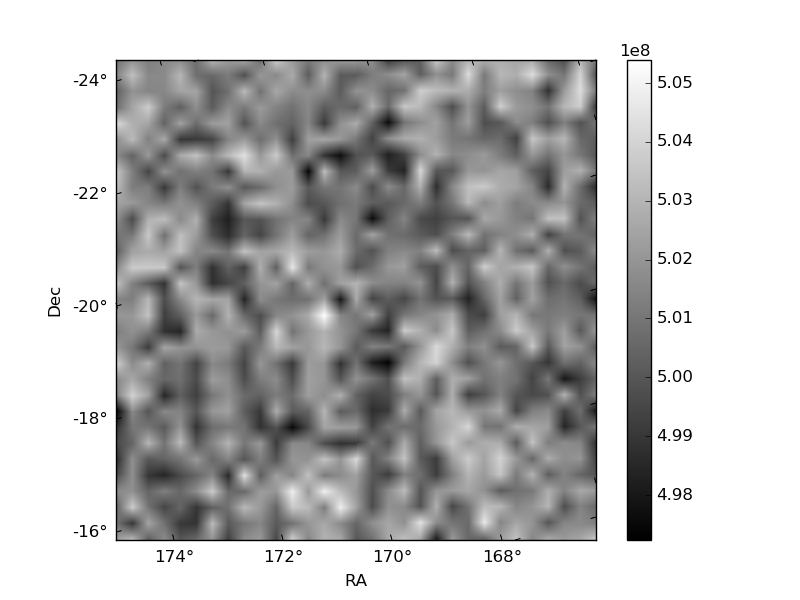
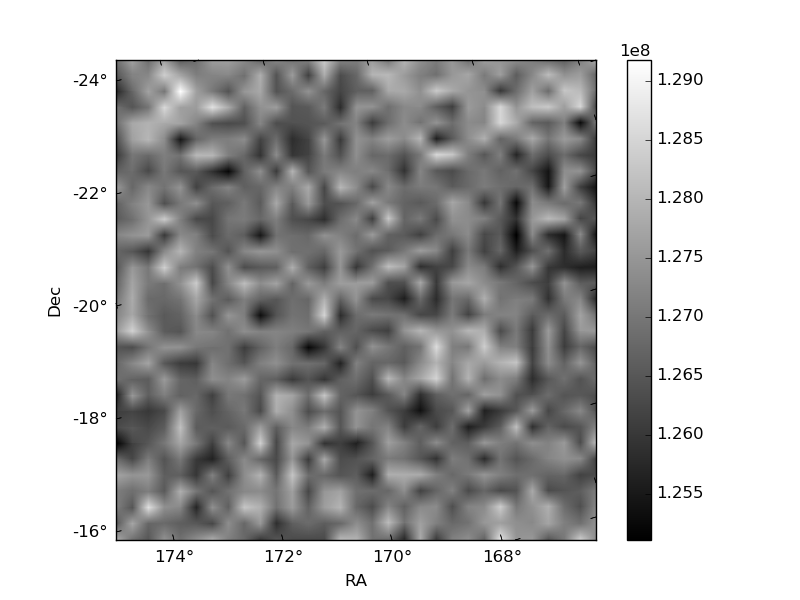
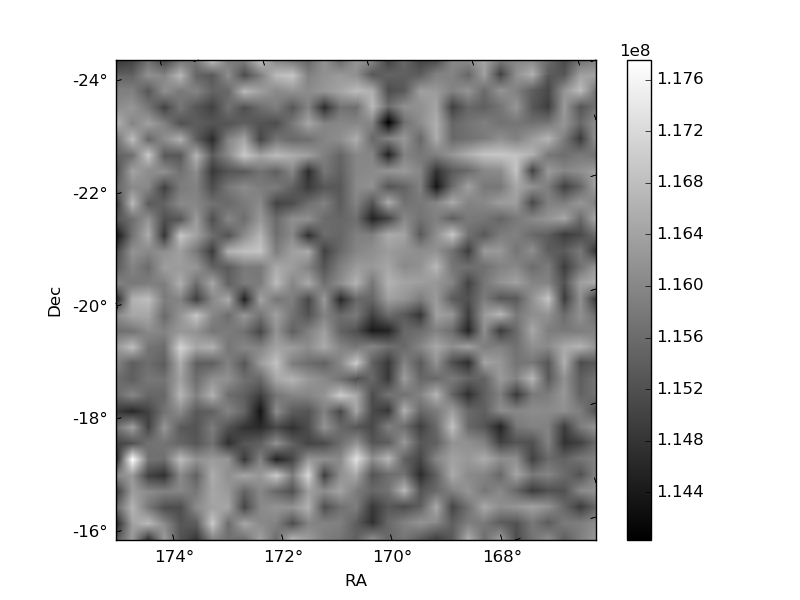
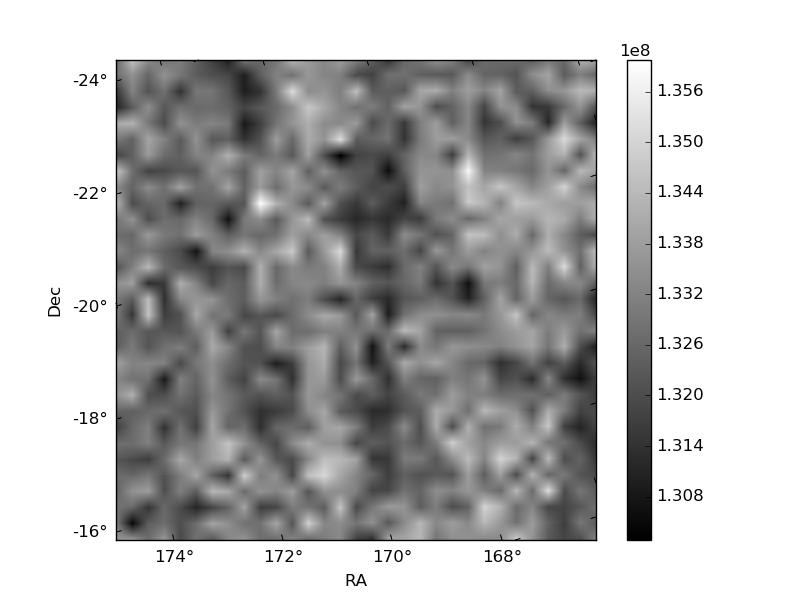
Histogram calculated using DETX and DETY for each event in the final _common_clean file
| Quadrant A | 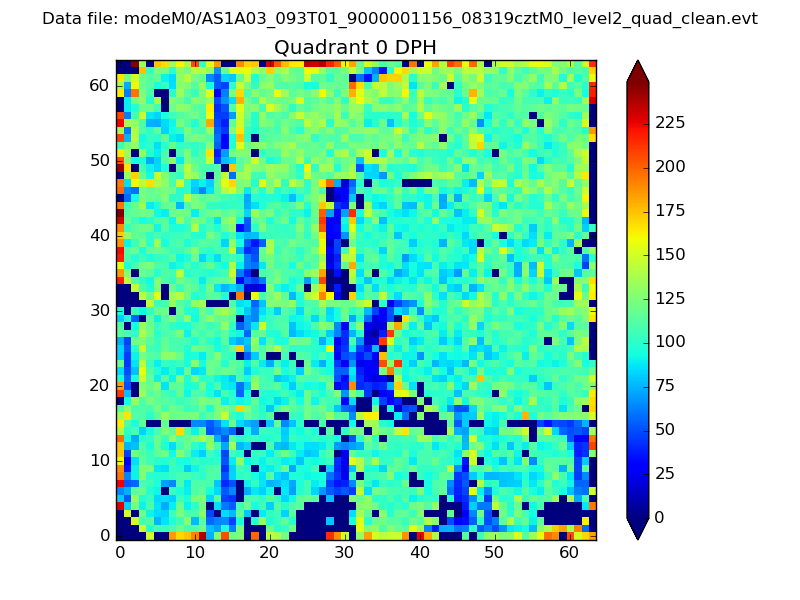 |
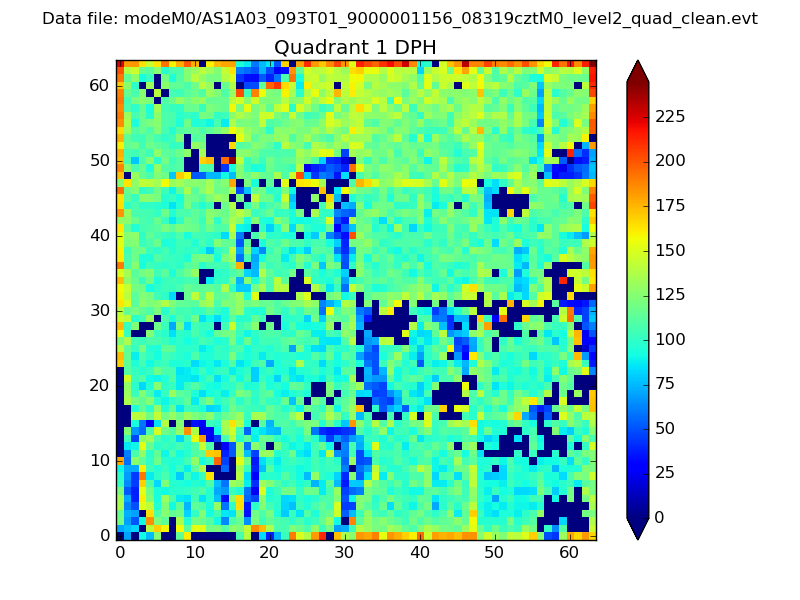 |
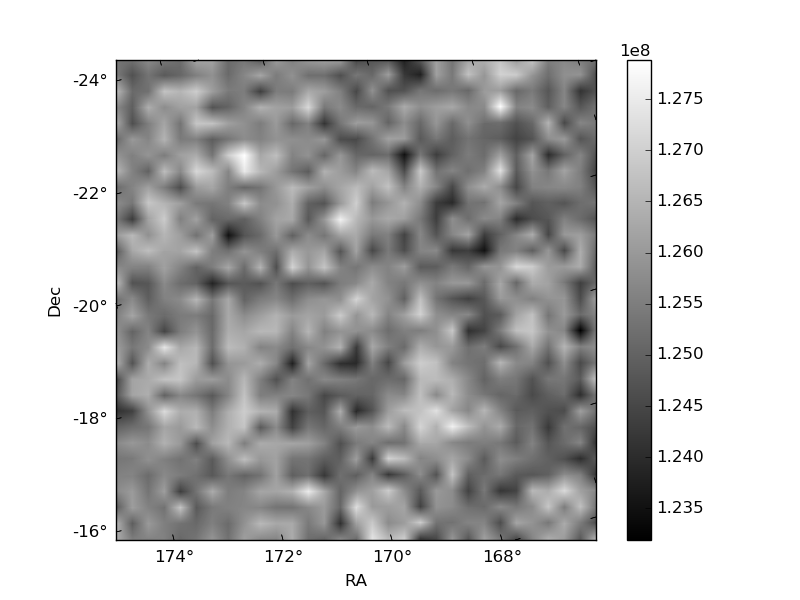
Quadrant B |
|---|---|---|---|
| Quadrant D | 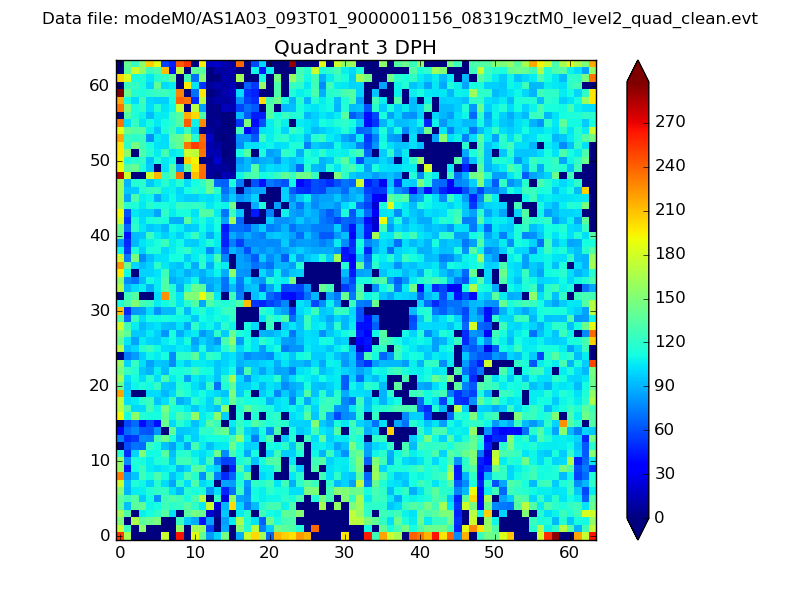 |
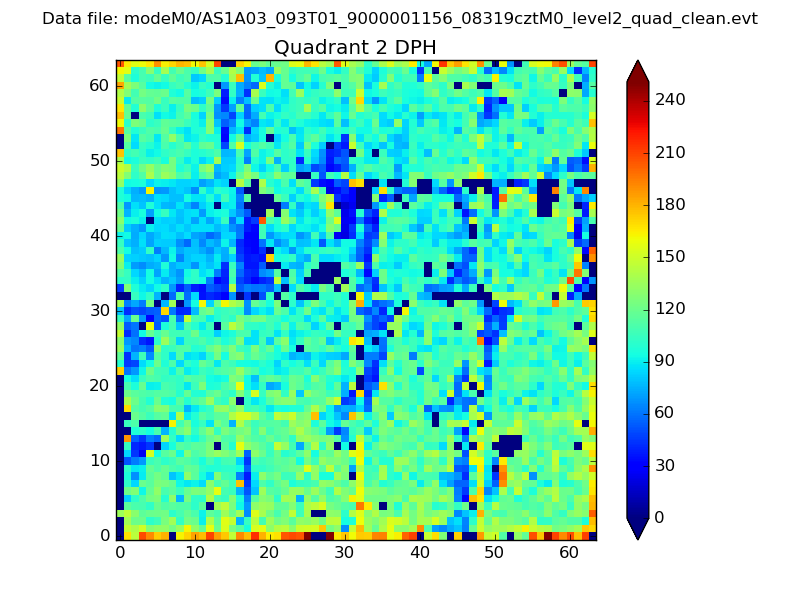 |
Quadrant C |
| Plot type | Count rate plots | Images |
|---|---|---|
| Comparison with Poisson distribution Blue bars denote a histogram of data divided into 1 sec bins. Red curve is a Poisson curve with rate = median count rate of data. |
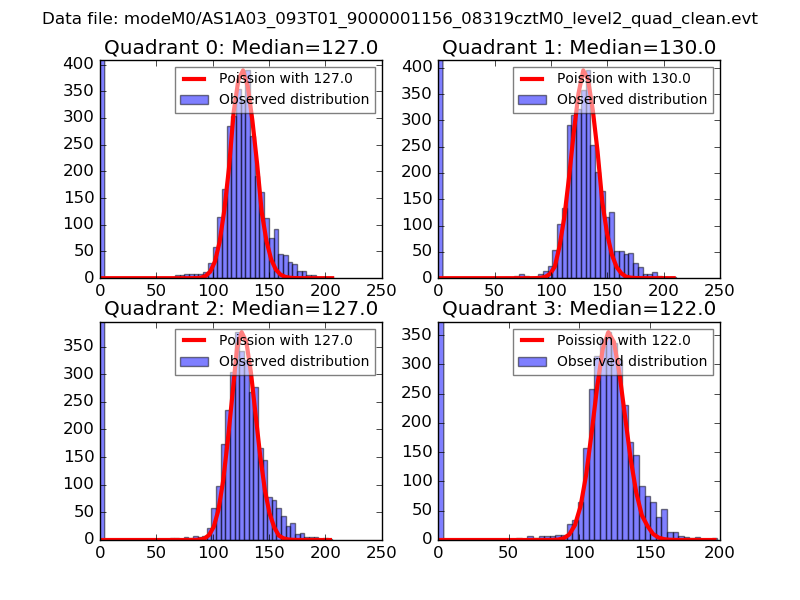 |
 |
| Quadrant-wise count rates Data is divided into 100 sec bins |
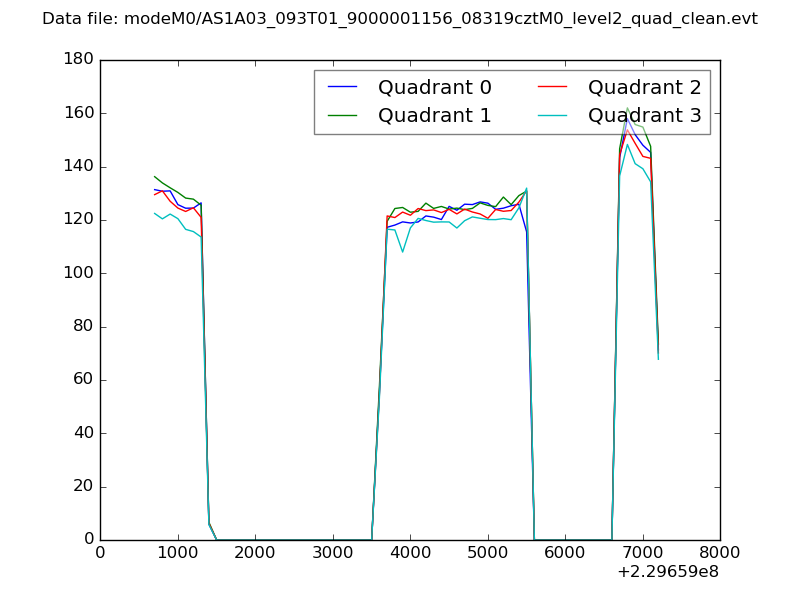 |
|
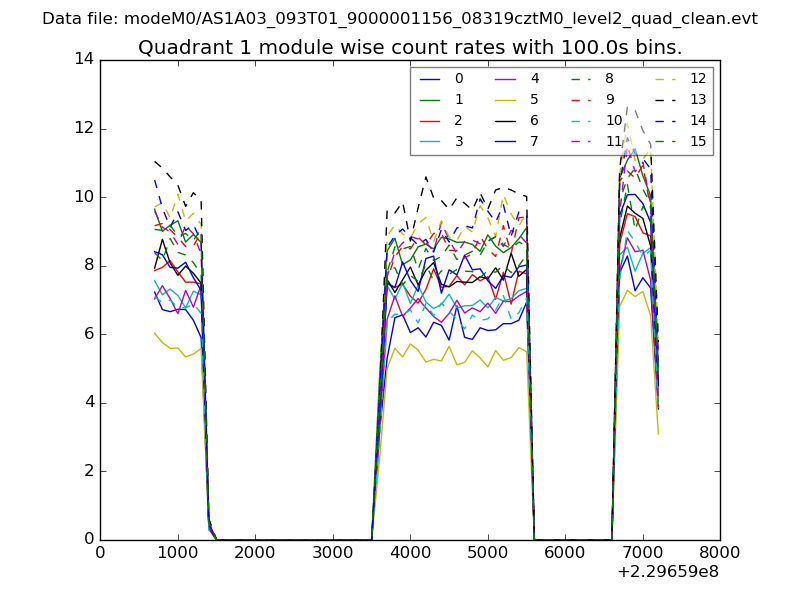
| Module-wise count rates for Quadrant A Data is divided into 100 sec bins |
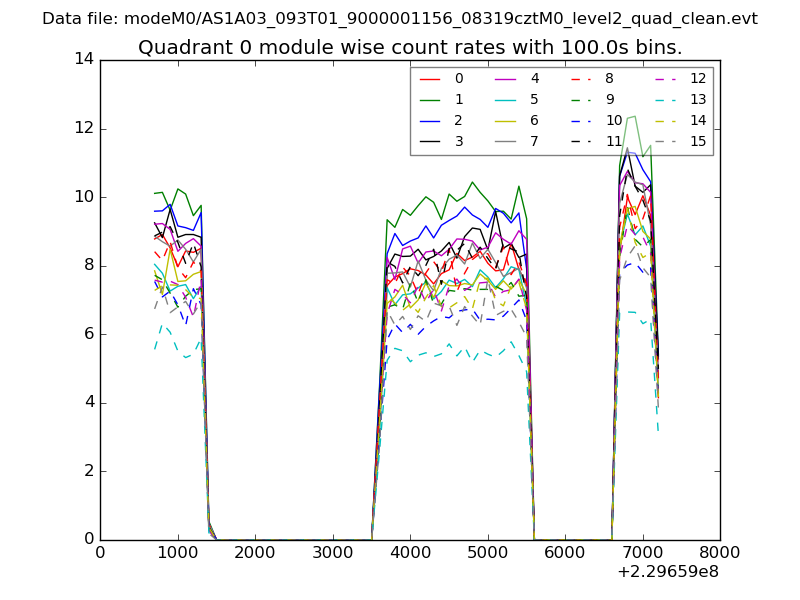 |
 |
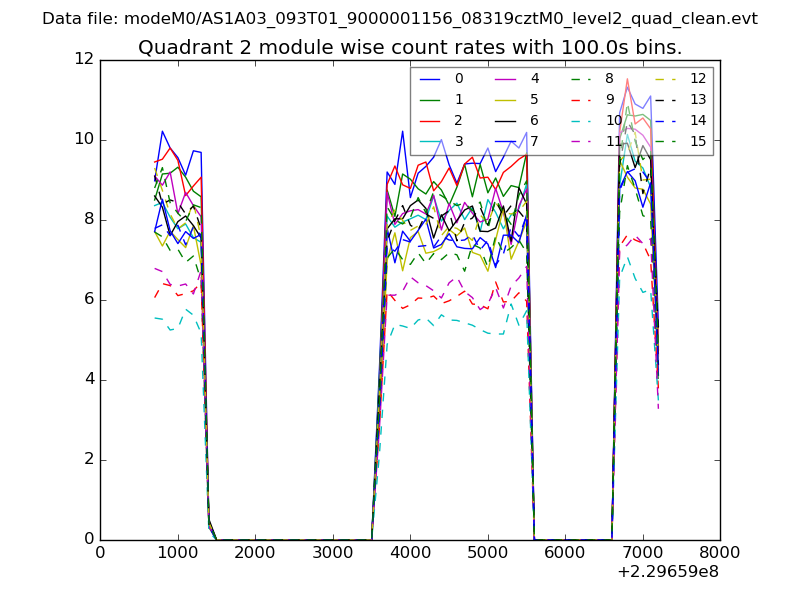
| Module-wise count rates for Quadrant B Data is divided into 100 sec bins |
 |
 |
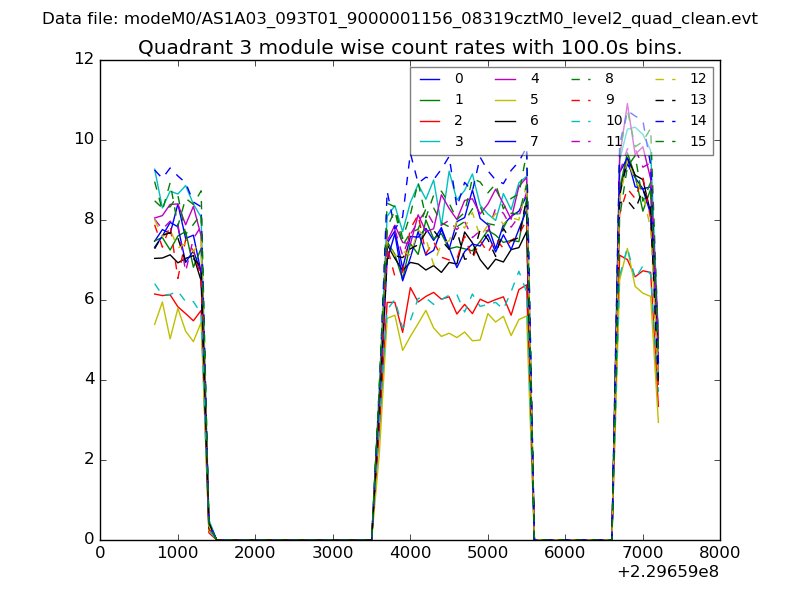
| Module-wise count rates for Quadrant C Data is divided into 100 sec bins |
 |
 |
| Module-wise count rates for Quadrant D Data is divided into 100 sec bins |
 |
 |
| Parameter | Plot |
|---|---|
| CZT HV Monitor | 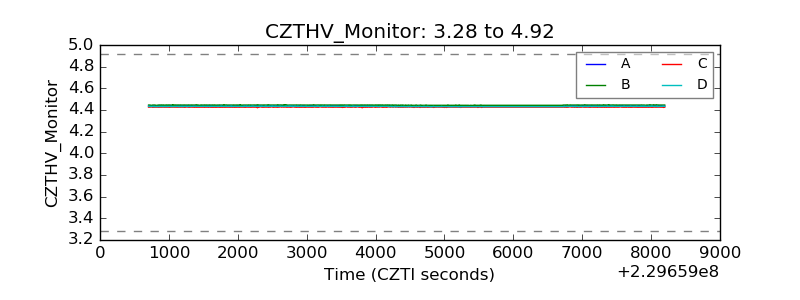 |
| D_VDD | 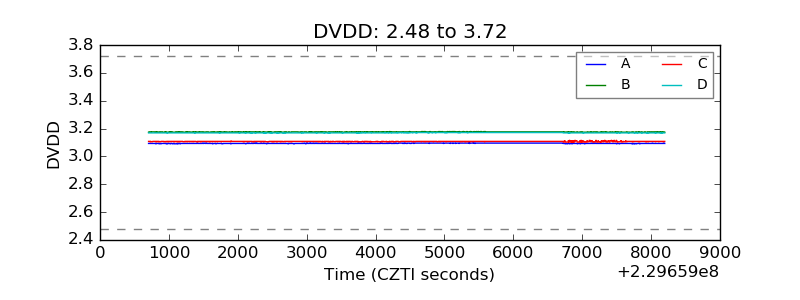 |
| Temperature 1 | 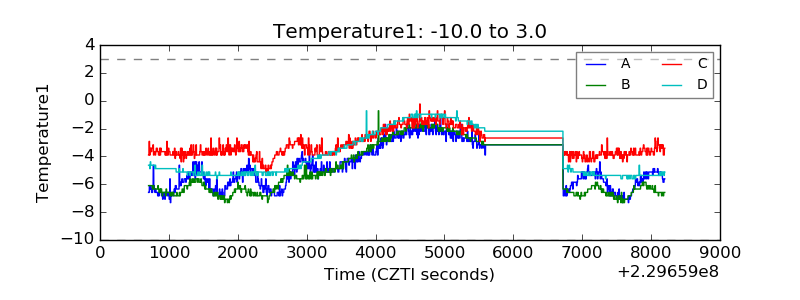 |
| Veto HV Monitor | 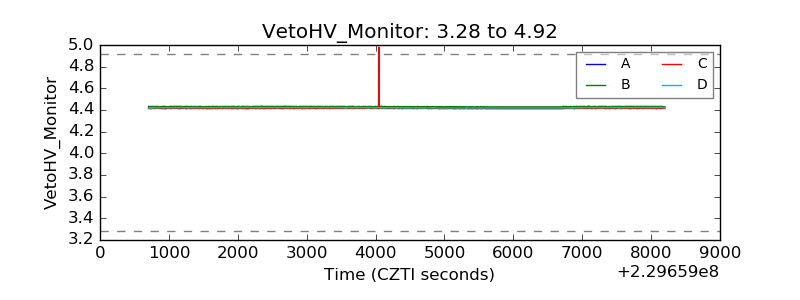 |
| Veto LLD | 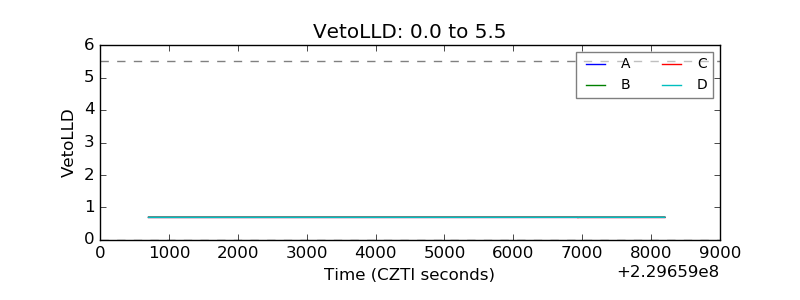 |
| Alpha Counter | 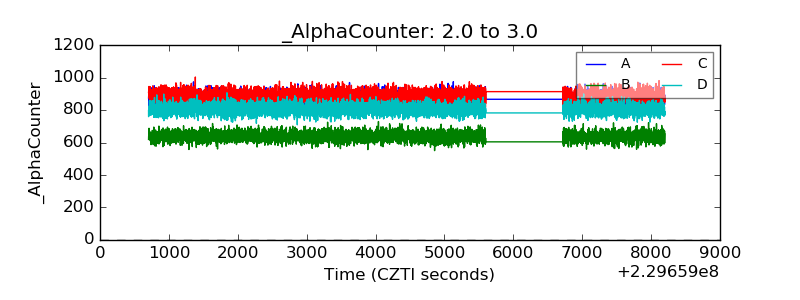 |
| _CPM_Rate | 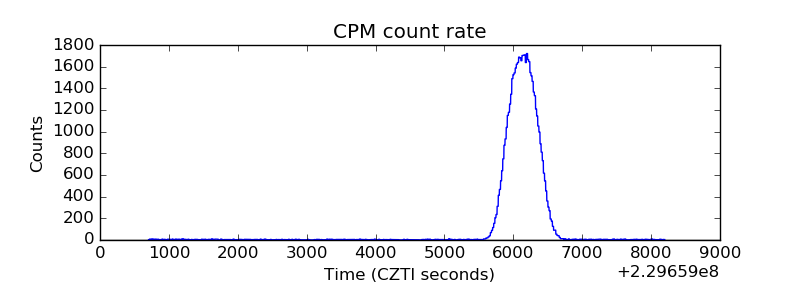 |
| CZT Counter | 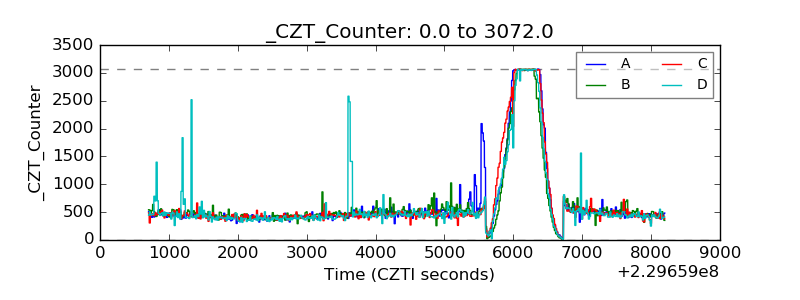 |
| +2.5 Volts monitor | 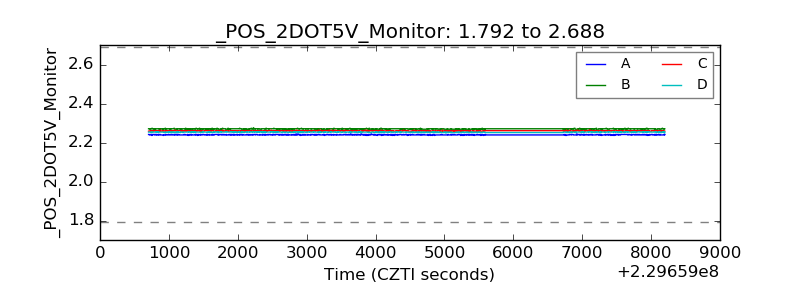 |
| +5 Volts monitor |  |
| _ROLL_ROT | 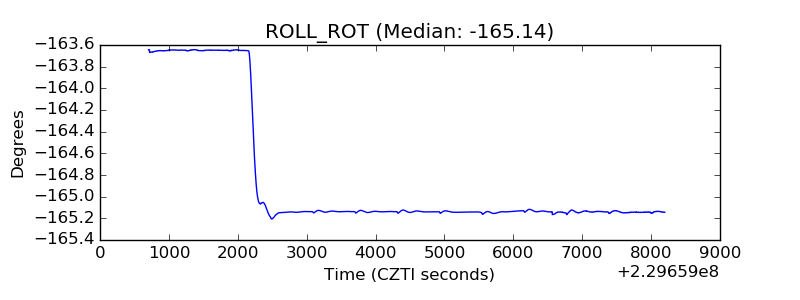 |
| _Roll_DEC | 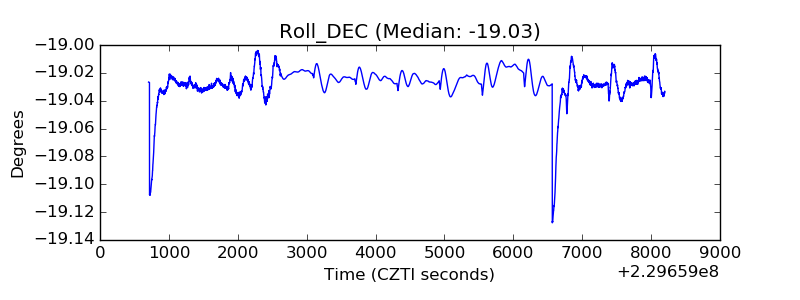 |
| _Roll_RA | 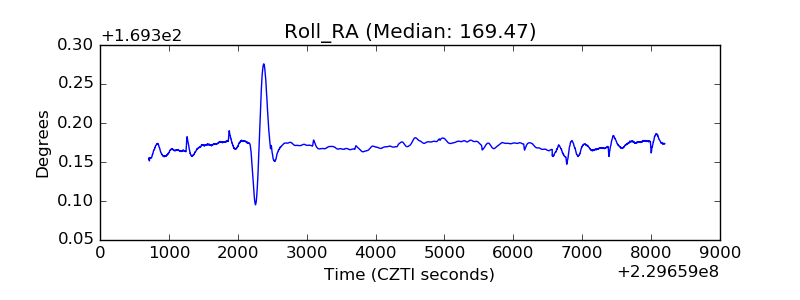 |
| Veto Counter | 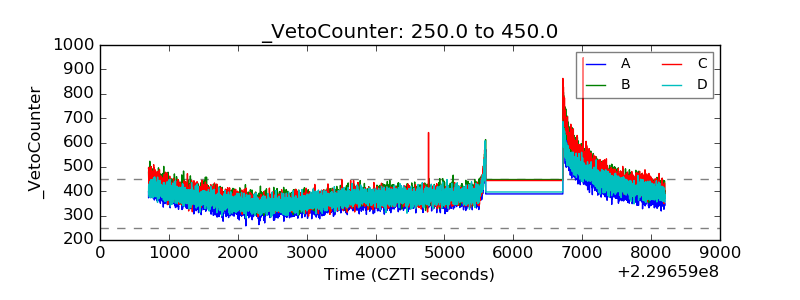 |