| Param | Original file | Final file |
|---|---|---|
| Filename | modeM0/AS1A03_093T01_9000001156_08320cztM0_level2.evt | modeM0/AS1A03_093T01_9000001156_08320cztM0_level2_quad_clean.evt |
| Size (bytes) | 433,713,600 | 65,583,360 |
| Size | 413.6 MB | 62.5 MB |
| Events in quadrant A | 3,111,503 | 384,912 |
| Events in quadrant B | 3,261,453 | 394,410 |
| Events in quadrant C | 3,064,108 | 383,729 |
| Events in quadrant D | 3,258,017 | 371,222 |
| Mode M9 | |||
|---|---|---|---|
| Quadrant | BADHDUFLAG | Total packets | Discarded packets |
| A | 0 | 12 | 0 |
| B | 0 | 12 | 0 |
| C | 0 | 12 | 0 |
| D | 0 | 12 | 0 |
| Mode M0 | |||
|---|---|---|---|
| Quadrant | BADHDUFLAG | Total packets | Discarded packets |
| A | 0 | 13317 | 3 |
| B | 0 | 13677 | 2 |
| C | 0 | 13294 | 2 |
| D | 0 | 14058 | 2 |
| Mode SS | |||
|---|---|---|---|
| Quadrant | BADHDUFLAG | Total packets | Discarded packets |
| A | 0 | 132 | 0 |
| B | 0 | 132 | 0 |
| C | 0 | 132 | 0 |
| D | 0 | 132 | 0 |
| Quadrant | Total seconds | Saturated seconds | Saturation percentage |
|---|---|---|---|
| A | 6468 | 31 | 0.479283% |
| B | 6468 | 57 | 0.881262% |
| C | 6468 | 38 | 0.587508% |
| D | 6468 | 87 | 1.345083% |
Noise dominated data is calculated using 1-second bins in cleaned event files. If a bin has >2000 counts, and if more than 50% of those come from <1% of pixels, then it is considered to be noise-dominated and hence unusable.
| Quadrant | # 1 sec bins | Bins with >0 counts | Bins with >2000 counts | High rate bins dominated by noise | Noise dominated (total time) | Noise dominated (detector-on time) | Marked lightcurve |
|---|---|---|---|---|---|---|---|
| A | 7648 | 6469 | 2 | 2 | 0.03% | 0.03% | 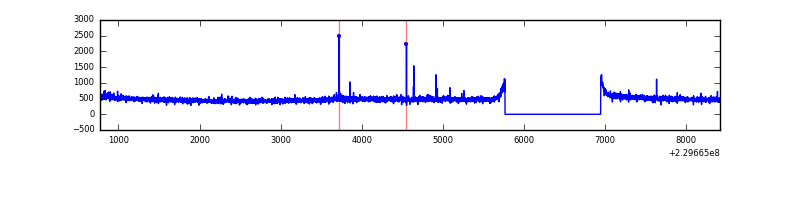 |
| B | 7648 | 6469 | 3 | 3 | 0.04% | 0.05% | 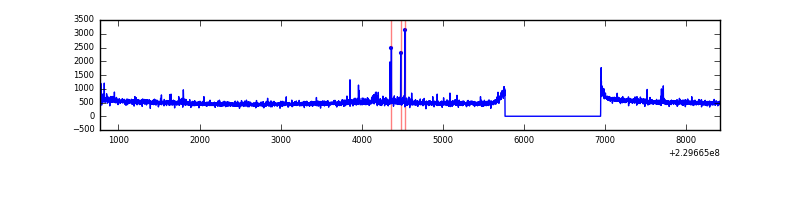 |
| C | 7648 | 6468 | 0 | 0 | 0.00% | 0.00% | 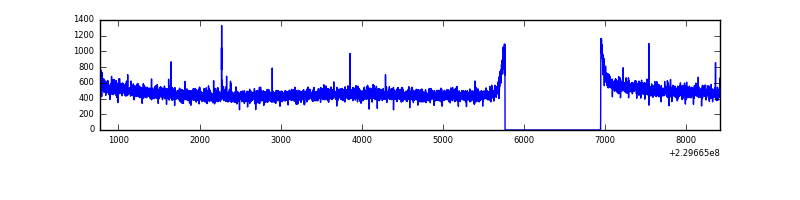 |
| D | 7648 | 6469 | 45 | 45 | 0.59% | 0.70% | 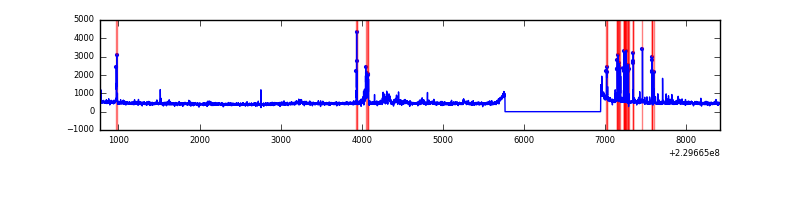 |
Top three noisy pixels from each quadrant. If the there are fewer than three noisy pixels in the level2.evt file, extra rows are filled as -1
| Pixel properties | Quadrant properties | ||||||
|---|---|---|---|---|---|---|---|
| Quadrant | DetID | PixID | Counts | Sigma | Mean | Median | Sigma |
| A | 13 | 248 | 17340 | 101.77 | 802 | 785 | 162.7 |
| A | 0 | 226 | 7672 | 42.34 | 802 | 785 | 162.7 |
| A | 12 | 194 | 7131 | 39.01 | 802 | 785 | 162.7 |
| B | 0 | 214 | 65427 | 419.29 | 815 | 797 | 154.1 |
| B | 4 | 81 | 20381 | 127.05 | 815 | 797 | 154.1 |
| B | 0 | 219 | 17138 | 106.01 | 815 | 797 | 154.1 |
| C | 9 | 54 | 7701 | 38.12 | 782 | 787 | 181.4 |
| C | 13 | 61 | 6067 | 29.11 | 782 | 787 | 181.4 |
| C | 8 | 128 | 4199 | 18.81 | 782 | 787 | 181.4 |
| D | 1 | 52 | 172644 | 859.0 | 773 | 756 | 200.1 |
| D | 13 | 105 | 60348 | 297.81 | 773 | 756 | 200.1 |
| D | 2 | 14 | 37910 | 185.67 | 773 | 756 | 200.1 |
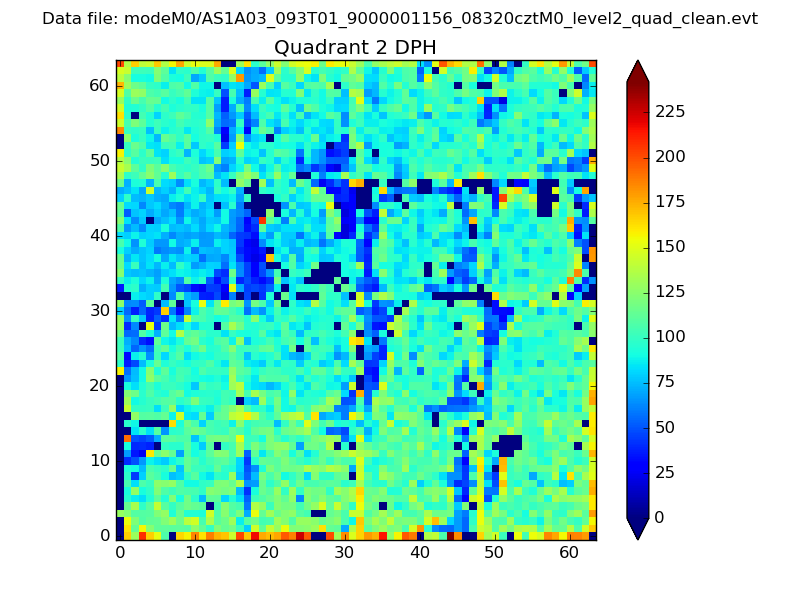
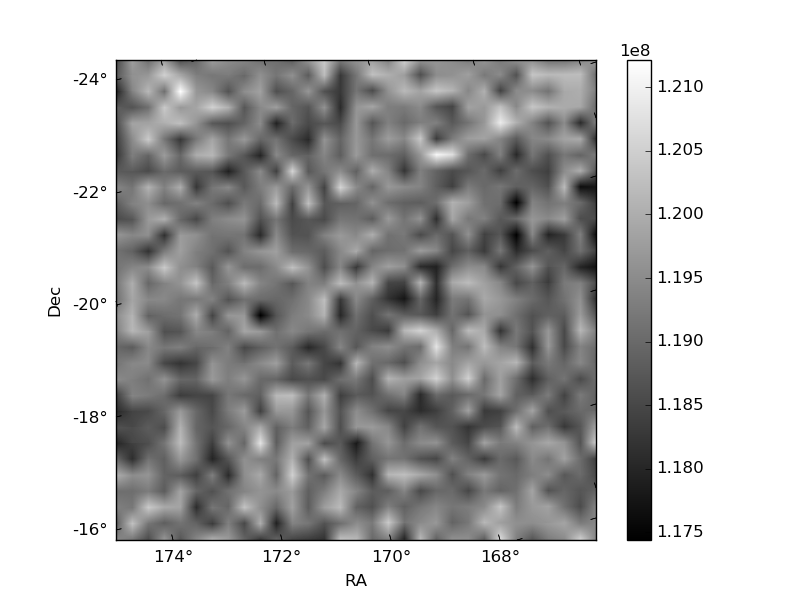
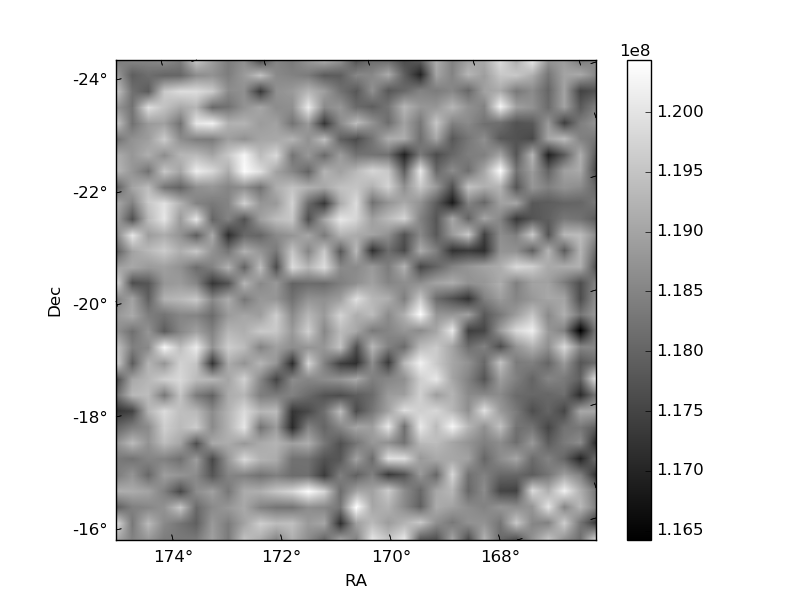
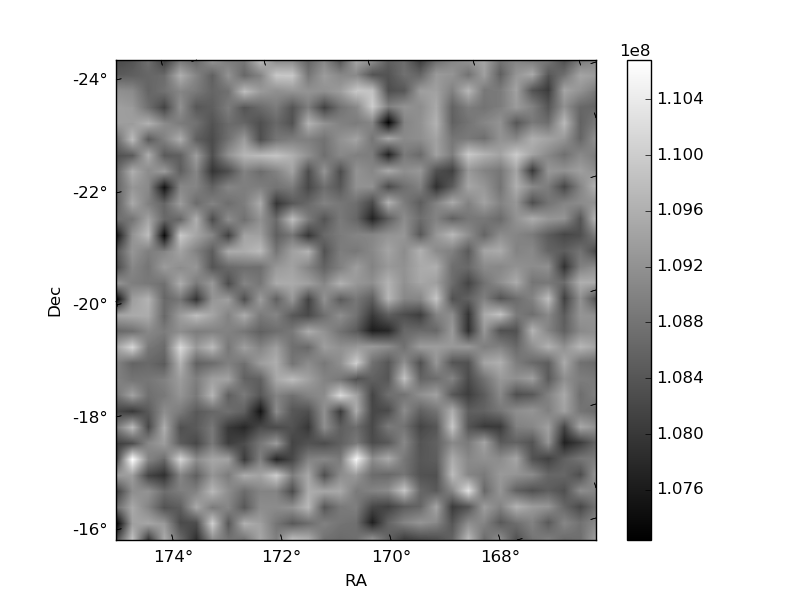
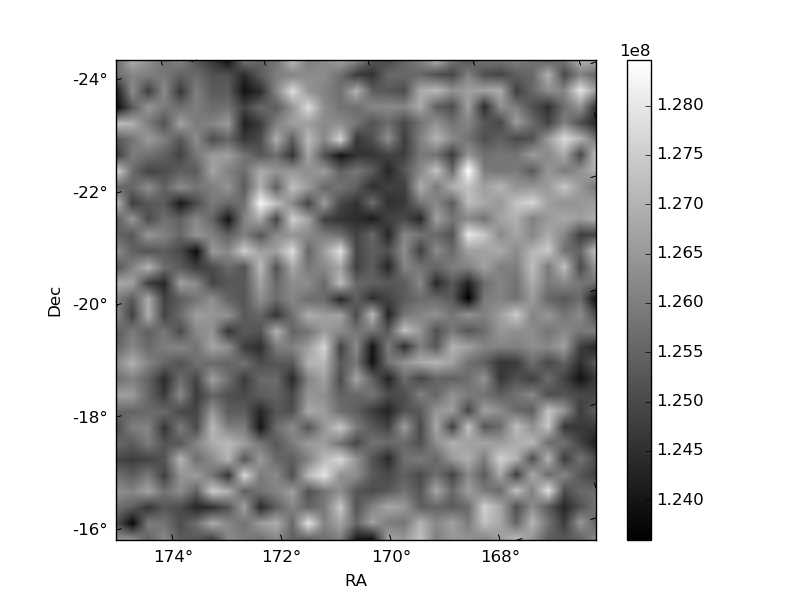
Histogram calculated using DETX and DETY for each event in the final _common_clean file
| Quadrant A | 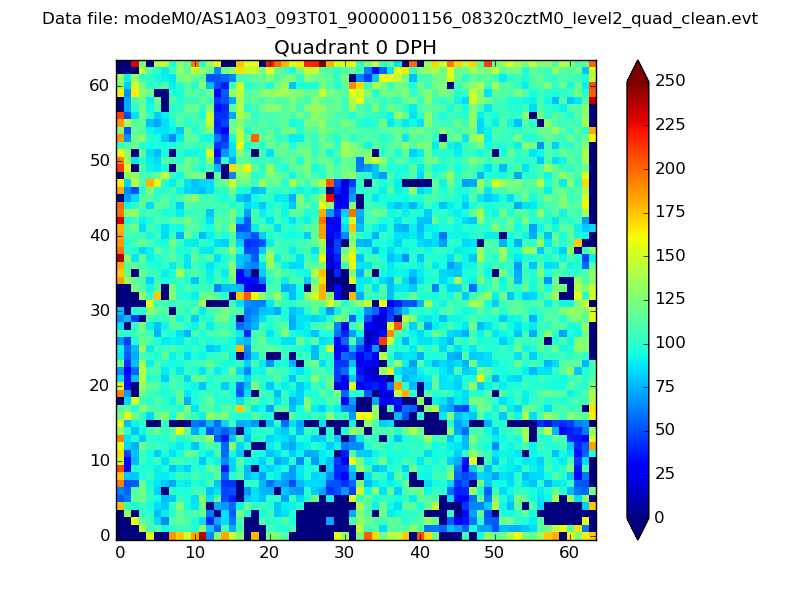 |
 |
Quadrant B |
|---|---|---|---|
| Quadrant D |  |
 |
Quadrant C |
| Plot type | Count rate plots | Images |
|---|---|---|
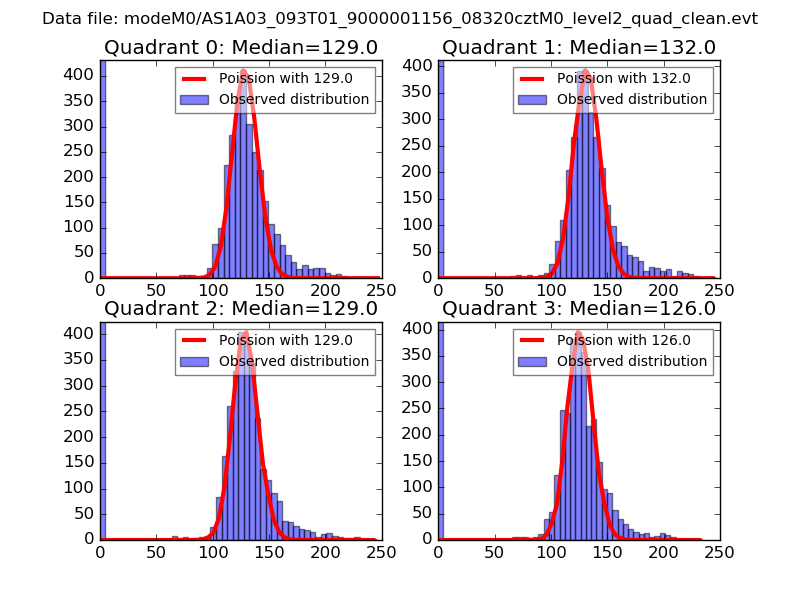
| Comparison with Poisson distribution Blue bars denote a histogram of data divided into 1 sec bins. Red curve is a Poisson curve with rate = median count rate of data. |
 |
 |
| Quadrant-wise count rates Data is divided into 100 sec bins |
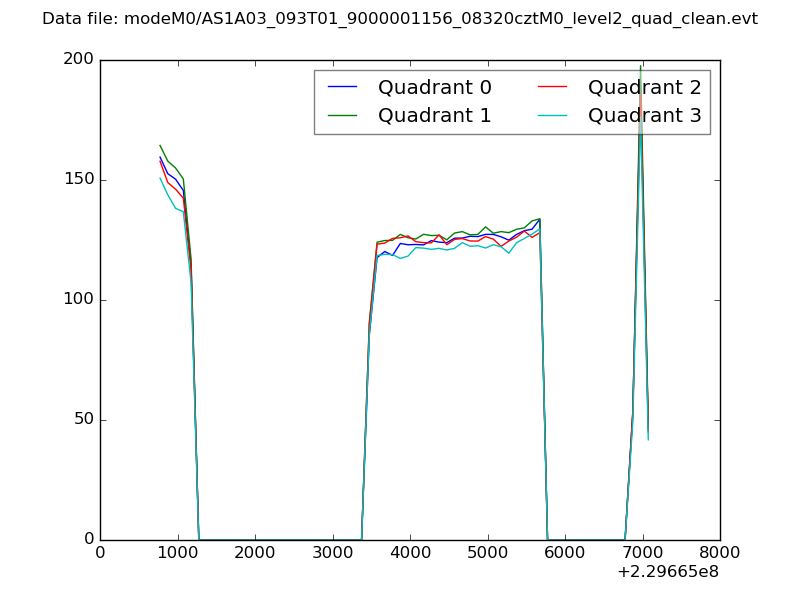 |
|
| Module-wise count rates for Quadrant A Data is divided into 100 sec bins |
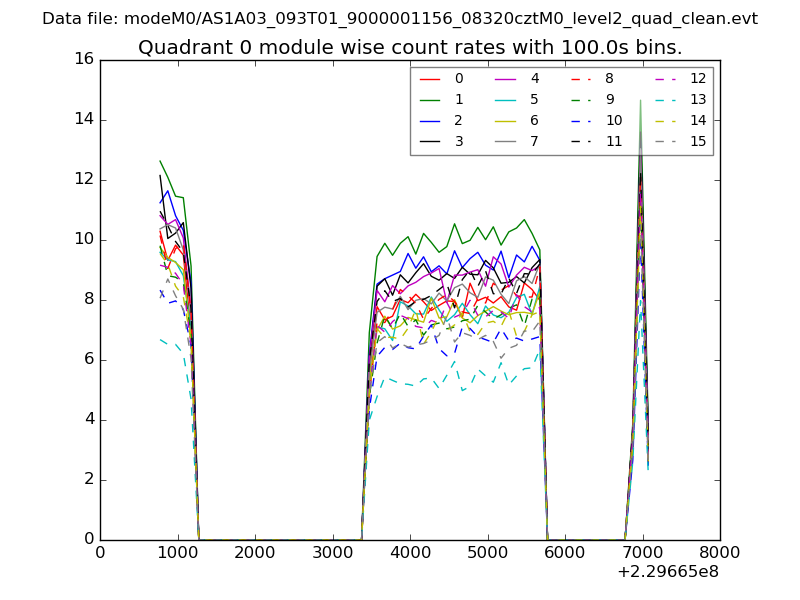 |
 |
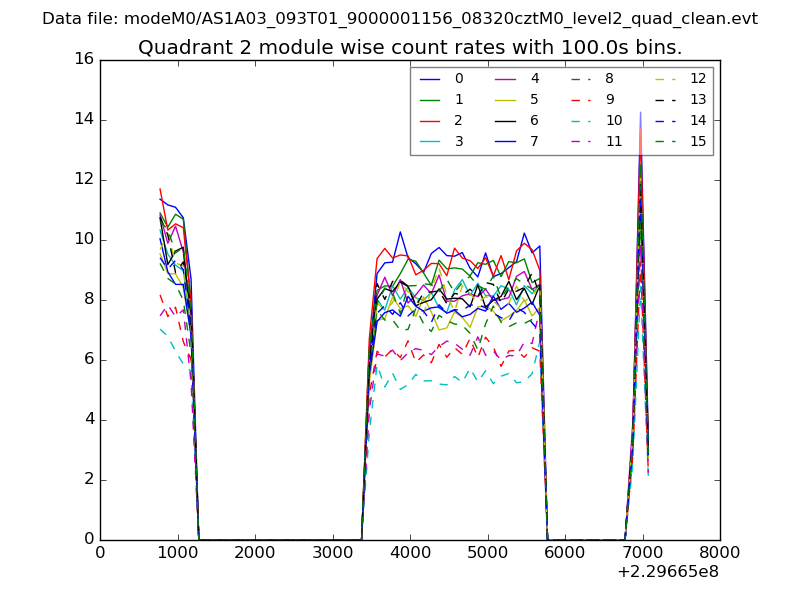
| Module-wise count rates for Quadrant B Data is divided into 100 sec bins |
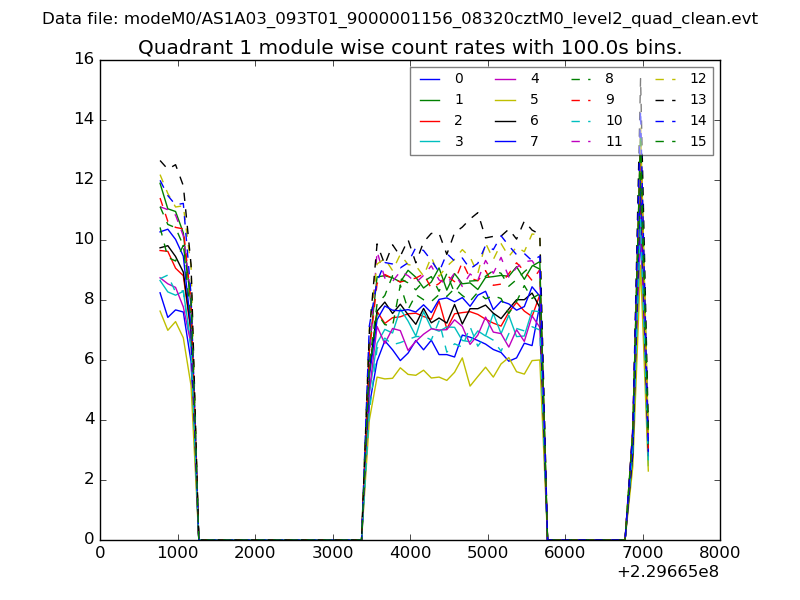 |
 |
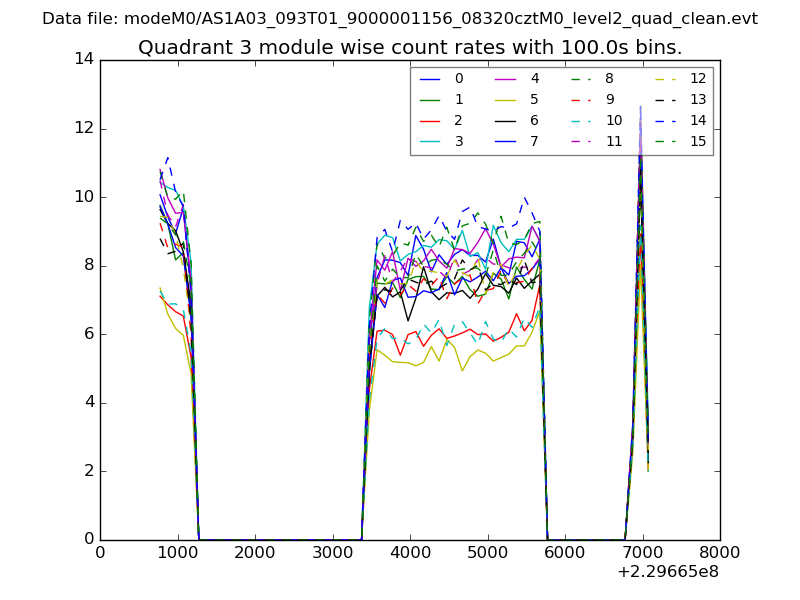
| Module-wise count rates for Quadrant C Data is divided into 100 sec bins |
 |
 |
| Module-wise count rates for Quadrant D Data is divided into 100 sec bins |
 |
 |
| Parameter | Plot |
|---|---|
| CZT HV Monitor | 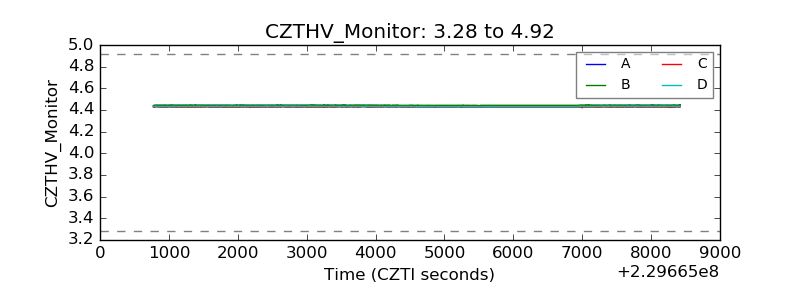 |
| D_VDD | 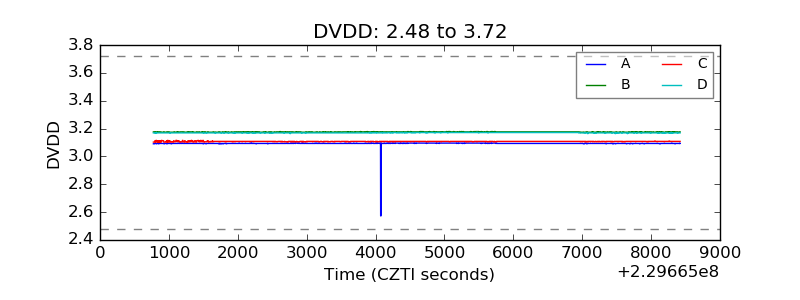 |
| Temperature 1 | 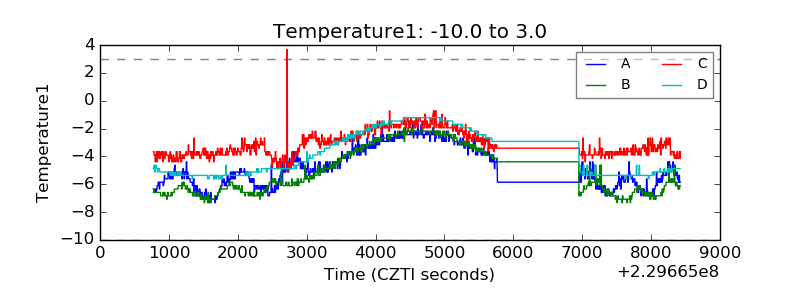 |
| Veto HV Monitor | 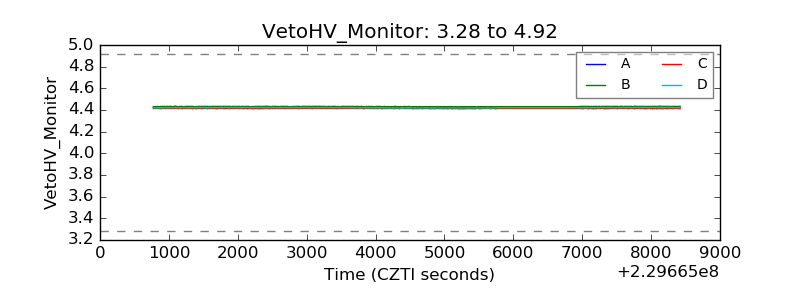 |
| Veto LLD | 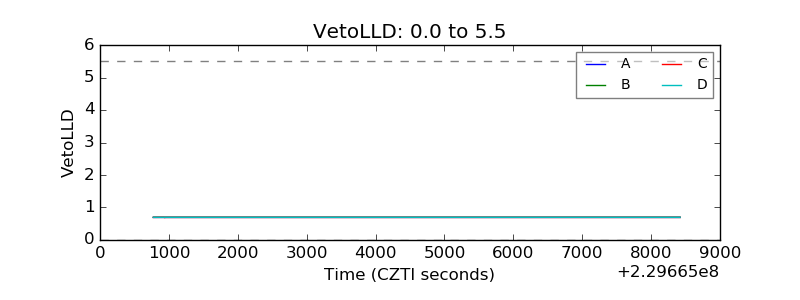 |
| Alpha Counter | 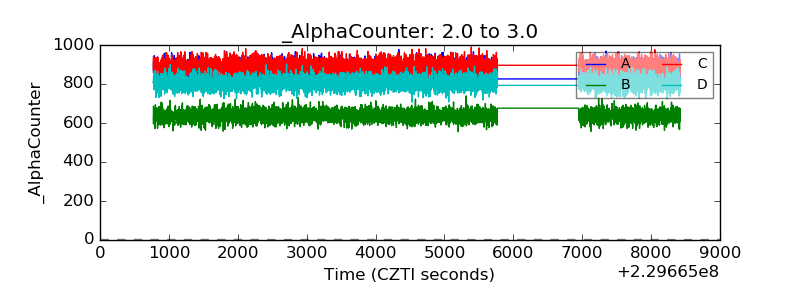 |
| _CPM_Rate | 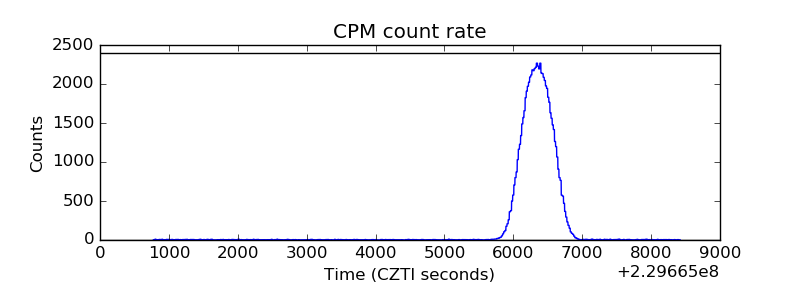 |
| CZT Counter | 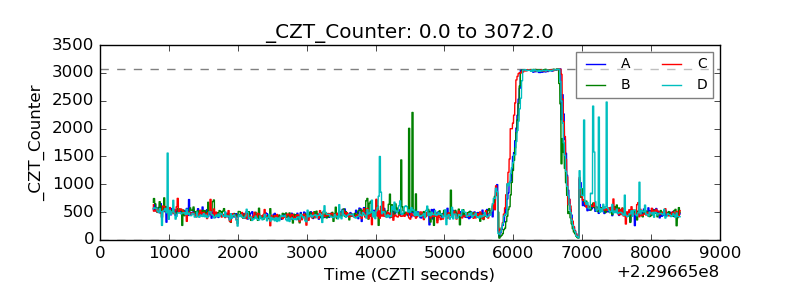 |
| +2.5 Volts monitor |  |
| +5 Volts monitor |  |
| _ROLL_ROT | 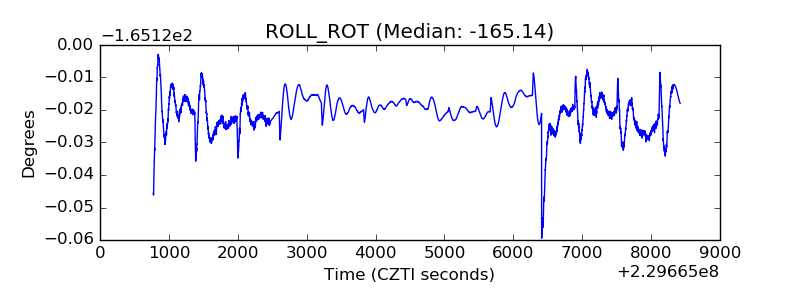 |
| _Roll_DEC | 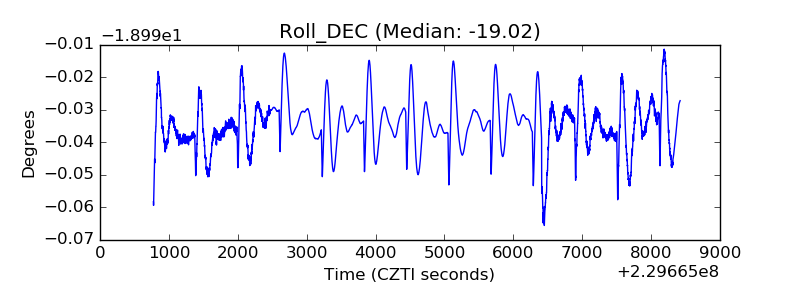 |
| _Roll_RA | 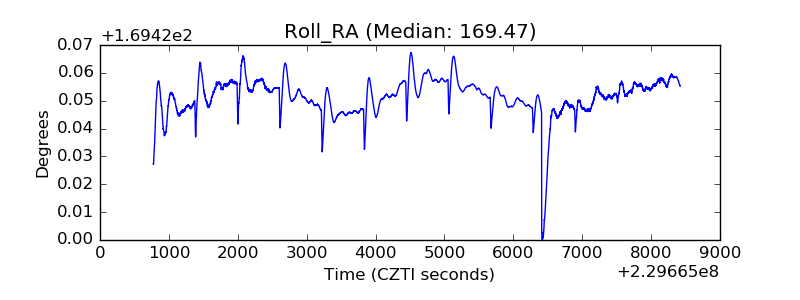 |
| Veto Counter | 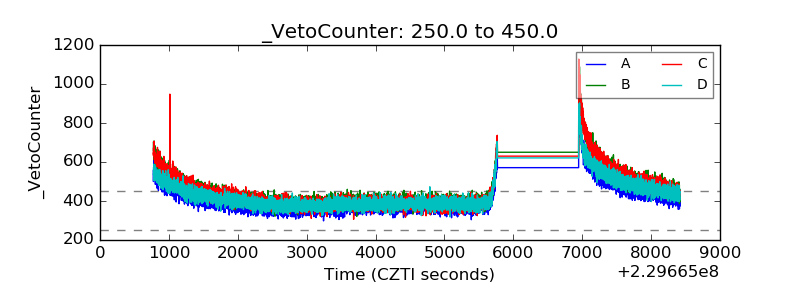 |