| Param | Original file | Final file |
|---|---|---|
| Filename | modeM0/AS1A03_093T01_9000001156_08321cztM0_level2.evt | modeM0/AS1A03_093T01_9000001156_08321cztM0_level2_quad_clean.evt |
| Size (bytes) | 444,565,440 | 62,867,520 |
| Size | 424.0 MB | 60.0 MB |
| Events in quadrant A | 3,212,789 | 365,180 |
| Events in quadrant B | 3,390,367 | 373,460 |
| Events in quadrant C | 3,159,206 | 366,585 |
| Events in quadrant D | 3,268,690 | 353,816 |
| Mode M9 | |||
|---|---|---|---|
| Quadrant | BADHDUFLAG | Total packets | Discarded packets |
| A | 0 | 16 | 0 |
| B | 0 | 16 | 0 |
| C | 0 | 16 | 0 |
| D | 0 | 17 | 0 |
| Mode M0 | |||
|---|---|---|---|
| Quadrant | BADHDUFLAG | Total packets | Discarded packets |
| A | 0 | 13357 | 3 |
| B | 0 | 13827 | 2 |
| C | 0 | 13343 | 2 |
| D | 0 | 13834 | 2 |
| Mode SS | |||
|---|---|---|---|
| Quadrant | BADHDUFLAG | Total packets | Discarded packets |
| A | 0 | 128 | 0 |
| B | 0 | 128 | 0 |
| C | 0 | 128 | 0 |
| D | 0 | 128 | 0 |
| Quadrant | Total seconds | Saturated seconds | Saturation percentage |
|---|---|---|---|
| A | 6370 | 49 | 0.769231% |
| B | 6370 | 66 | 1.036107% |
| C | 6370 | 55 | 0.863422% |
| D | 6370 | 114 | 1.789639% |
Noise dominated data is calculated using 1-second bins in cleaned event files. If a bin has >2000 counts, and if more than 50% of those come from <1% of pixels, then it is considered to be noise-dominated and hence unusable.
| Quadrant | # 1 sec bins | Bins with >0 counts | Bins with >2000 counts | High rate bins dominated by noise | Noise dominated (total time) | Noise dominated (detector-on time) | Marked lightcurve |
|---|---|---|---|---|---|---|---|
| A | 7640 | 6371 | 0 | 0 | 0.00% | 0.00% | 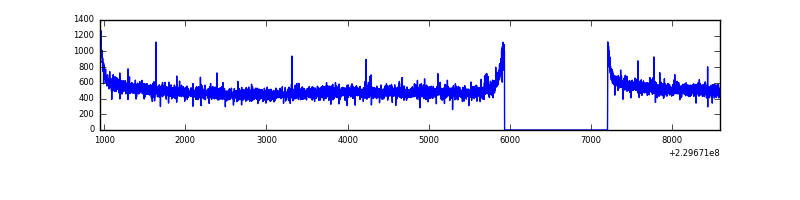 |
| B | 7640 | 6371 | 2 | 2 | 0.03% | 0.03% | 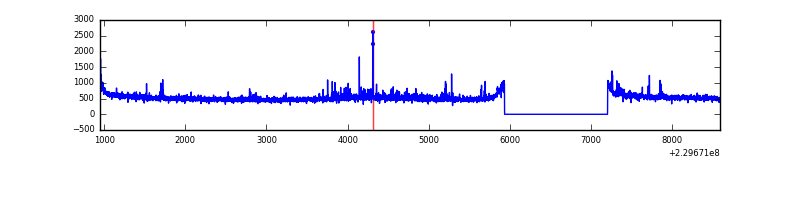 |
| C | 7640 | 6371 | 0 | 0 | 0.00% | 0.00% |  |
| D | 7640 | 6371 | 47 | 47 | 0.62% | 0.74% | 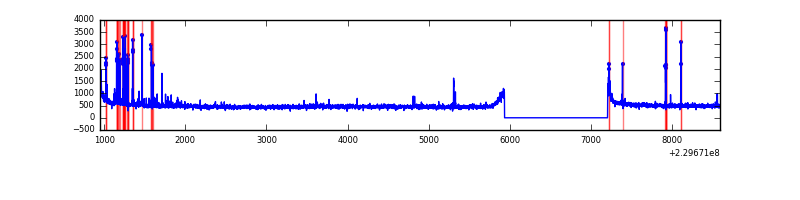 |
Top three noisy pixels from each quadrant. If the there are fewer than three noisy pixels in the level2.evt file, extra rows are filled as -1
| Pixel properties | Quadrant properties | ||||||
|---|---|---|---|---|---|---|---|
| Quadrant | DetID | PixID | Counts | Sigma | Mean | Median | Sigma |
| A | 0 | 254 | 11565 | 64.81 | 829 | 813 | 165.9 |
| A | 15 | 239 | 8632 | 47.13 | 829 | 813 | 165.9 |
| A | 0 | 226 | 7752 | 41.83 | 829 | 813 | 165.9 |
| B | 0 | 214 | 97335 | 612.75 | 838 | 821 | 157.5 |
| B | 4 | 81 | 32878 | 203.52 | 838 | 821 | 157.5 |
| B | 12 | 111 | 16589 | 100.11 | 838 | 821 | 157.5 |
| C | 13 | 61 | 6217 | 28.97 | 809 | 816 | 186.5 |
| C | 9 | 54 | 4594 | 20.26 | 809 | 816 | 186.5 |
| C | 3 | 202 | 2051 | 6.62 | 809 | 816 | 186.5 |
| D | 1 | 52 | 130604 | 645.67 | 799 | 781 | 201.1 |
| D | 12 | 221 | 30890 | 149.75 | 799 | 781 | 201.1 |
| D | 2 | 14 | 27608 | 133.42 | 799 | 781 | 201.1 |
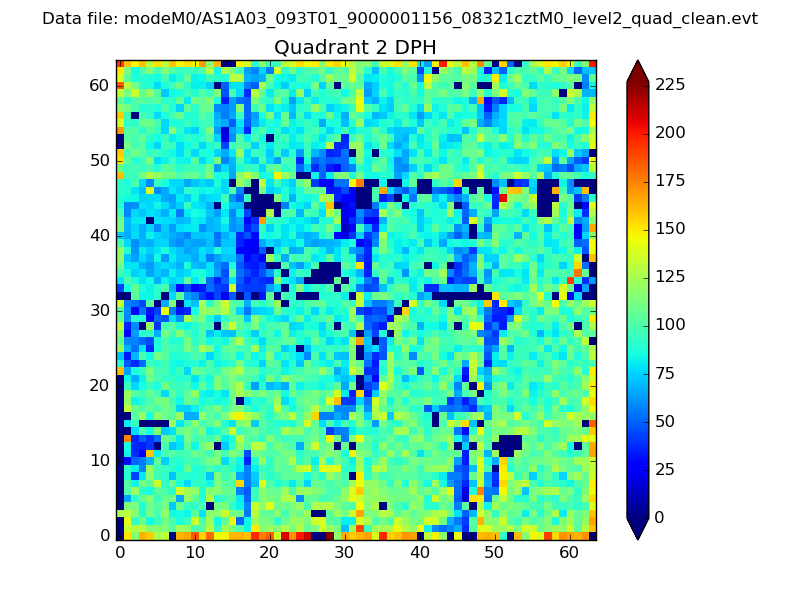
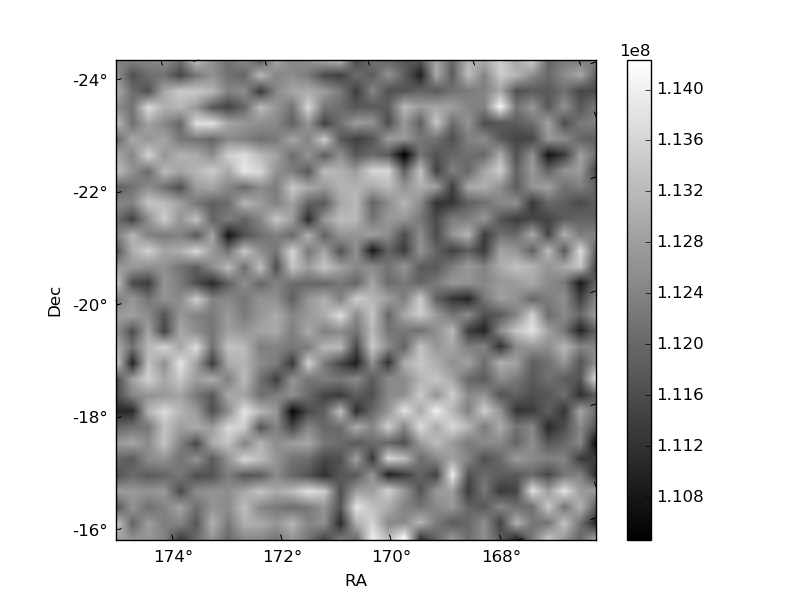
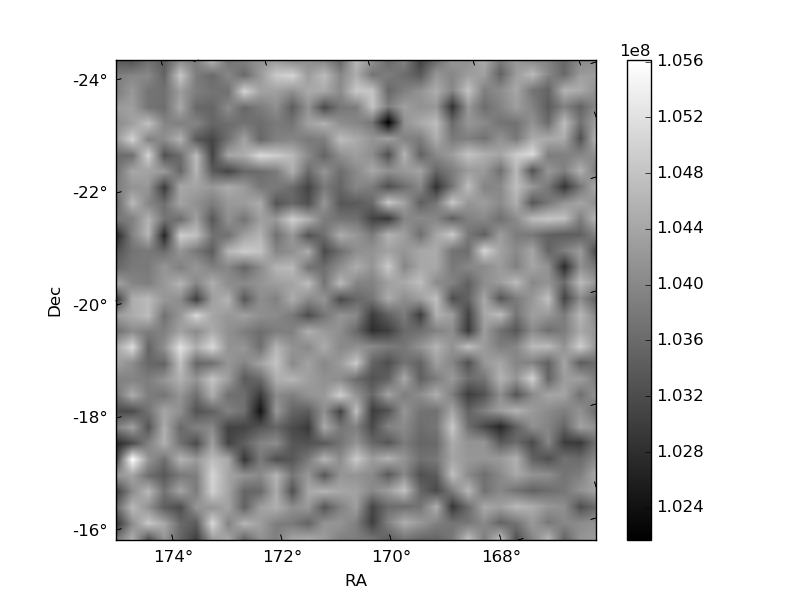
Histogram calculated using DETX and DETY for each event in the final _common_clean file
| Quadrant A | 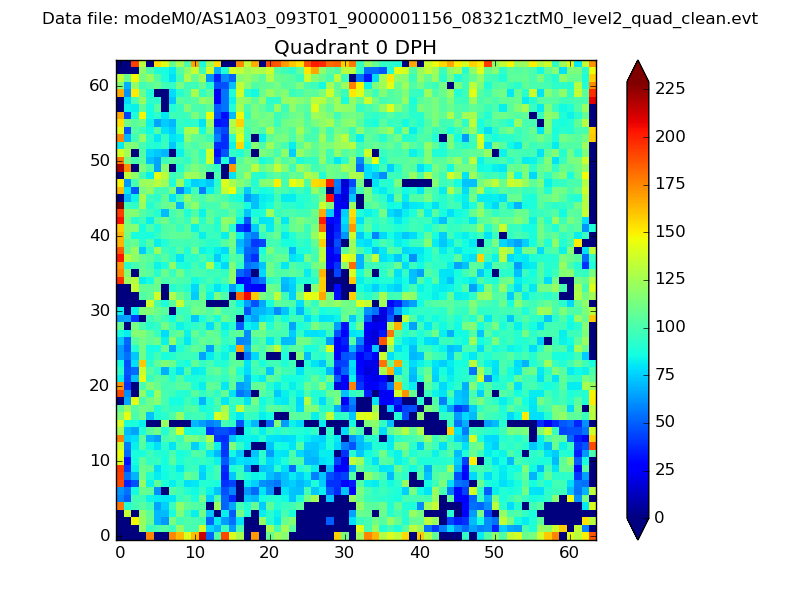 |
 |
Quadrant B |
|---|---|---|---|
| Quadrant D | 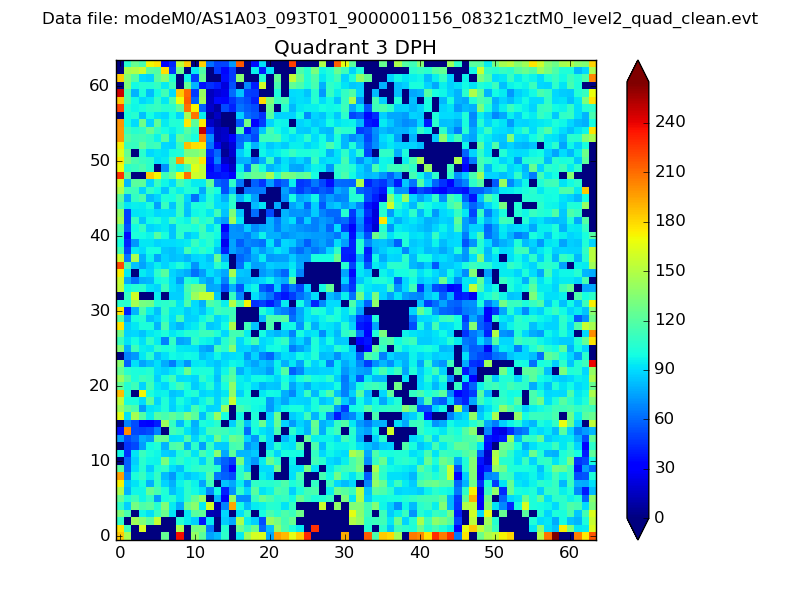 |
 |
Quadrant C |
| Plot type | Count rate plots | Images |
|---|---|---|
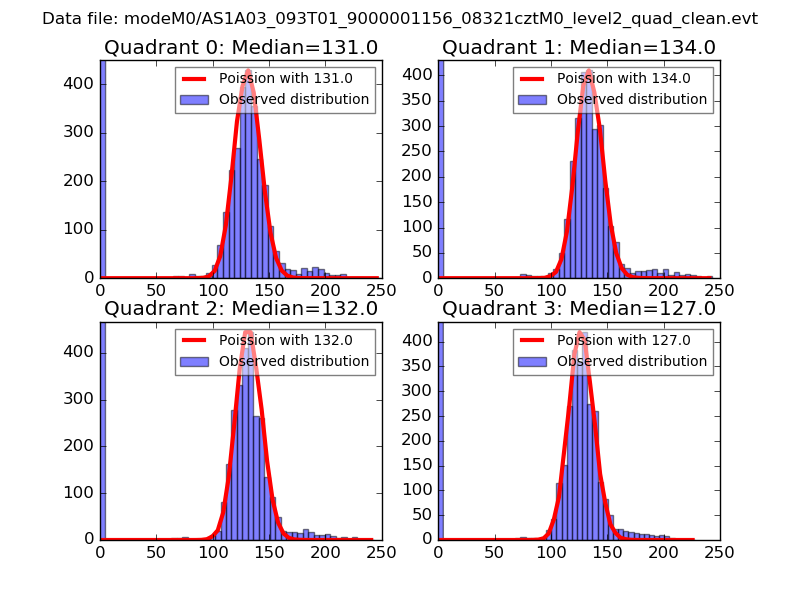
| Comparison with Poisson distribution Blue bars denote a histogram of data divided into 1 sec bins. Red curve is a Poisson curve with rate = median count rate of data. |
 |
 |
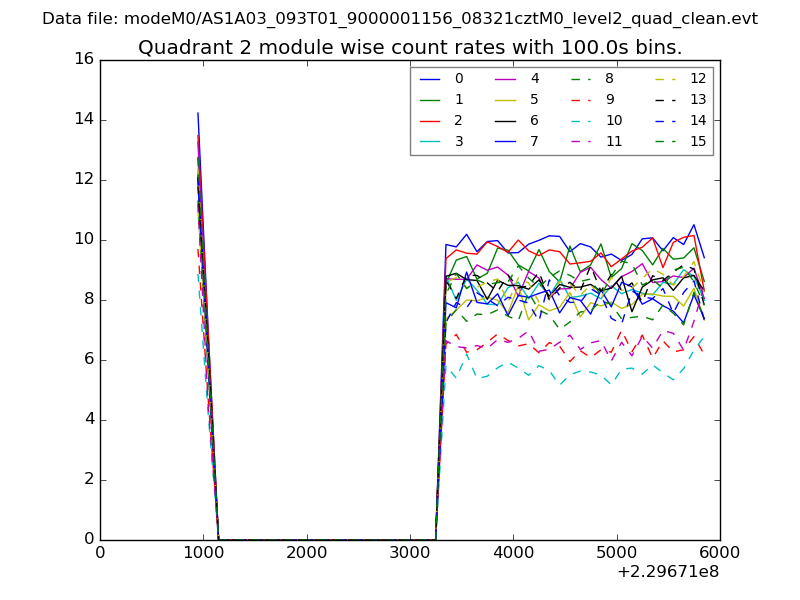
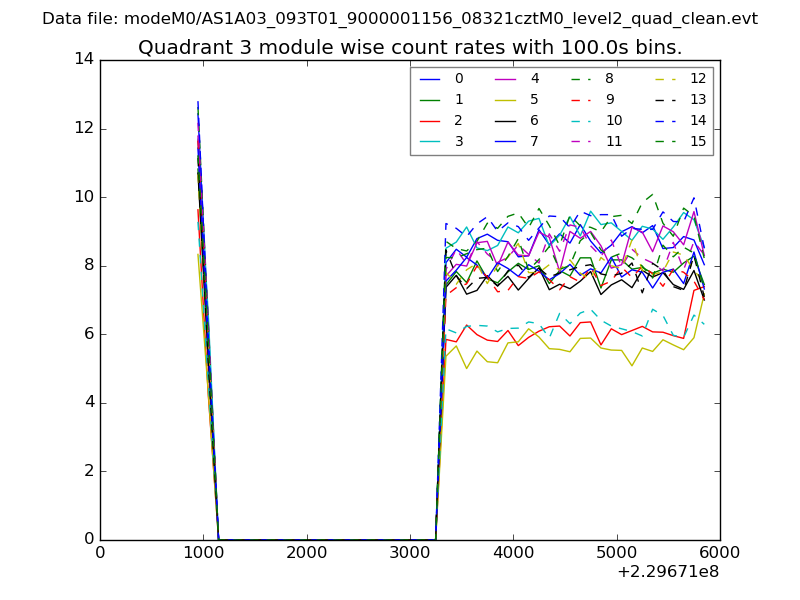
| Quadrant-wise count rates Data is divided into 100 sec bins |
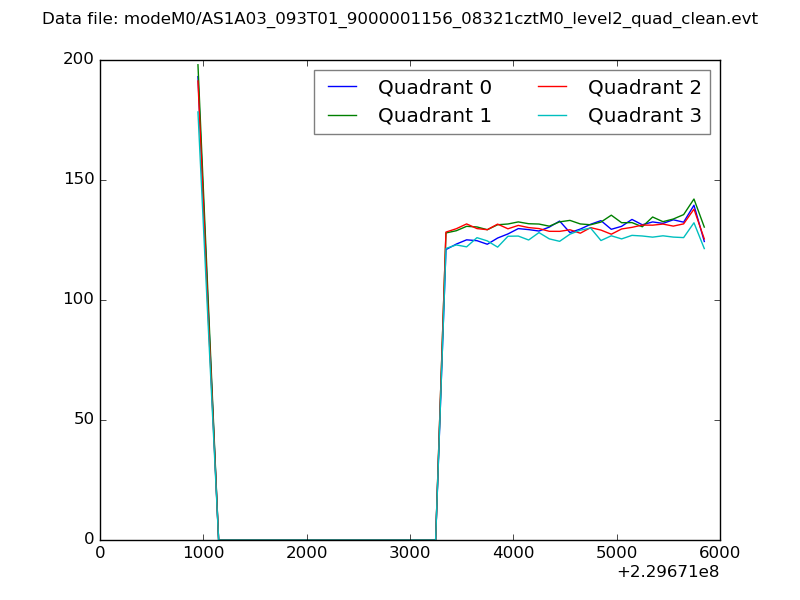 |
|
| Module-wise count rates for Quadrant A Data is divided into 100 sec bins |
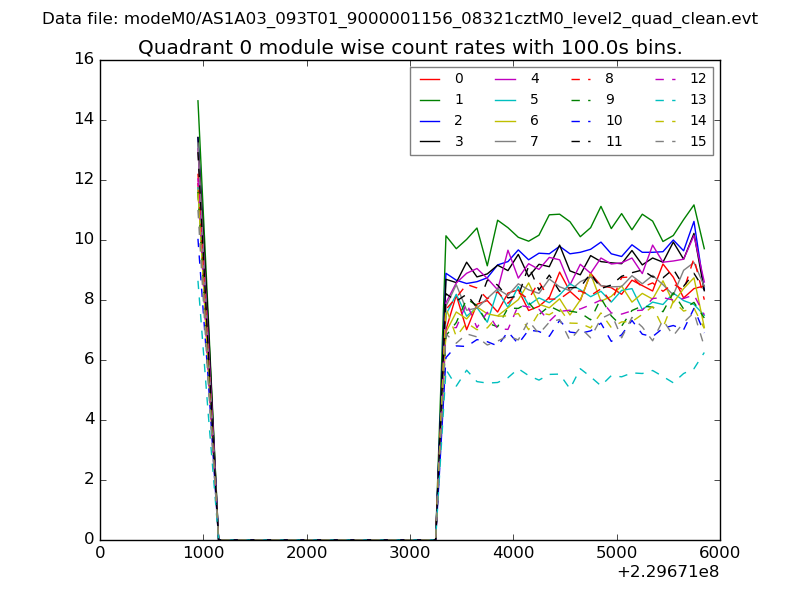 |
 |
| Module-wise count rates for Quadrant B Data is divided into 100 sec bins |
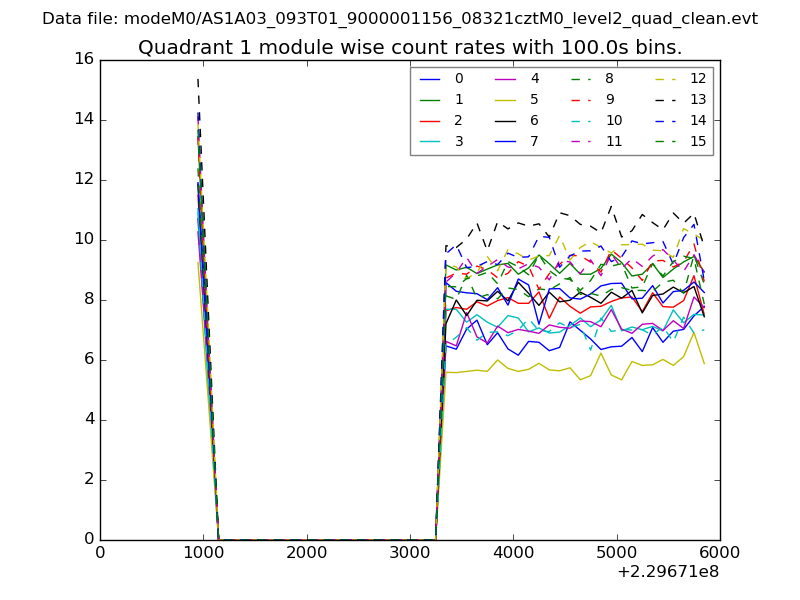 |
 |
| Module-wise count rates for Quadrant C Data is divided into 100 sec bins |
 |
 |
| Module-wise count rates for Quadrant D Data is divided into 100 sec bins |
 |
 |
| Parameter | Plot |
|---|---|
| CZT HV Monitor | 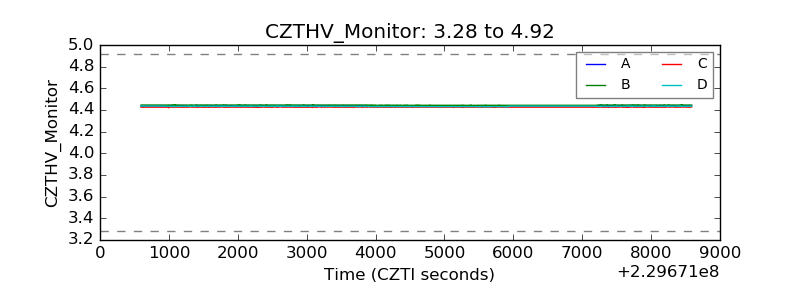 |
| D_VDD | 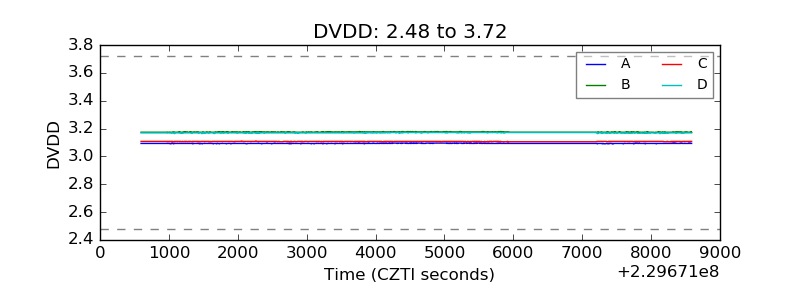 |
| Temperature 1 | 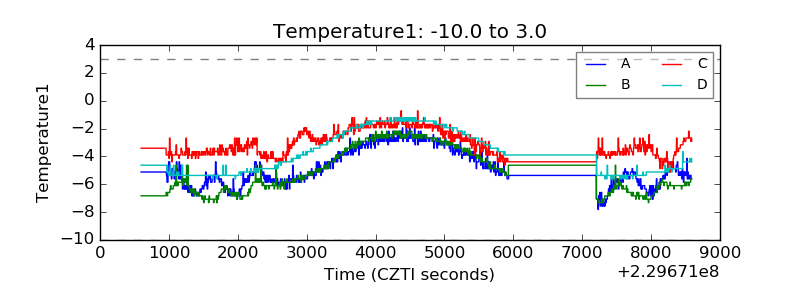 |
| Veto HV Monitor | 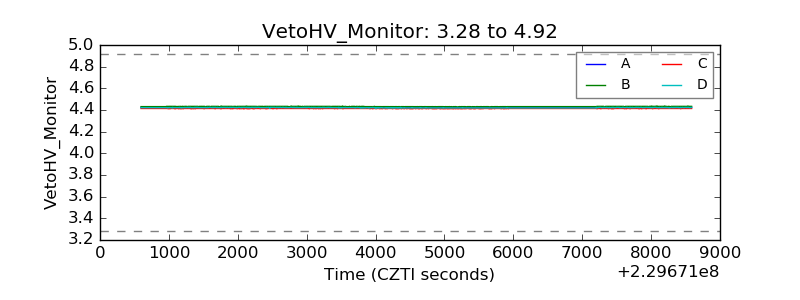 |
| Veto LLD | 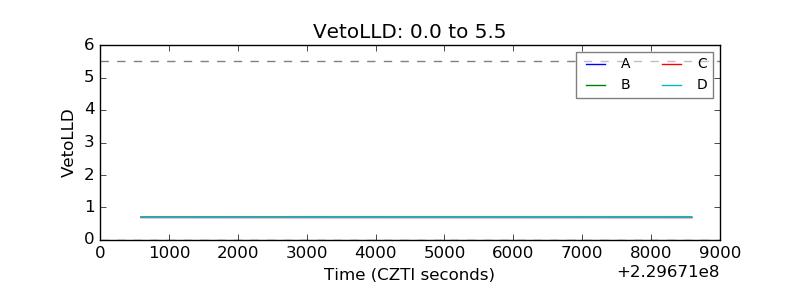 |
| Alpha Counter | 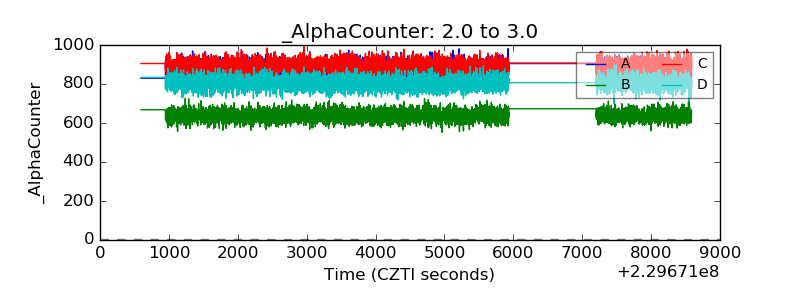 |
| _CPM_Rate | 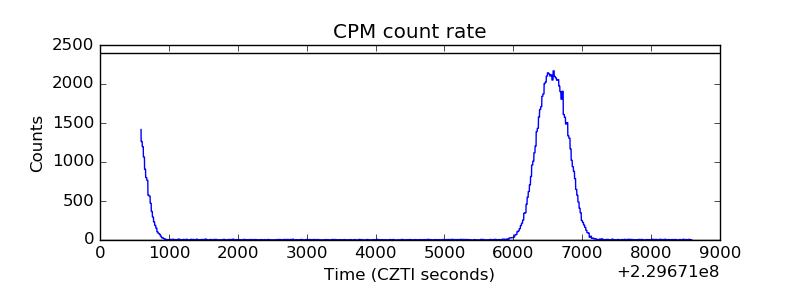 |
| CZT Counter | 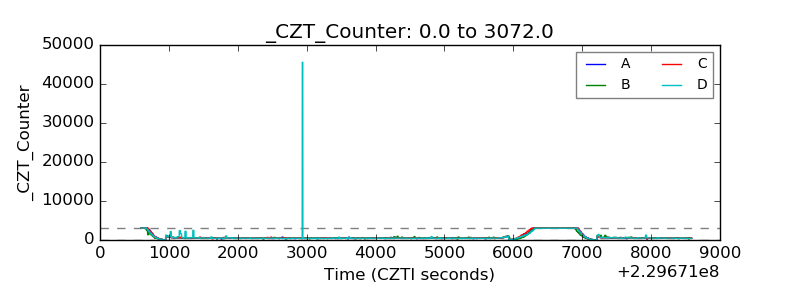 |
| +2.5 Volts monitor |  |
| +5 Volts monitor |  |
| _ROLL_ROT |  |
| _Roll_DEC | 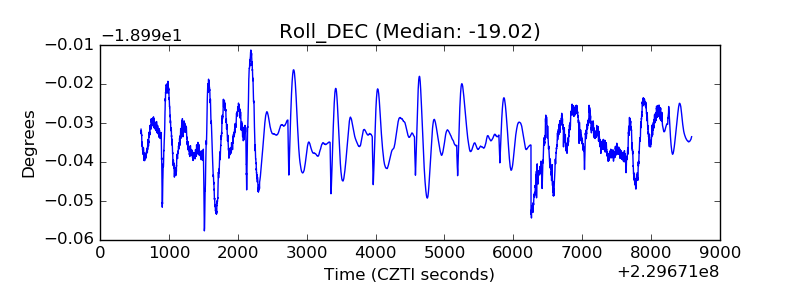 |
| _Roll_RA |  |
| Veto Counter | 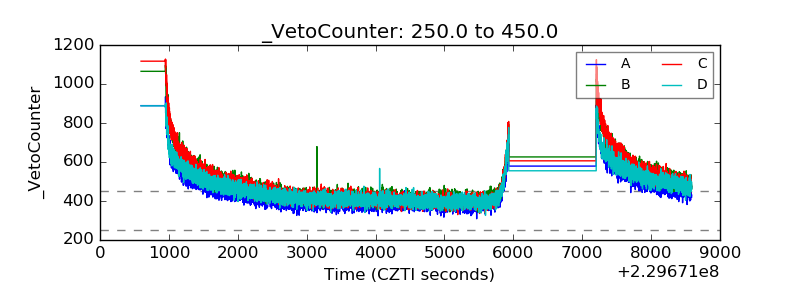 |