| Param | Original file | Final file |
|---|---|---|
| Filename | modeM0/AS1A03_093T01_9000001156_08323cztM0_level2.evt | modeM0/AS1A03_093T01_9000001156_08323cztM0_level2_quad_clean.evt |
| Size (bytes) | 461,695,680 | 77,316,480 |
| Size | 440.3 MB | 73.7 MB |
| Events in quadrant A | 3,399,247 | 476,562 |
| Events in quadrant B | 3,516,387 | 482,511 |
| Events in quadrant C | 3,377,750 | 474,418 |
| Events in quadrant D | 3,254,497 | 461,518 |
| Mode M9 | |||
|---|---|---|---|
| Quadrant | BADHDUFLAG | Total packets | Discarded packets |
| A | 0 | 15 | 0 |
| B | 0 | 15 | 0 |
| C | 0 | 15 | 0 |
| D | 0 | 16 | 0 |
| Mode M0 | |||
|---|---|---|---|
| Quadrant | BADHDUFLAG | Total packets | Discarded packets |
| A | 0 | 13780 | 3 |
| B | 0 | 14172 | 2 |
| C | 0 | 14060 | 6 |
| D | 0 | 13627 | 2 |
| Mode SS | |||
|---|---|---|---|
| Quadrant | BADHDUFLAG | Total packets | Discarded packets |
| A | 0 | 130 | 0 |
| B | 0 | 130 | 0 |
| C | 0 | 130 | 0 |
| D | 0 | 130 | 0 |
| Quadrant | Total seconds | Saturated seconds | Saturation percentage |
|---|---|---|---|
| A | 6394 | 122 | 1.908039% |
| B | 6394 | 189 | 2.955896% |
| C | 6393 | 163 | 2.549664% |
| D | 6394 | 119 | 1.861120% |
Noise dominated data is calculated using 1-second bins in cleaned event files. If a bin has >2000 counts, and if more than 50% of those come from <1% of pixels, then it is considered to be noise-dominated and hence unusable.
| Quadrant | # 1 sec bins | Bins with >0 counts | Bins with >2000 counts | High rate bins dominated by noise | Noise dominated (total time) | Noise dominated (detector-on time) | Marked lightcurve |
|---|---|---|---|---|---|---|---|
| A | 7624 | 6394 | 5 | 5 | 0.07% | 0.08% | 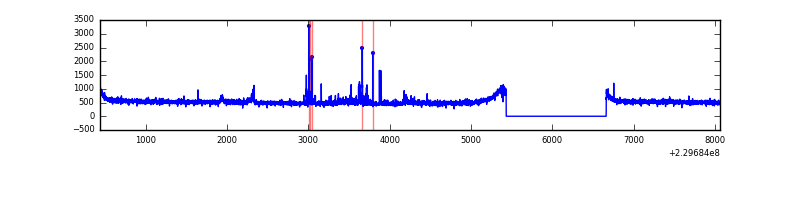 |
| B | 7624 | 6394 | 26 | 26 | 0.34% | 0.41% | 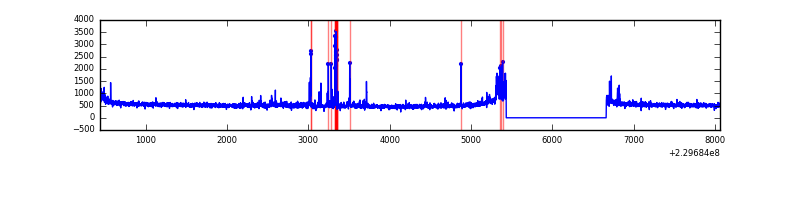 |
| C | 7624 | 6395 | 27 | 27 | 0.35% | 0.42% | 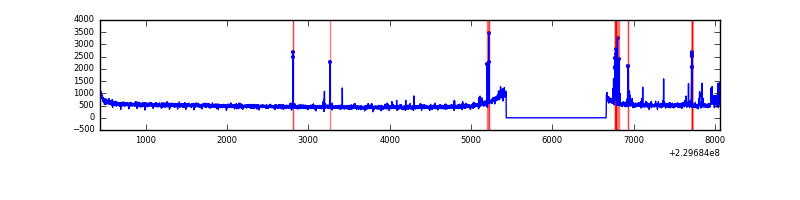 |
| D | 7624 | 6395 | 6 | 6 | 0.08% | 0.09% | 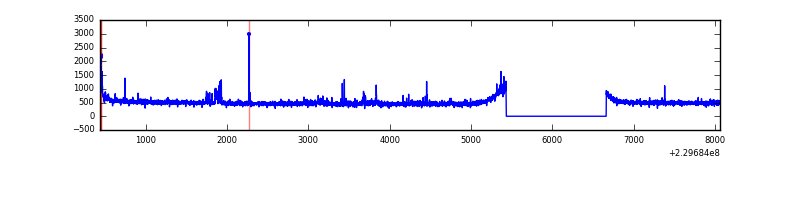 |
Top three noisy pixels from each quadrant. If the there are fewer than three noisy pixels in the level2.evt file, extra rows are filled as -1
| Pixel properties | Quadrant properties | ||||||
|---|---|---|---|---|---|---|---|
| Quadrant | DetID | PixID | Counts | Sigma | Mean | Median | Sigma |
| A | 15 | 239 | 81179 | 473.85 | 843 | 827 | 169.6 |
| A | 15 | 223 | 43427 | 251.22 | 843 | 827 | 169.6 |
| A | 13 | 14 | 23531 | 133.89 | 843 | 827 | 169.6 |
| B | 0 | 214 | 85148 | 530.6 | 841 | 825 | 158.9 |
| B | 0 | 187 | 75032 | 466.94 | 841 | 825 | 158.9 |
| B | 4 | 81 | 71628 | 445.52 | 841 | 825 | 158.9 |
| C | 9 | 54 | 197250 | 1045.63 | 816 | 821 | 187.9 |
| C | 13 | 61 | 6313 | 29.23 | 816 | 821 | 187.9 |
| C | 3 | 202 | 1994 | 6.24 | 816 | 821 | 187.9 |
| D | 2 | 152 | 65605 | 302.82 | 816 | 796 | 214.0 |
| D | 12 | 221 | 56883 | 262.06 | 816 | 796 | 214.0 |
| D | 2 | 234 | 20834 | 93.63 | 816 | 796 | 214.0 |
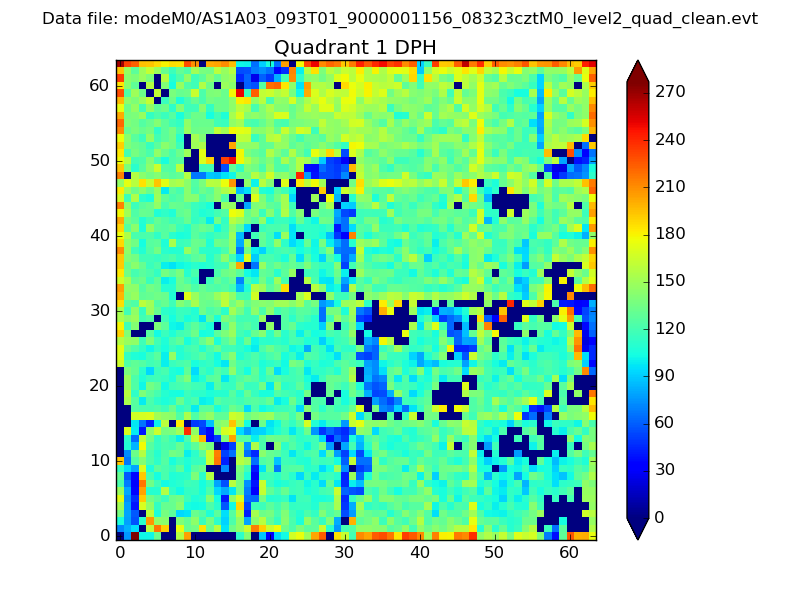
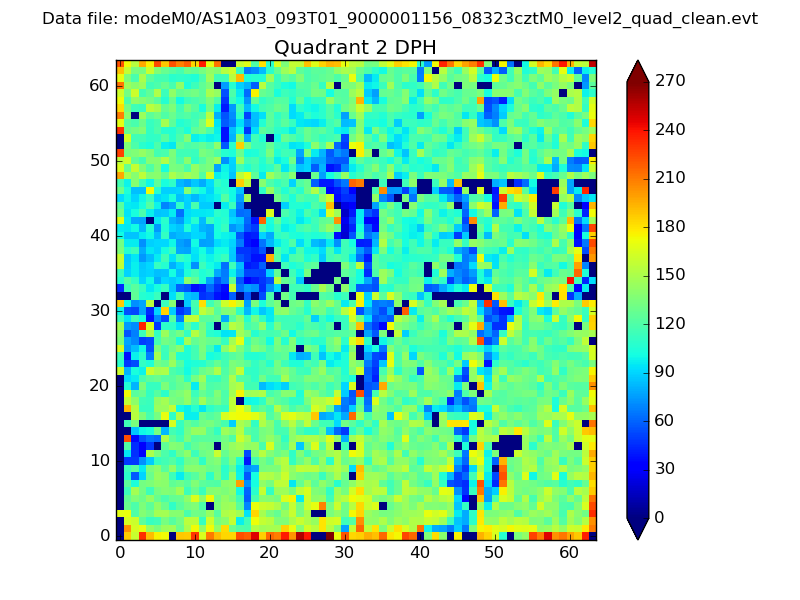
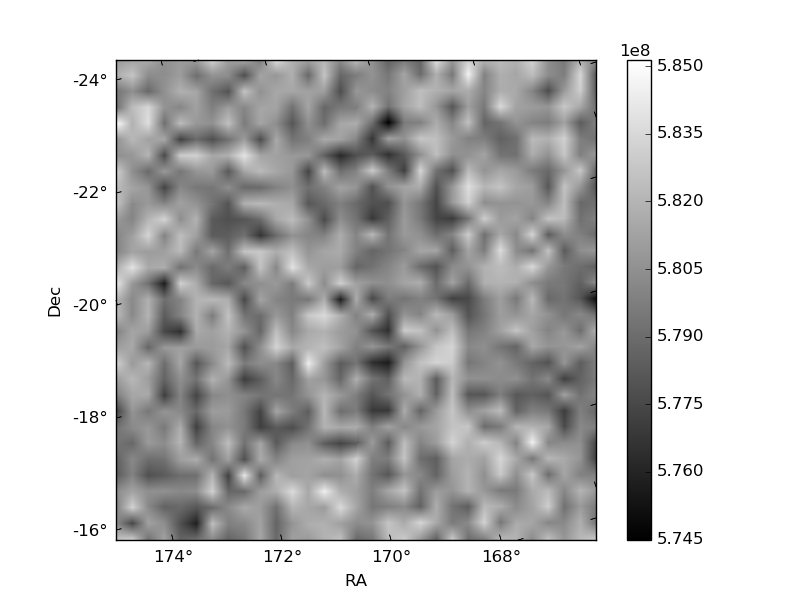
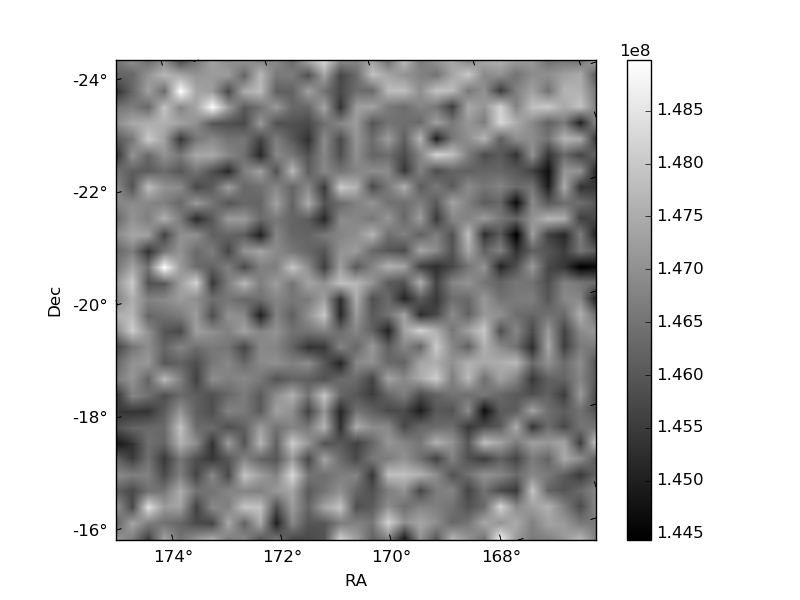
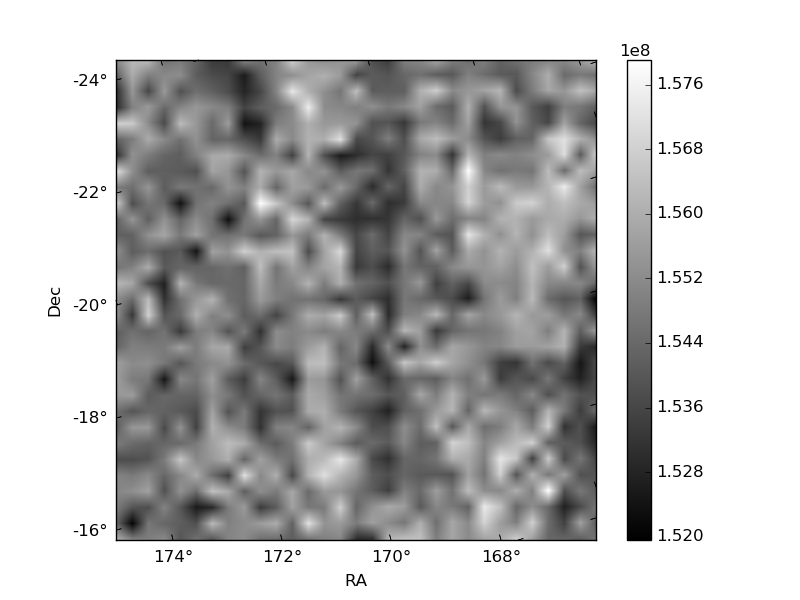
Histogram calculated using DETX and DETY for each event in the final _common_clean file
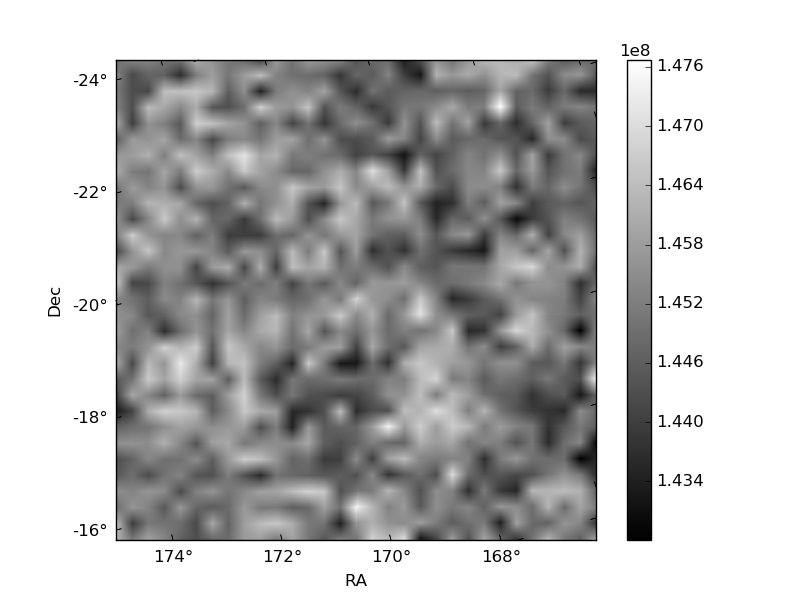
| Quadrant A | 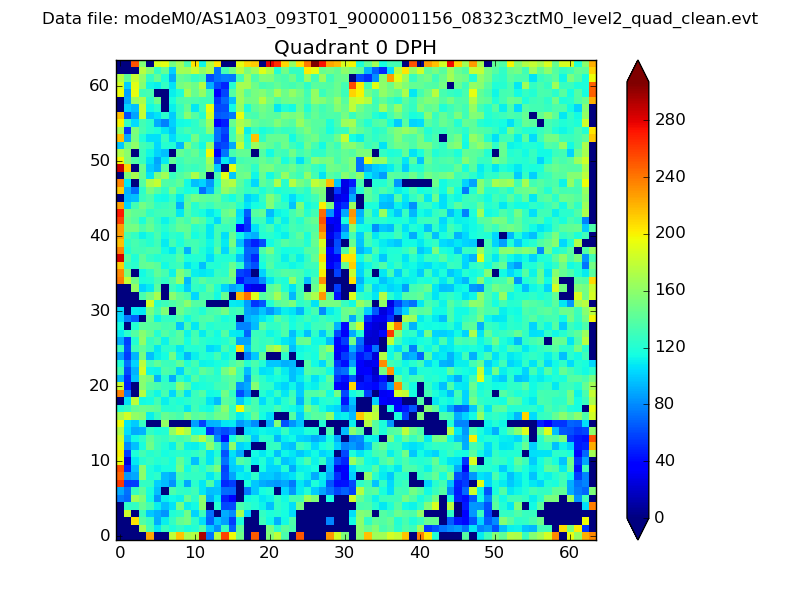 |
 |
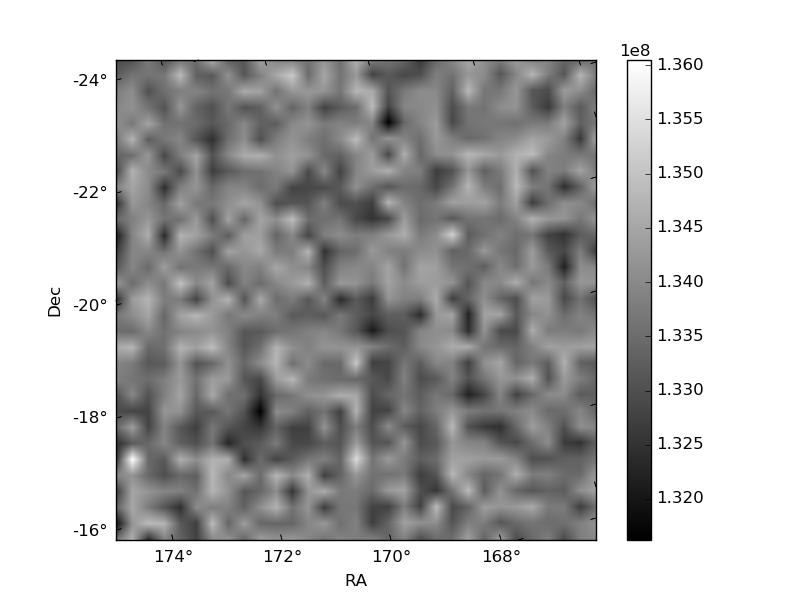
Quadrant B |
|---|---|---|---|
| Quadrant D |  |
 |
Quadrant C |
| Plot type | Count rate plots | Images |
|---|---|---|
| Comparison with Poisson distribution Blue bars denote a histogram of data divided into 1 sec bins. Red curve is a Poisson curve with rate = median count rate of data. |
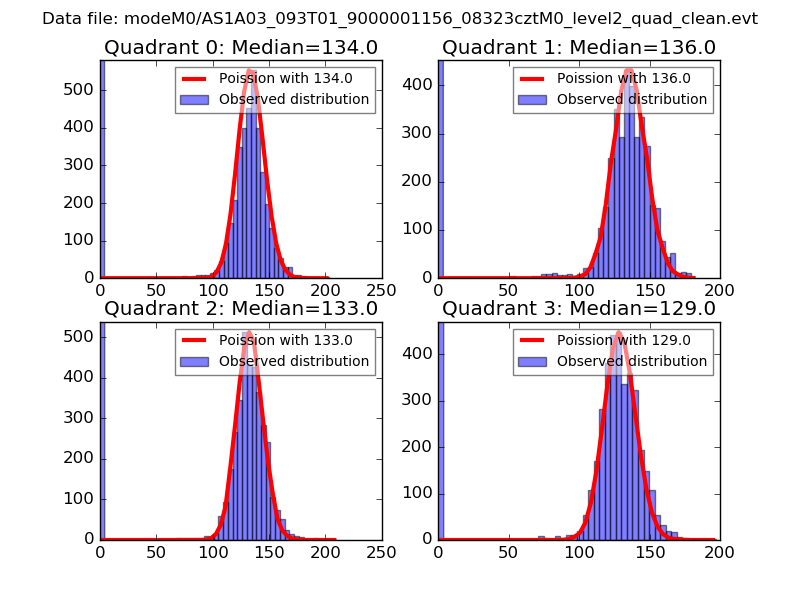 |
 |
| Quadrant-wise count rates Data is divided into 100 sec bins |
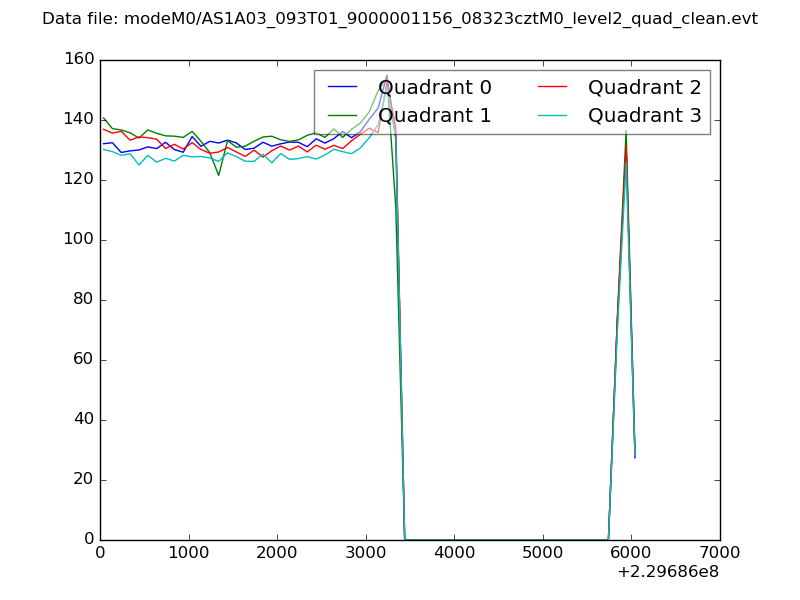 |
|
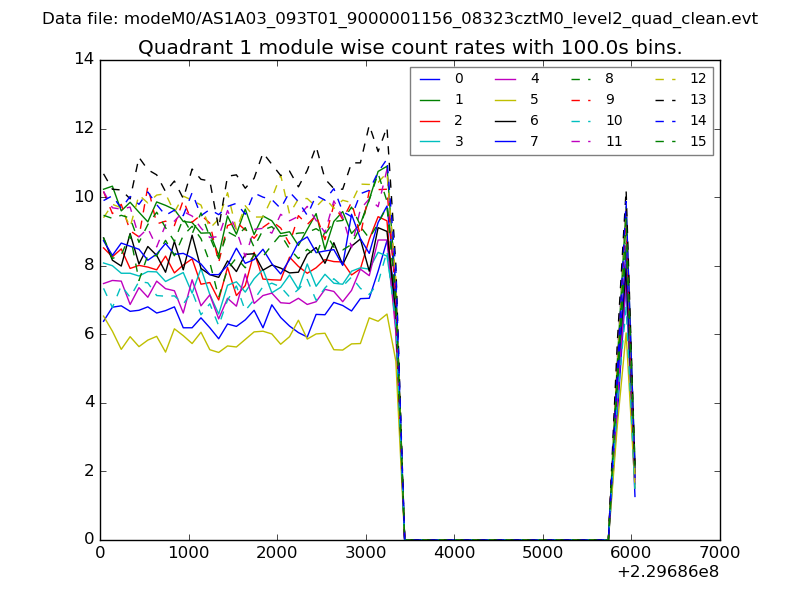
| Module-wise count rates for Quadrant A Data is divided into 100 sec bins |
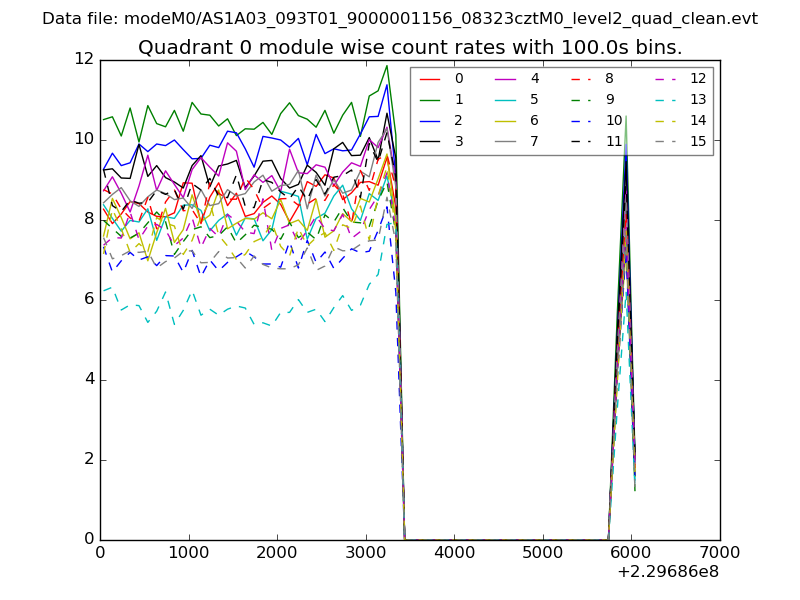 |
 |
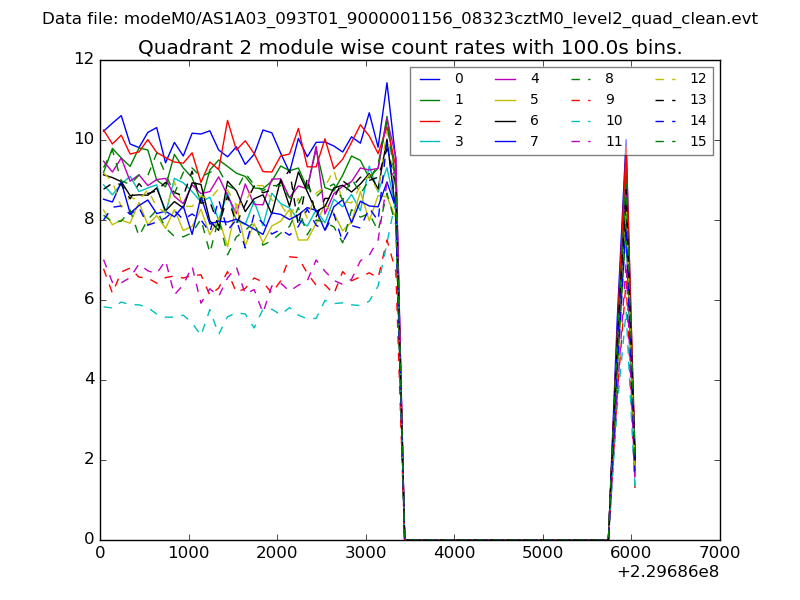
| Module-wise count rates for Quadrant B Data is divided into 100 sec bins |
 |
 |
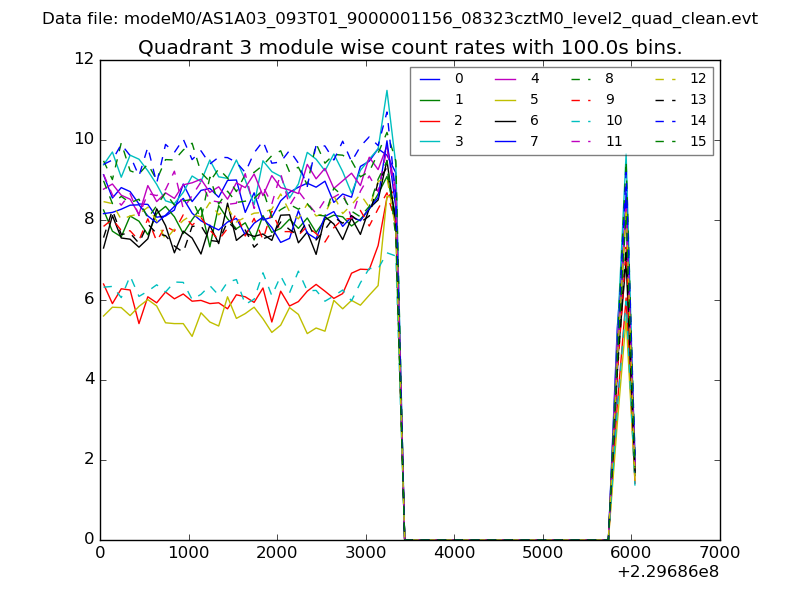
| Module-wise count rates for Quadrant C Data is divided into 100 sec bins |
 |
 |
| Module-wise count rates for Quadrant D Data is divided into 100 sec bins |
 |
 |
| Parameter | Plot |
|---|---|
| CZT HV Monitor | 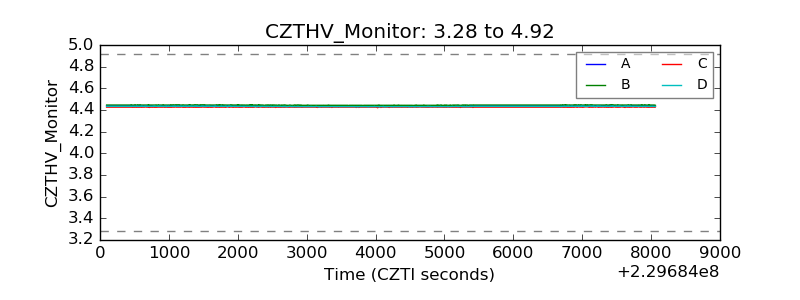 |
| D_VDD | 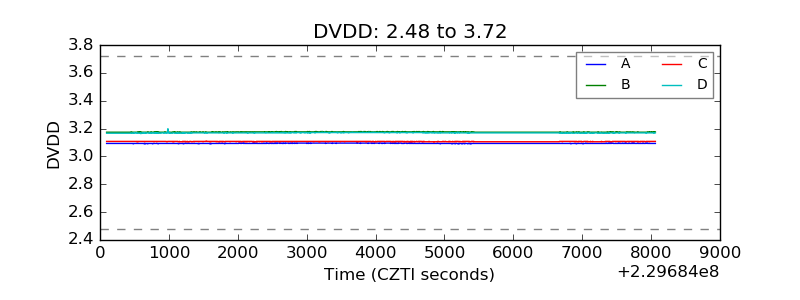 |
| Temperature 1 | 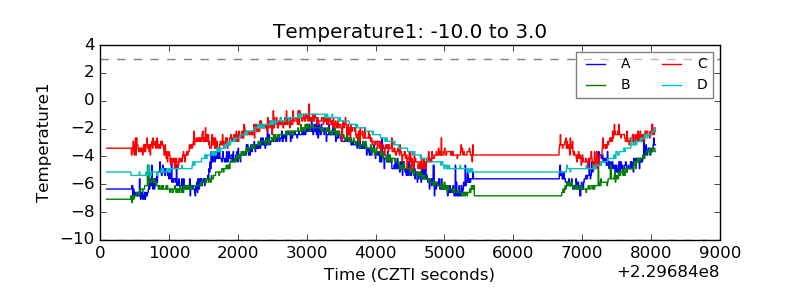 |
| Veto HV Monitor | 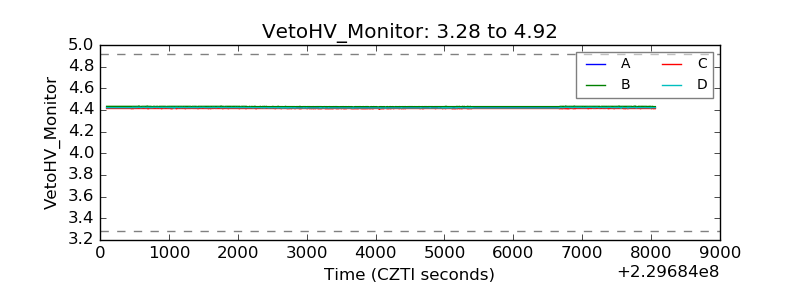 |
| Veto LLD | 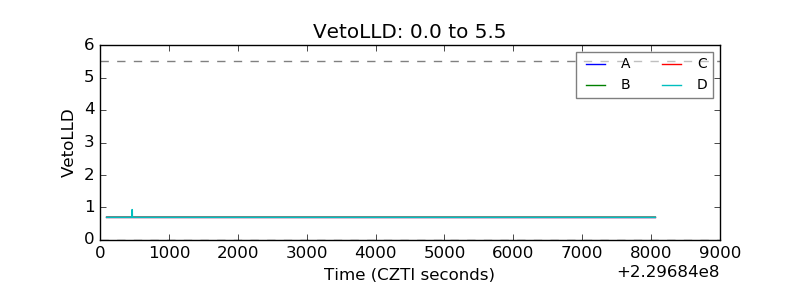 |
| Alpha Counter | 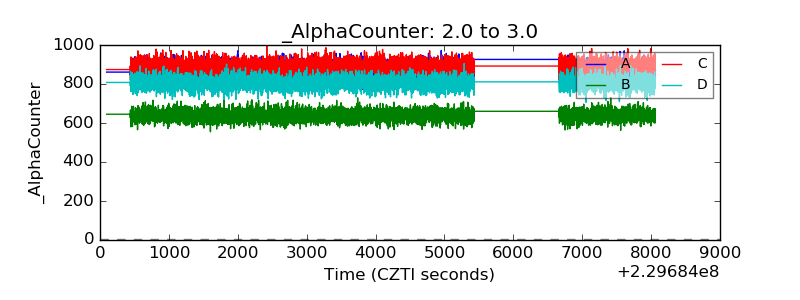 |
| _CPM_Rate | 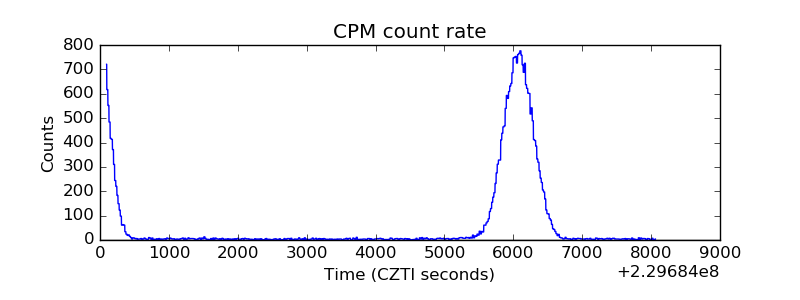 |
| CZT Counter | 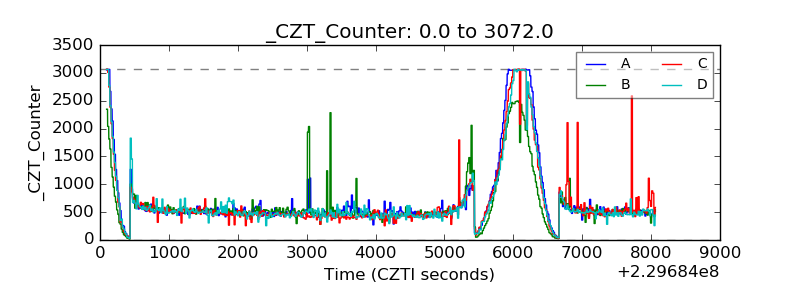 |
| +2.5 Volts monitor |  |
| +5 Volts monitor |  |
| _ROLL_ROT | 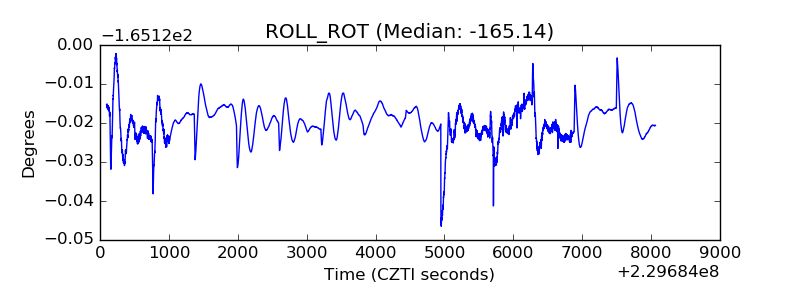 |
| _Roll_DEC | 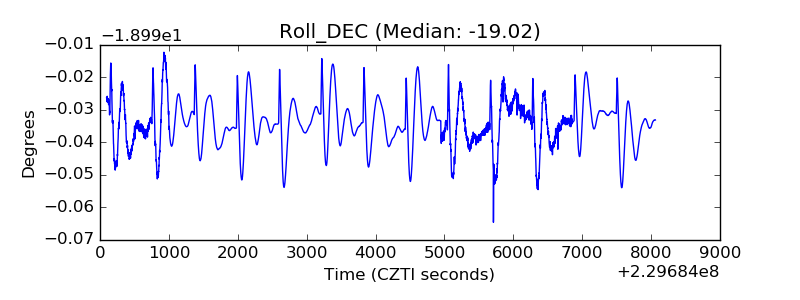 |
| _Roll_RA | 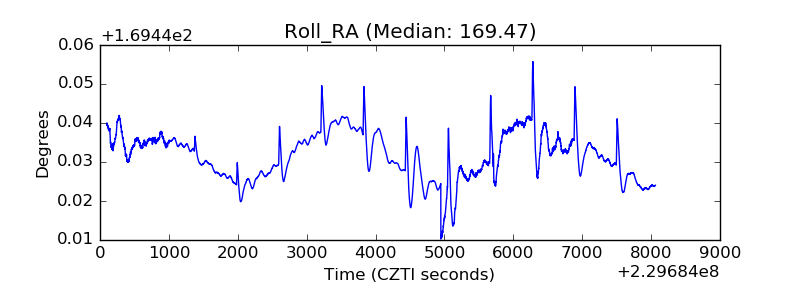 |
| Veto Counter | 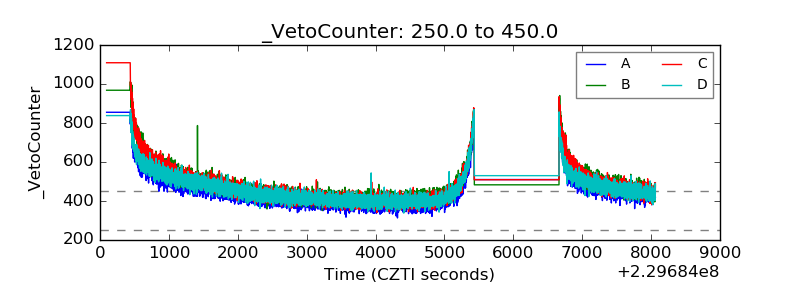 |