| Param | Original file | Final file |
|---|---|---|
| Filename | modeM0/AS1A03_093T01_9000001156_08324cztM0_level2.evt | modeM0/AS1A03_093T01_9000001156_08324cztM0_level2_quad_clean.evt |
| Size (bytes) | 441,901,440 | 84,905,280 |
| Size | 421.4 MB | 81.0 MB |
| Events in quadrant A | 3,200,435 | 536,001 |
| Events in quadrant B | 3,407,151 | 543,928 |
| Events in quadrant C | 3,310,673 | 530,109 |
| Events in quadrant D | 3,033,425 | 518,263 |
| Mode M9 | |||
|---|---|---|---|
| Quadrant | BADHDUFLAG | Total packets | Discarded packets |
| A | 0 | 11 | 0 |
| B | 0 | 11 | 0 |
| C | 0 | 11 | 0 |
| D | 0 | 11 | 0 |
| Mode M0 | |||
|---|---|---|---|
| Quadrant | BADHDUFLAG | Total packets | Discarded packets |
| A | 0 | 13269 | 4 |
| B | 0 | 13904 | 1 |
| C | 0 | 13987 | 1 |
| D | 0 | 13140 | 1 |
| Mode SS | |||
|---|---|---|---|
| Quadrant | BADHDUFLAG | Total packets | Discarded packets |
| A | 0 | 128 | 0 |
| B | 0 | 128 | 0 |
| C | 0 | 128 | 0 |
| D | 0 | 128 | 0 |
| Quadrant | Total seconds | Saturated seconds | Saturation percentage |
|---|---|---|---|
| A | 6348 | 88 | 1.386263% |
| B | 6349 | 138 | 2.173571% |
| C | 6349 | 111 | 1.748307% |
| D | 6349 | 73 | 1.149787% |
Noise dominated data is calculated using 1-second bins in cleaned event files. If a bin has >2000 counts, and if more than 50% of those come from <1% of pixels, then it is considered to be noise-dominated and hence unusable.
| Quadrant | # 1 sec bins | Bins with >0 counts | Bins with >2000 counts | High rate bins dominated by noise | Noise dominated (total time) | Noise dominated (detector-on time) | Marked lightcurve |
|---|---|---|---|---|---|---|---|
| A | 7429 | 6349 | 0 | 0 | 0.00% | 0.00% | 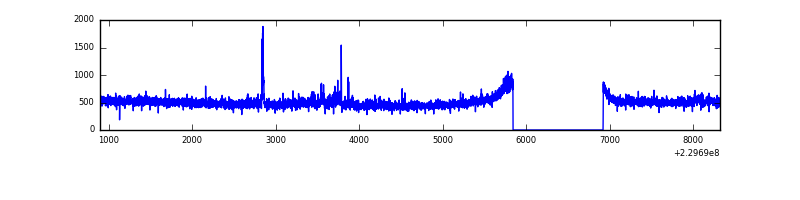 |
| B | 7429 | 6350 | 26 | 26 | 0.35% | 0.41% | 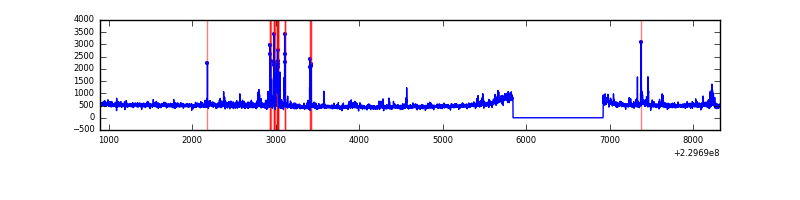 |
| C | 7429 | 6350 | 41 | 41 | 0.55% | 0.65% | 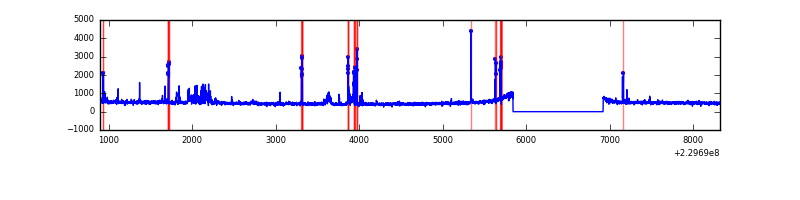 |
| D | 7429 | 6349 | 3 | 3 | 0.04% | 0.05% | 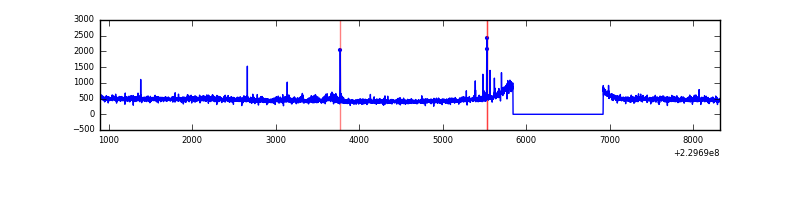 |
Top three noisy pixels from each quadrant. If the there are fewer than three noisy pixels in the level2.evt file, extra rows are filled as -1
| Pixel properties | Quadrant properties | ||||||
|---|---|---|---|---|---|---|---|
| Quadrant | DetID | PixID | Counts | Sigma | Mean | Median | Sigma |
| A | 15 | 239 | 35049 | 210.97 | 800 | 784 | 162.4 |
| A | 13 | 251 | 31099 | 186.65 | 800 | 784 | 162.4 |
| A | 13 | 14 | 21567 | 127.96 | 800 | 784 | 162.4 |
| B | 0 | 187 | 131632 | 861.31 | 798 | 780 | 151.9 |
| B | 0 | 214 | 85553 | 558.01 | 798 | 780 | 151.9 |
| B | 4 | 81 | 57935 | 376.21 | 798 | 780 | 151.9 |
| C | 9 | 54 | 320142 | 1792.63 | 767 | 770 | 178.2 |
| C | 13 | 61 | 5903 | 28.81 | 767 | 770 | 178.2 |
| C | 3 | 202 | 1870 | 6.17 | 767 | 770 | 178.2 |
| D | 2 | 152 | 65204 | 329.35 | 772 | 752 | 195.7 |
| D | 2 | 14 | 22989 | 113.63 | 772 | 752 | 195.7 |
| D | 2 | 234 | 22768 | 112.5 | 772 | 752 | 195.7 |
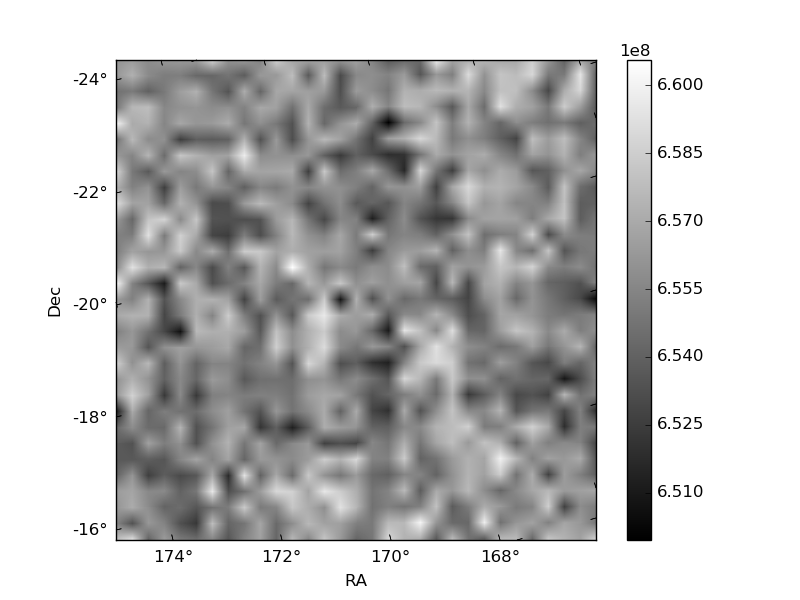
Histogram calculated using DETX and DETY for each event in the final _common_clean file
| Quadrant A |  |
 |
Quadrant B |
|---|---|---|---|
| Quadrant D |  |
 |
Quadrant C |
| Plot type | Count rate plots | Images |
|---|---|---|
| Comparison with Poisson distribution Blue bars denote a histogram of data divided into 1 sec bins. Red curve is a Poisson curve with rate = median count rate of data. |
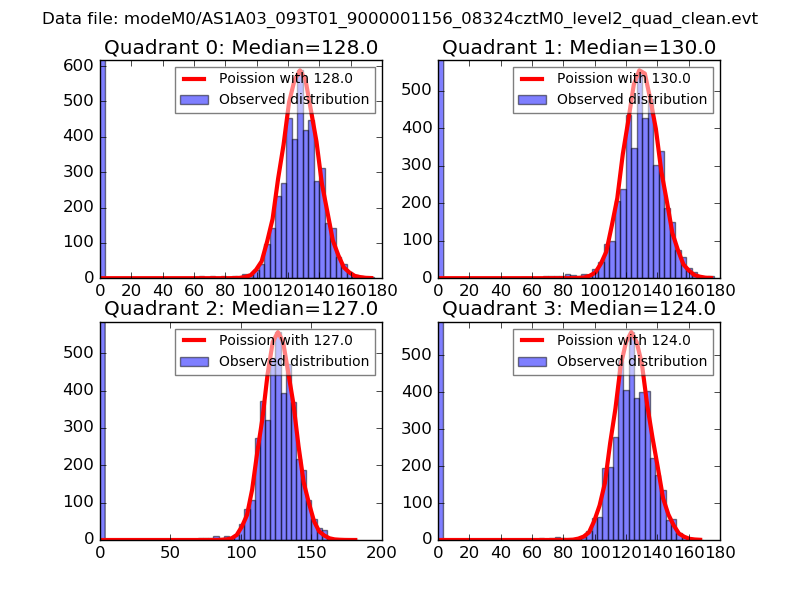 |
 |
| Quadrant-wise count rates Data is divided into 100 sec bins |
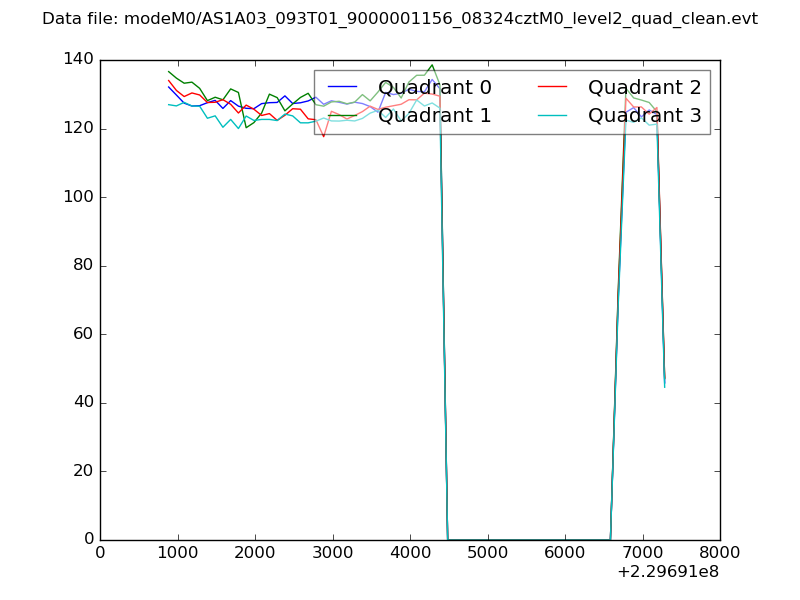 |
|
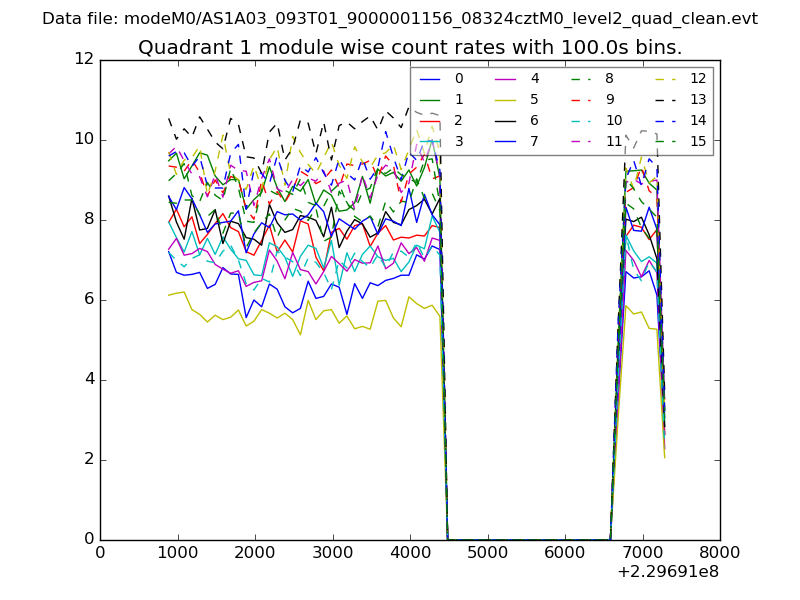
| Module-wise count rates for Quadrant A Data is divided into 100 sec bins |
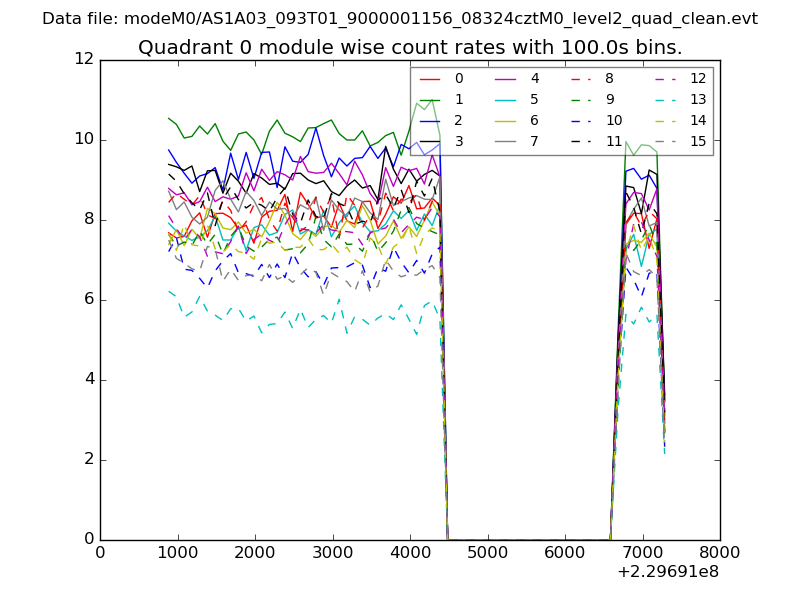 |
 |
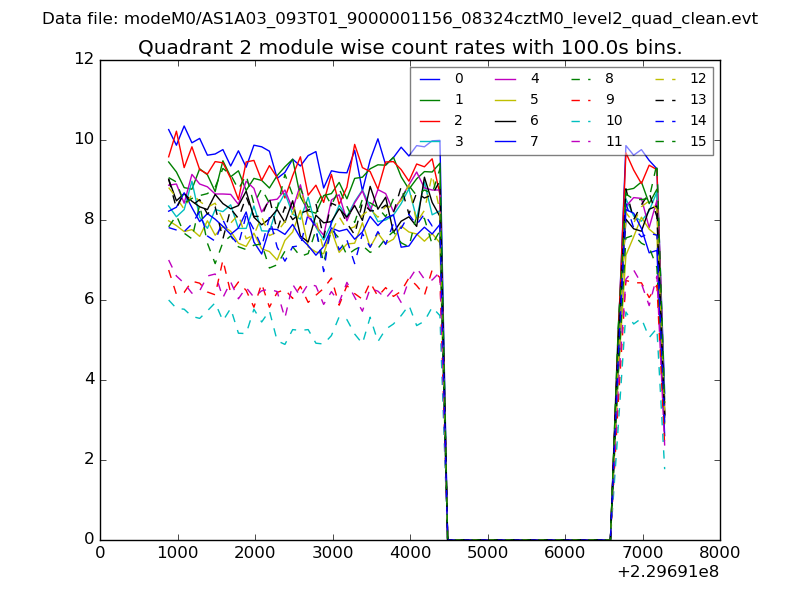
| Module-wise count rates for Quadrant B Data is divided into 100 sec bins |
 |
 |
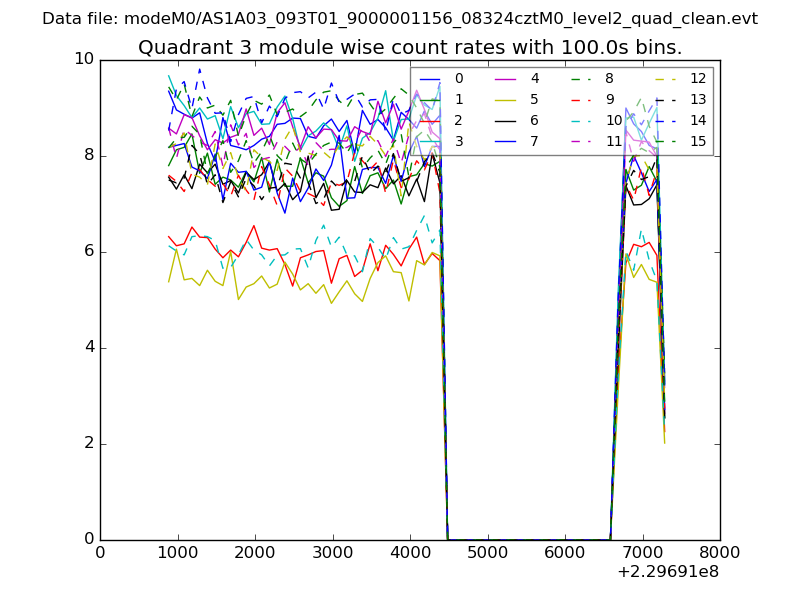
| Module-wise count rates for Quadrant C Data is divided into 100 sec bins |
 |
 |
| Module-wise count rates for Quadrant D Data is divided into 100 sec bins |
 |
 |
| Parameter | Plot |
|---|---|
| CZT HV Monitor | 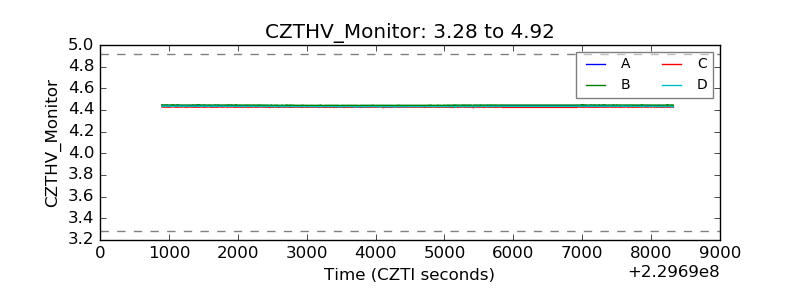 |
| D_VDD | 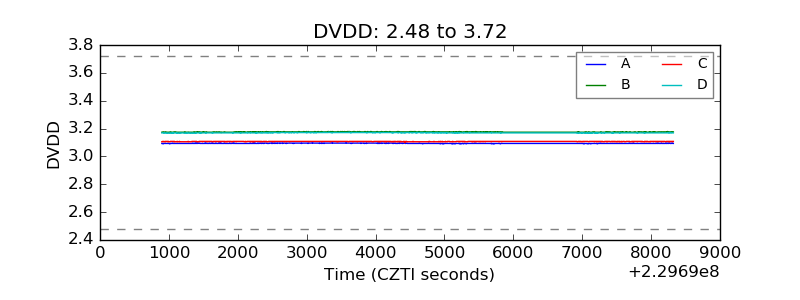 |
| Temperature 1 | 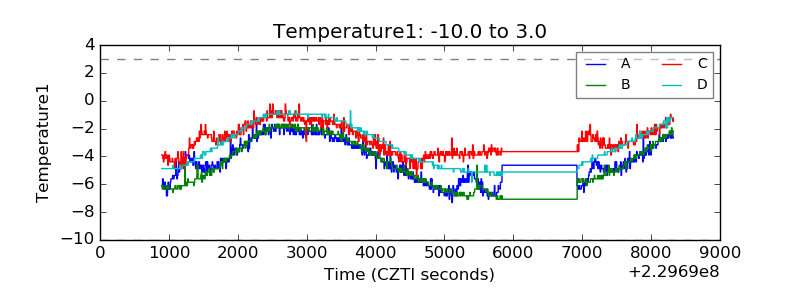 |
| Veto HV Monitor | 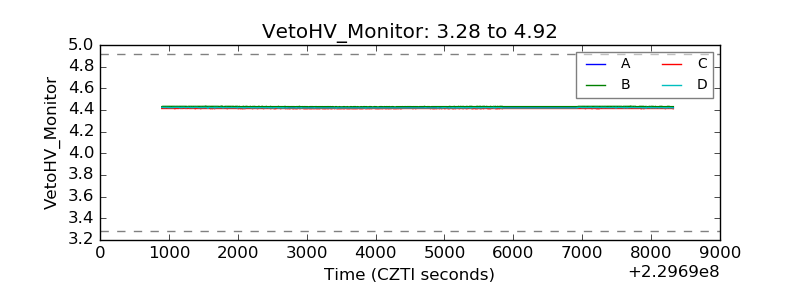 |
| Veto LLD | 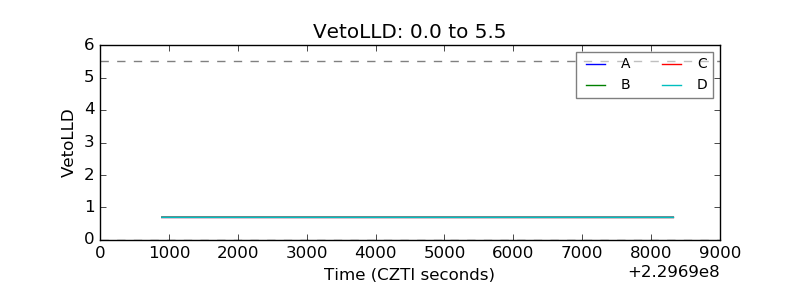 |
| Alpha Counter | 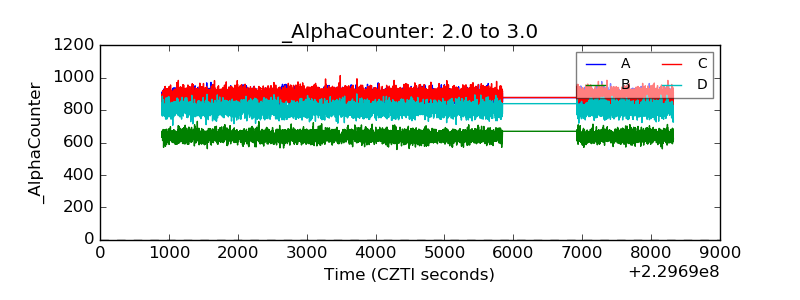 |
| _CPM_Rate | 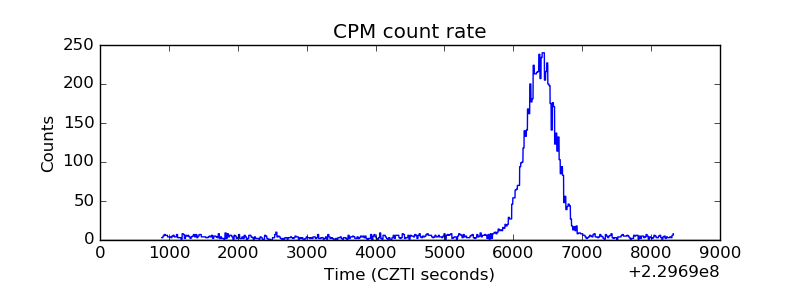 |
| CZT Counter |  |
| +2.5 Volts monitor |  |
| +5 Volts monitor |  |
| _ROLL_ROT | 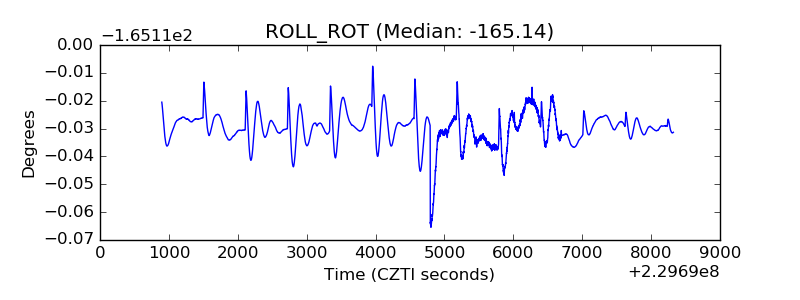 |
| _Roll_DEC | 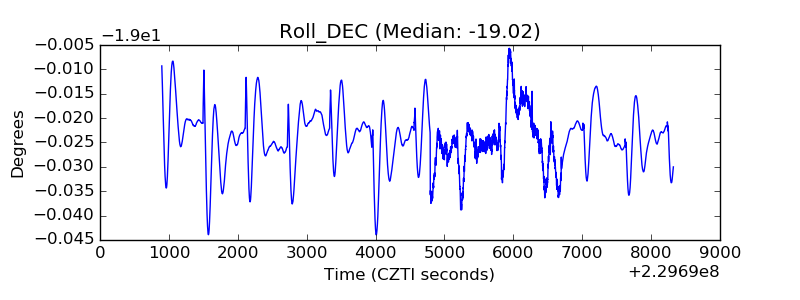 |
| _Roll_RA | 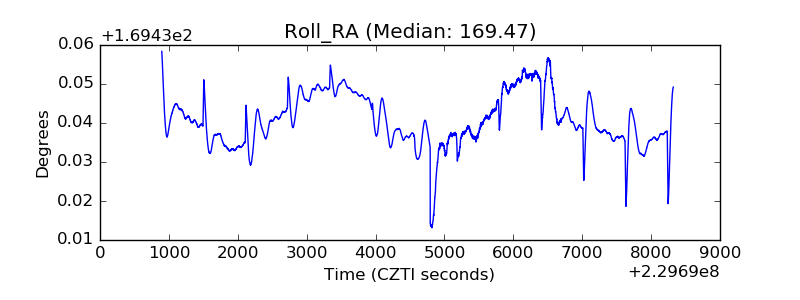 |
| Veto Counter | 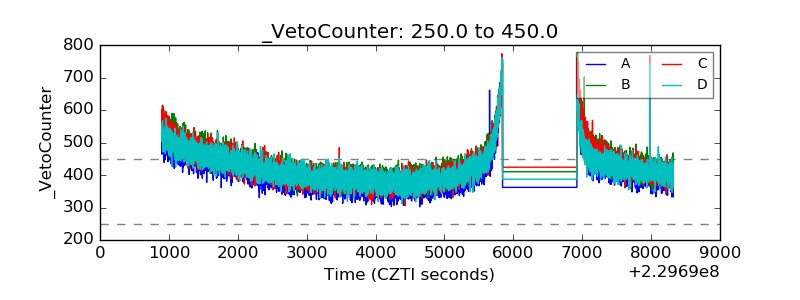 |