| Param | Original file | Final file |
|---|---|---|
| Filename | modeM0/AS1A03_093T01_9000001156_08326cztM0_level2.evt | modeM0/AS1A03_093T01_9000001156_08326cztM0_level2_quad_clean.evt |
| Size (bytes) | 106,341,120 | 29,980,800 |
| Size | 101.4 MB | 28.6 MB |
| Events in quadrant A | 798,595 | 196,882 |
| Events in quadrant B | 835,302 | 200,444 |
| Events in quadrant C | 721,542 | 198,032 |
| Events in quadrant D | 749,888 | 190,659 |
| Mode M0 | |||
|---|---|---|---|
| Quadrant | BADHDUFLAG | Total packets | Discarded packets |
| A | 0 | 3408 | 0 |
| B | 0 | 3489 | 0 |
| C | 0 | 3306 | 0 |
| D | 0 | 3362 | 0 |
| Mode SS | |||
|---|---|---|---|
| Quadrant | BADHDUFLAG | Total packets | Discarded packets |
| A | 0 | 34 | 0 |
| B | 0 | 34 | 0 |
| C | 0 | 34 | 0 |
| D | 0 | 34 | 0 |
| Quadrant | Total seconds | Saturated seconds | Saturation percentage |
|---|---|---|---|
| A | 1648 | 1 | 0.060680% |
| B | 1648 | 6 | 0.364078% |
| C | 1648 | 2 | 0.121359% |
| D | 1648 | 2 | 0.121359% |
Noise dominated data is calculated using 1-second bins in cleaned event files. If a bin has >2000 counts, and if more than 50% of those come from <1% of pixels, then it is considered to be noise-dominated and hence unusable.
| Quadrant | # 1 sec bins | Bins with >0 counts | Bins with >2000 counts | High rate bins dominated by noise | Noise dominated (total time) | Noise dominated (detector-on time) | Marked lightcurve |
|---|---|---|---|---|---|---|---|
| A | 1648 | 1648 | 0 | 0 | 0.00% | 0.00% | 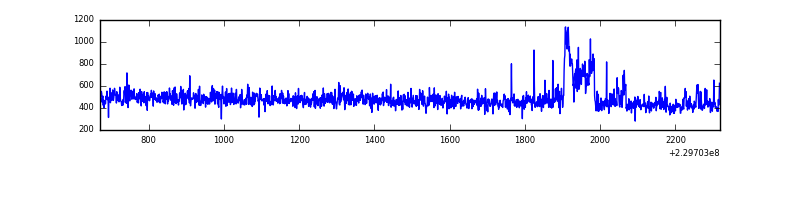 |
| B | 1648 | 1648 | 3 | 3 | 0.18% | 0.18% | 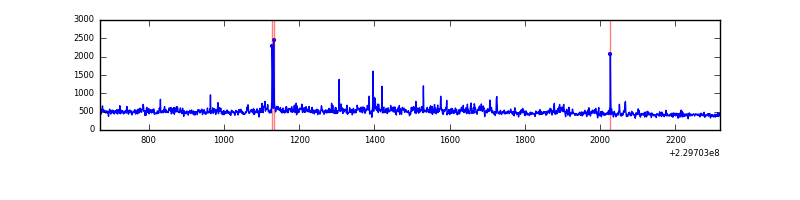 |
| C | 1648 | 1648 | 0 | 0 | 0.00% | 0.00% | 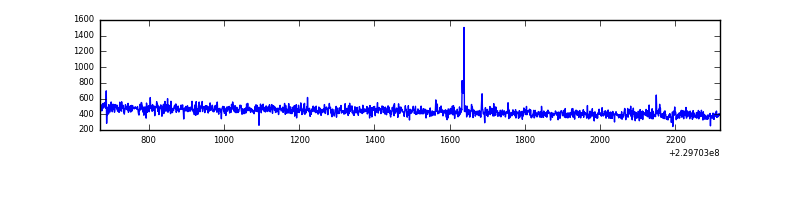 |
| D | 1648 | 1648 | 0 | 0 | 0.00% | 0.00% | 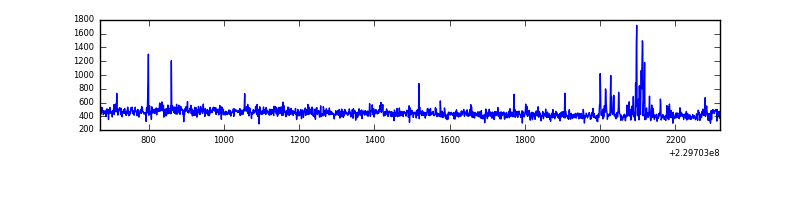 |
Top three noisy pixels from each quadrant. If the there are fewer than three noisy pixels in the level2.evt file, extra rows are filled as -1
| Pixel properties | Quadrant properties | ||||||
|---|---|---|---|---|---|---|---|
| Quadrant | DetID | PixID | Counts | Sigma | Mean | Median | Sigma |
| A | 15 | 234 | 27885 | 661.0 | 195 | 191 | 41.9 |
| A | 13 | 251 | 12229 | 287.32 | 195 | 191 | 41.9 |
| A | 15 | 239 | 7105 | 165.02 | 195 | 191 | 41.9 |
| B | 0 | 214 | 69314 | 1767.9 | 192 | 188 | 39.1 |
| B | 0 | 219 | 9788 | 245.52 | 192 | 188 | 39.1 |
| B | 4 | 173 | 5812 | 143.83 | 192 | 188 | 39.1 |
| C | 9 | 54 | 4495 | 97.3 | 183 | 184 | 44.3 |
| C | 13 | 61 | 1446 | 28.48 | 183 | 184 | 44.3 |
| C | 3 | 202 | 447 | 5.94 | 183 | 184 | 44.3 |
| D | 2 | 152 | 29840 | 621.55 | 188 | 183 | 47.7 |
| D | 2 | 234 | 5749 | 116.65 | 188 | 183 | 47.7 |
| D | 2 | 14 | 2706 | 52.88 | 188 | 183 | 47.7 |
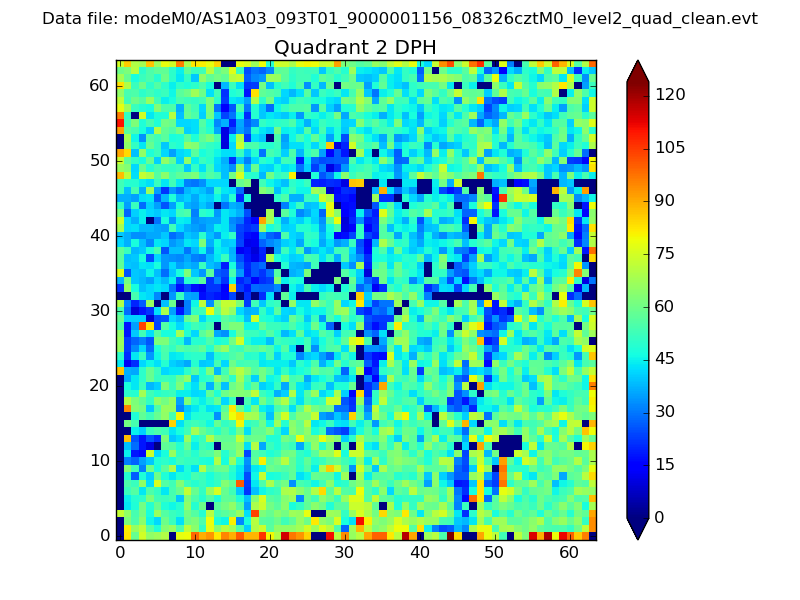
Histogram calculated using DETX and DETY for each event in the final _common_clean file
| Quadrant A | 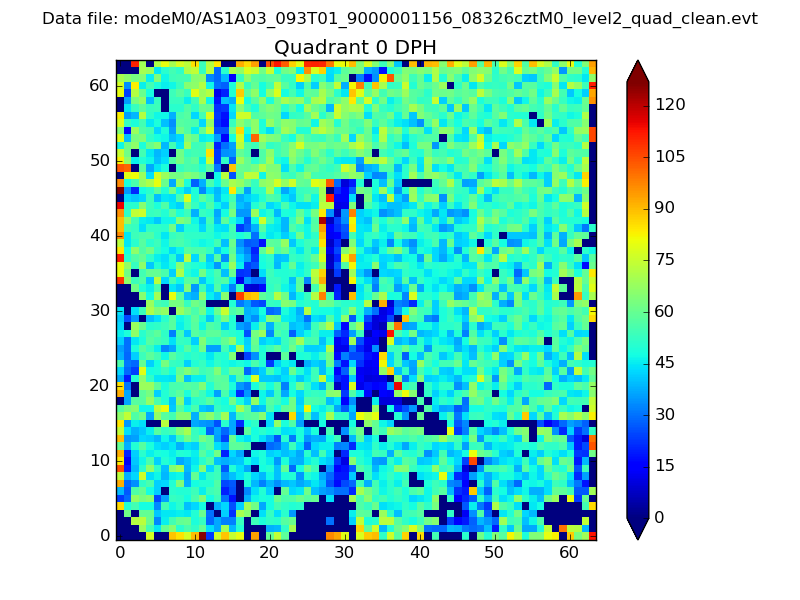 |
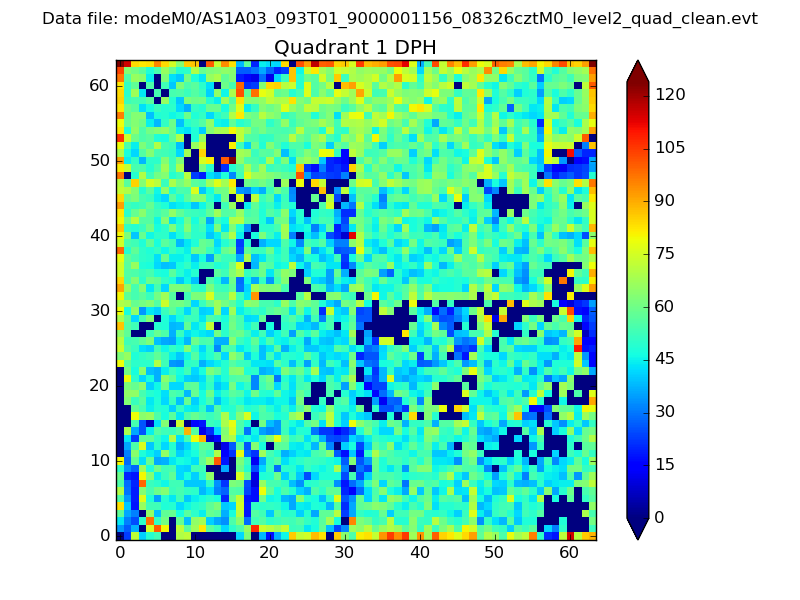 |
Quadrant B |
|---|---|---|---|
| Quadrant D | 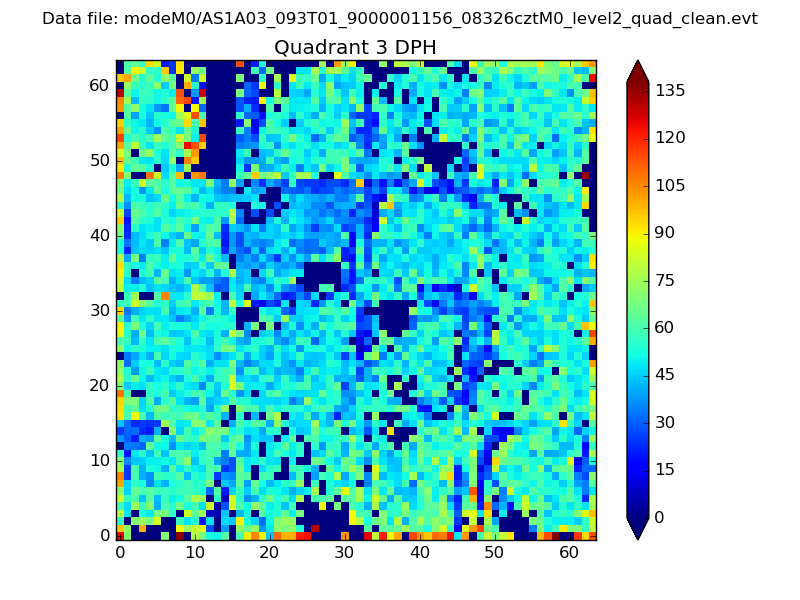 |
 |
Quadrant C |
| Plot type | Count rate plots | Images |
|---|---|---|
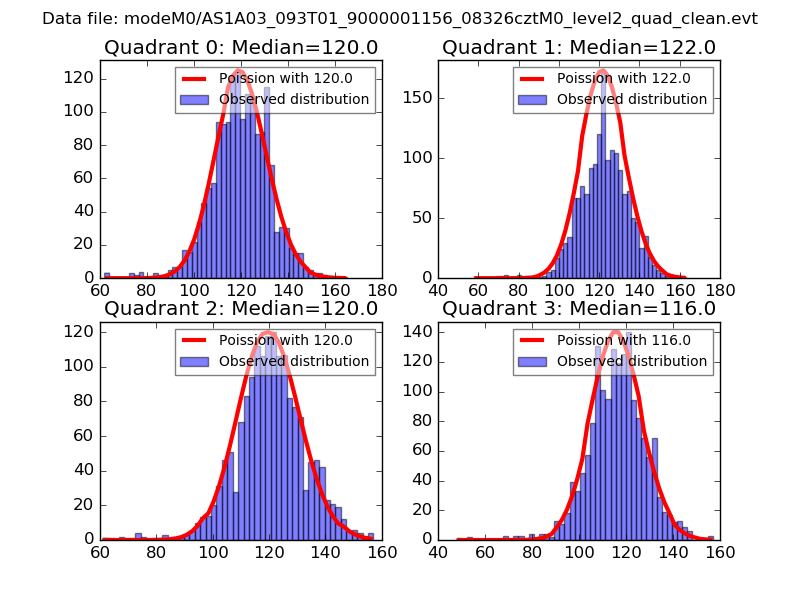
| Comparison with Poisson distribution Blue bars denote a histogram of data divided into 1 sec bins. Red curve is a Poisson curve with rate = median count rate of data. |
 |
 |
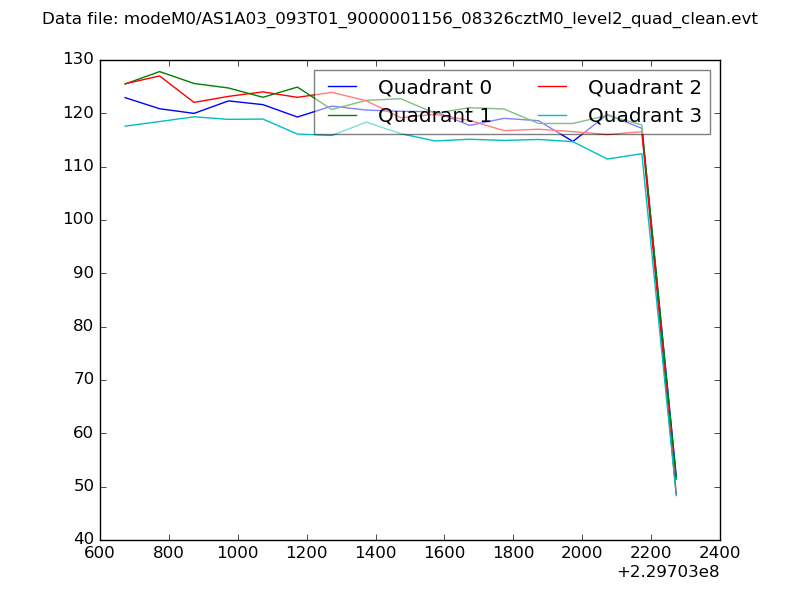
| Quadrant-wise count rates Data is divided into 100 sec bins |
 |
|
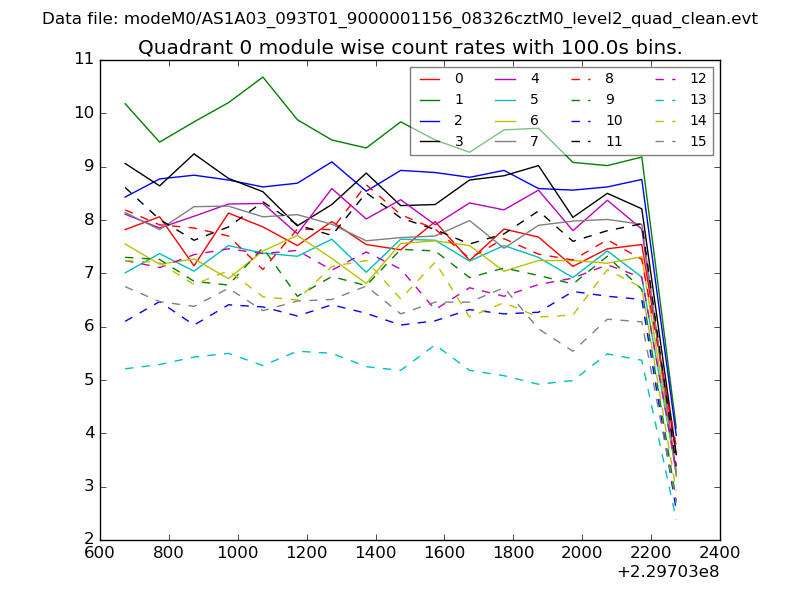
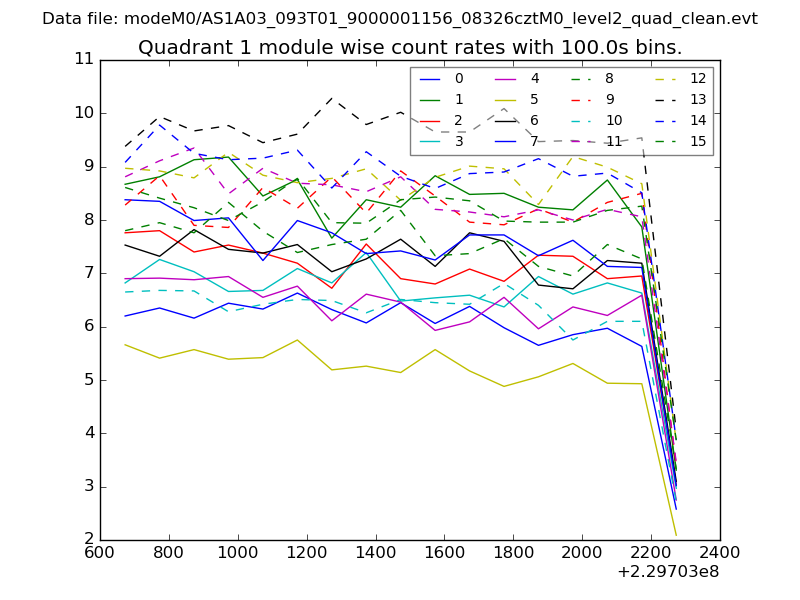
| Module-wise count rates for Quadrant A Data is divided into 100 sec bins |
 |
 |
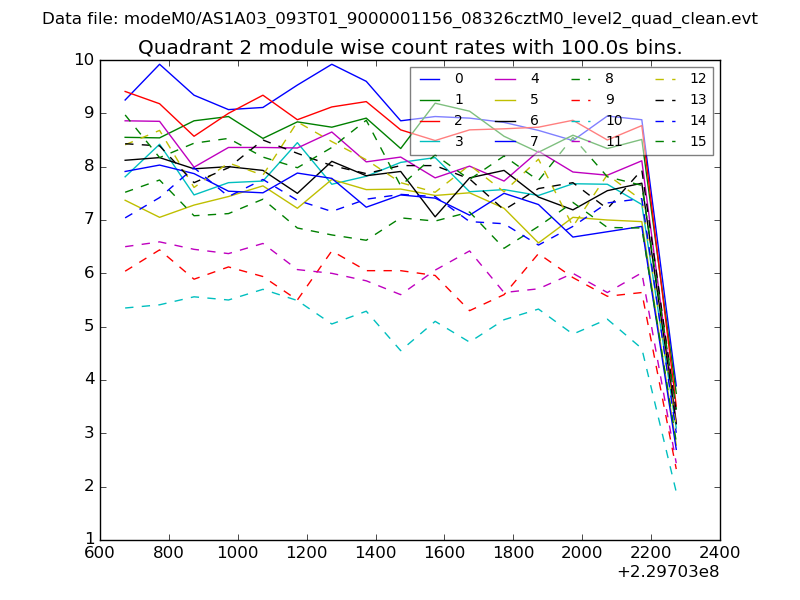
| Module-wise count rates for Quadrant B Data is divided into 100 sec bins |
 |
 |
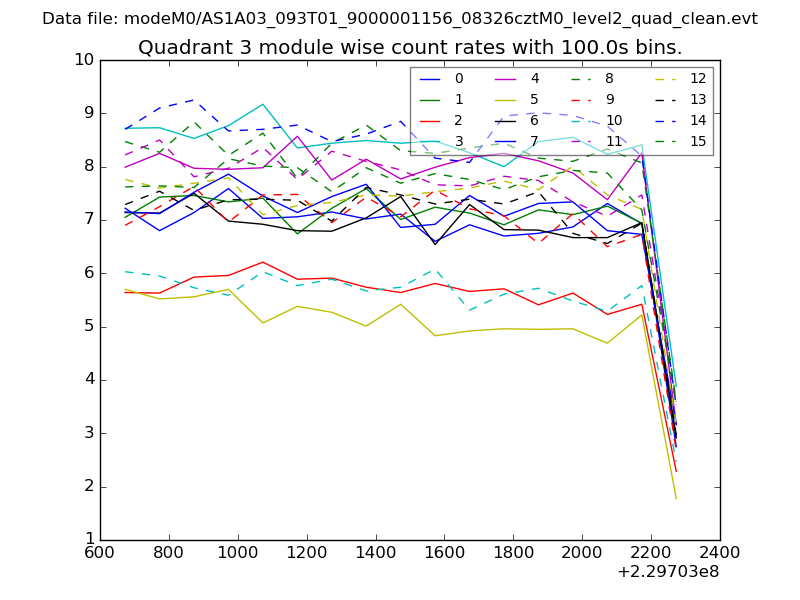
| Module-wise count rates for Quadrant C Data is divided into 100 sec bins |
 |
 |
| Module-wise count rates for Quadrant D Data is divided into 100 sec bins |
 |
 |
| Parameter | Plot |
|---|---|
| CZT HV Monitor | 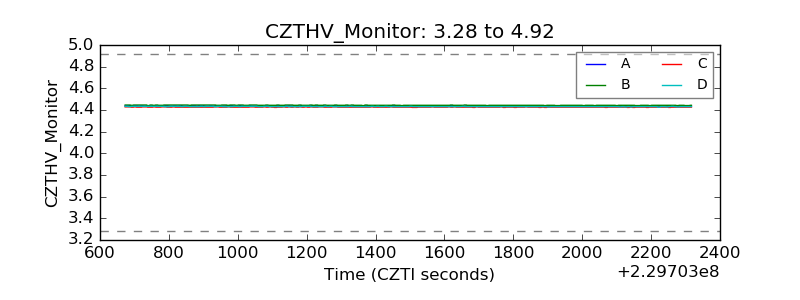 |
| D_VDD |  |
| Temperature 1 |  |
| Veto HV Monitor | 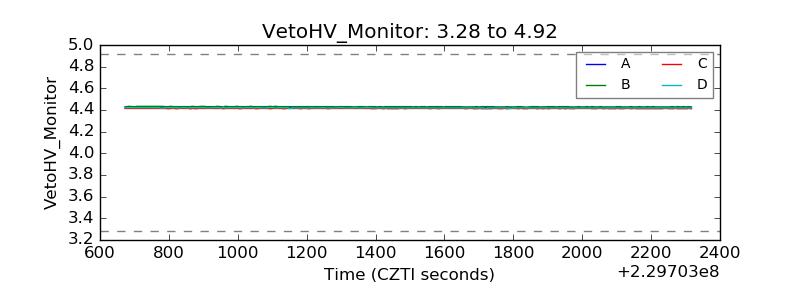 |
| Veto LLD |  |
| Alpha Counter | 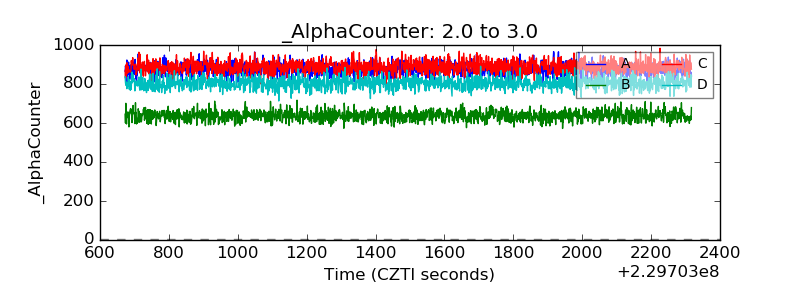 |
| _CPM_Rate | 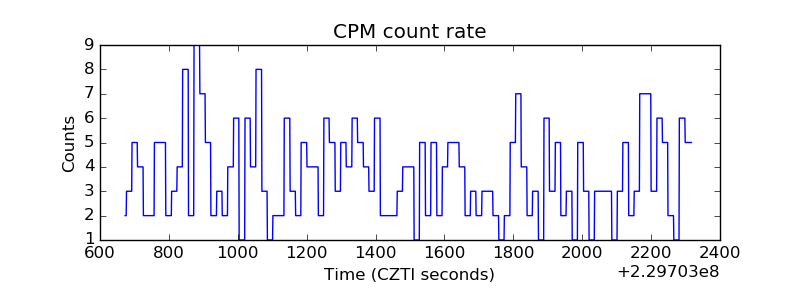 |
| CZT Counter | 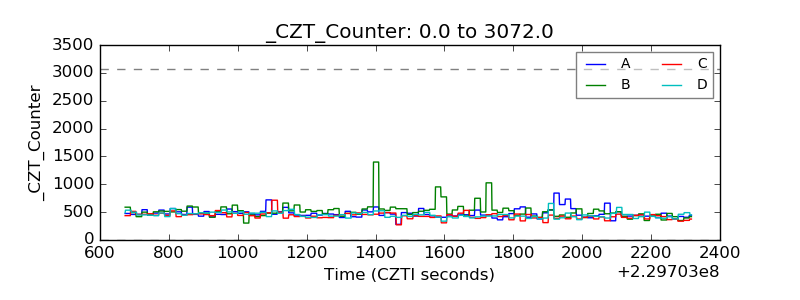 |
| +2.5 Volts monitor |  |
| +5 Volts monitor |  |
| _ROLL_ROT | 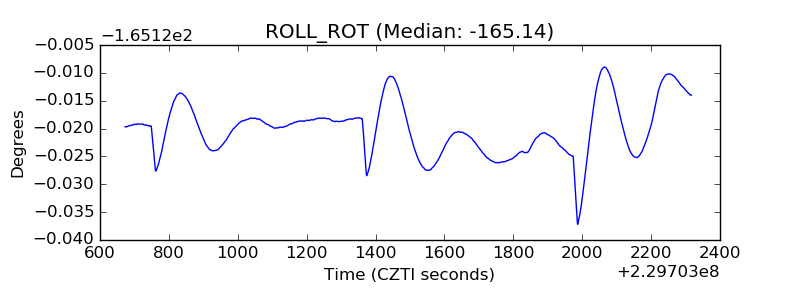 |
| _Roll_DEC | 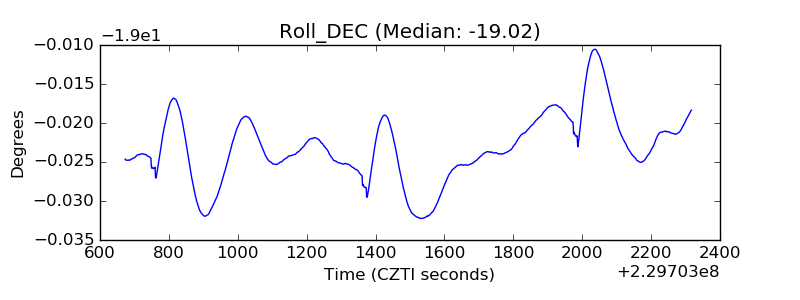 |
| _Roll_RA | 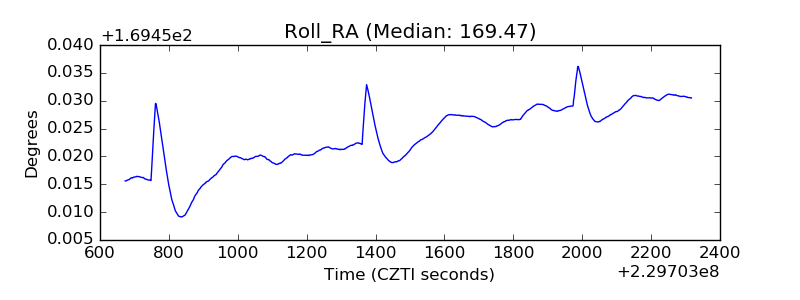 |
| Veto Counter | 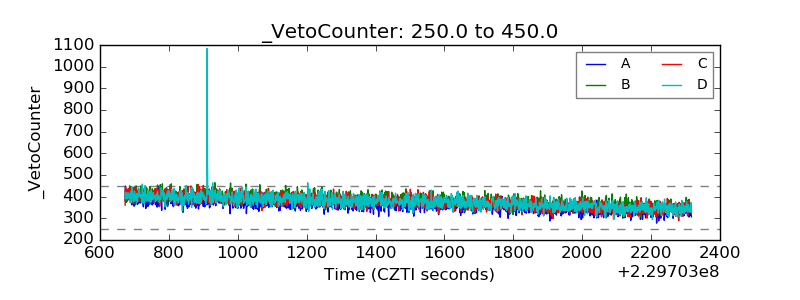 |