| Param | Original file | Final file |
|---|---|---|
| Filename | modeM0/AS1G07_080T03_9000001154cztM0_level2.fits | modeM0/AS1G07_080T03_9000001154cztM0_level2_quad_clean.evt |
| Size (bytes) | 362,278,080 | 365,434,560 |
| Size | 345.5 MB | 348.5 MB |
| Events in quadrant A | 2,218,880 | 2,232,209 |
| Events in quadrant B | 2,135,746 | 2,239,865 |
| Events in quadrant C | 2,159,986 | 2,093,882 |
| Events in quadrant D | 1,879,070 | 1,923,238 |
| Mode M9 | |||
|---|---|---|---|
| Quadrant | BADHDUFLAG | Total packets | Discarded packets |
| A | 0 | 80 | 0 |
| B | 0 | 80 | 0 |
| C | 0 | 80 | 0 |
| D | 0 | 80 | 0 |
| Mode M0 | |||
|---|---|---|---|
| Quadrant | BADHDUFLAG | Total packets | Discarded packets |
| A | 0 | 80326 | 0 |
| B | 0 | 78880 | 0 |
| C | 0 | 76882 | 0 |
| D | 0 | 83119 | 0 |
| Mode SS | |||
|---|---|---|---|
| Quadrant | BADHDUFLAG | Total packets | Discarded packets |
| A | 0 | 764 | 0 |
| B | 0 | 764 | 0 |
| C | 0 | 764 | 0 |
| D | 0 | 764 | 0 |
| Quadrant | Total seconds | Saturated seconds | Saturation percentage |
|---|---|---|---|
| A | 37536 | 742 | 1.976769% |
| B | 37536 | 534 | 1.422634% |
| C | 37535 | 360 | 0.959105% |
| D | 37536 | 730 | 1.944800% |
Noise dominated data is calculated using 1-second bins in cleaned event files. If a bin has >2000 counts, and if more than 50% of those come from <1% of pixels, then it is considered to be noise-dominated and hence unusable.
| Quadrant | # 1 sec bins | Bins with >0 counts | Bins with >2000 counts | High rate bins dominated by noise | Noise dominated (total time) | Noise dominated (detector-on time) | Marked lightcurve |
|---|---|---|---|---|---|---|---|
| A | 45476 | 37530 | 0 | 0 | 0.00% | 0.00% |  |
| B | 45476 | 37530 | 0 | 0 | 0.00% | 0.00% |  |
| C | 45476 | 37531 | 0 | 0 | 0.00% | 0.00% |  |
| D | 45476 | 37530 | 0 | 0 | 0.00% | 0.00% |  |
Top three noisy pixels from each quadrant. If the there are fewer than three noisy pixels in the level2.evt file, extra rows are filled as -1
| Pixel properties | Quadrant properties | ||||||
|---|---|---|---|---|---|---|---|
| Quadrant | DetID | PixID | Counts | Sigma | Mean | Median | Sigma |
| A | 0 | 29 | 2162 | 11.21 | 578 | 545 | 144.3 |
| A | 7 | 110 | 1796 | 8.67 | 578 | 545 | 144.3 |
| A | 9 | 19 | 1638 | 7.58 | 578 | 545 | 144.3 |
| B | 2 | 9 | 1788 | 11.25 | 564 | 538 | 111.1 |
| B | 12 | 226 | 1481 | 8.49 | 564 | 538 | 111.1 |
| B | 3 | 17 | 1448 | 8.19 | 564 | 538 | 111.1 |
| C | 1 | 80 | 1627 | 7.23 | 570 | 531 | 151.6 |
| C | 1 | 81 | 1616 | 7.16 | 570 | 531 | 151.6 |
| C | 12 | 241 | 1495 | 6.36 | 570 | 531 | 151.6 |
| D | 6 | 67 | 1348 | 6.0 | 536 | 489 | 143.2 |
| D | 6 | 231 | 1347 | 5.99 | 536 | 489 | 143.2 |
| D | 7 | 5 | 1344 | 5.97 | 536 | 489 | 143.2 |
Histogram calculated using DETX and DETY for each event in the final _common_clean file
| Quadrant A |  |
 |
Quadrant B |
|---|---|---|---|
| Quadrant D | 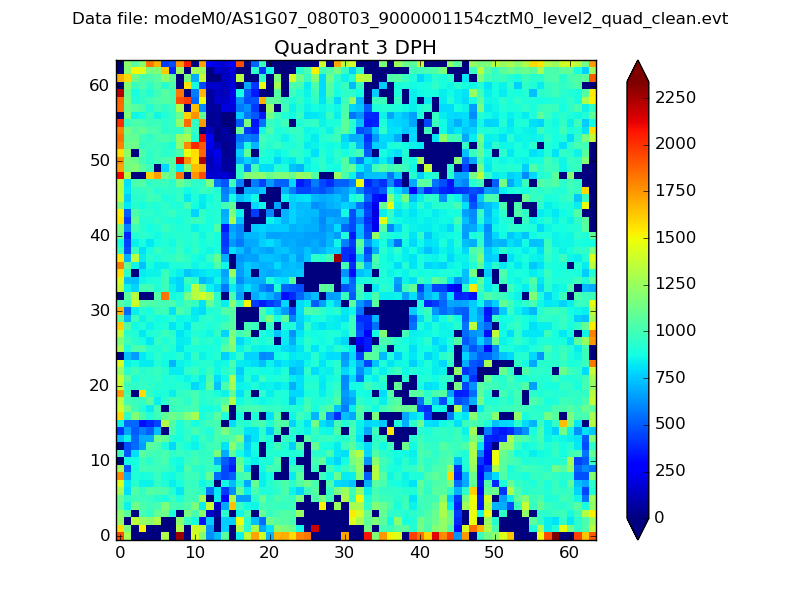 |
 |
Quadrant C |
| Plot type | Count rate plots | Images |
|---|---|---|
| Comparison with Poisson distribution Blue bars denote a histogram of data divided into 1 sec bins. Red curve is a Poisson curve with rate = median count rate of data. |
 |
 |
| Quadrant-wise count rates Data is divided into 100 sec bins |
 |
|
| Module-wise count rates for Quadrant A Data is divided into 100 sec bins |
 |
 |
| Module-wise count rates for Quadrant B Data is divided into 100 sec bins |
 |
 |
| Module-wise count rates for Quadrant C Data is divided into 100 sec bins |
 |
 |
| Module-wise count rates for Quadrant D Data is divided into 100 sec bins |
 |
 |
| Parameter | Plot |
|---|---|
| CZT HV Monitor | 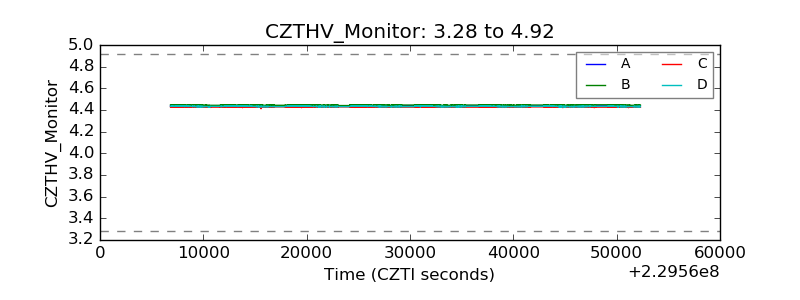 |
| D_VDD |  |
| Temperature 1 |  |
| Veto HV Monitor |  |
| Veto LLD |  |
| Alpha Counter |  |
| _CPM_Rate |  |
| CZT Counter |  |
| +2.5 Volts monitor |  |
| +5 Volts monitor |  |
| _ROLL_ROT |  |
| _Roll_DEC |  |
| _Roll_RA |  |
| Veto Counter |  |