| Param | Original file | Final file |
|---|---|---|
| Filename | modeM0/AS1G07_080T03_9000001154_08302cztM0_level2.evt | modeM0/AS1G07_080T03_9000001154_08302cztM0_level2_quad_clean.evt |
| Size (bytes) | 337,029,120 | 61,410,240 |
| Size | 321.4 MB | 58.6 MB |
| Events in quadrant A | 2,444,898 | 373,251 |
| Events in quadrant B | 2,571,371 | 378,205 |
| Events in quadrant C | 2,419,746 | 367,667 |
| Events in quadrant D | 2,396,040 | 355,479 |
| Mode M9 | |||
|---|---|---|---|
| Quadrant | BADHDUFLAG | Total packets | Discarded packets |
| A | 0 | 9 | 0 |
| B | 0 | 9 | 0 |
| C | 0 | 9 | 0 |
| D | 0 | 9 | 0 |
| Mode M0 | |||
|---|---|---|---|
| Quadrant | BADHDUFLAG | Total packets | Discarded packets |
| A | 0 | 11129 | 2 |
| B | 0 | 11339 | 1 |
| C | 0 | 11171 | 1 |
| D | 0 | 11291 | 1 |
| Mode SS | |||
|---|---|---|---|
| Quadrant | BADHDUFLAG | Total packets | Discarded packets |
| A | 0 | 112 | 0 |
| B | 0 | 112 | 0 |
| C | 0 | 112 | 0 |
| D | 0 | 112 | 0 |
| Quadrant | Total seconds | Saturated seconds | Saturation percentage |
|---|---|---|---|
| A | 5497 | 13 | 0.236493% |
| B | 5497 | 25 | 0.454794% |
| C | 5497 | 19 | 0.345643% |
| D | 5497 | 10 | 0.181917% |
Noise dominated data is calculated using 1-second bins in cleaned event files. If a bin has >2000 counts, and if more than 50% of those come from <1% of pixels, then it is considered to be noise-dominated and hence unusable.
| Quadrant | # 1 sec bins | Bins with >0 counts | Bins with >2000 counts | High rate bins dominated by noise | Noise dominated (total time) | Noise dominated (detector-on time) | Marked lightcurve |
|---|---|---|---|---|---|---|---|
| A | 6392 | 5498 | 1 | 1 | 0.02% | 0.02% | 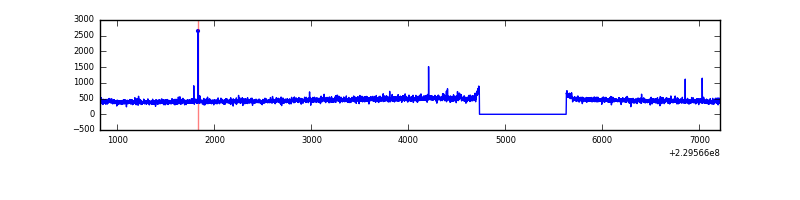 |
| B | 6392 | 5498 | 2 | 2 | 0.03% | 0.04% | 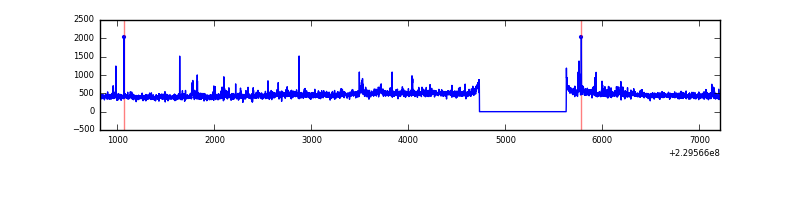 |
| C | 6392 | 5498 | 5 | 5 | 0.08% | 0.09% | 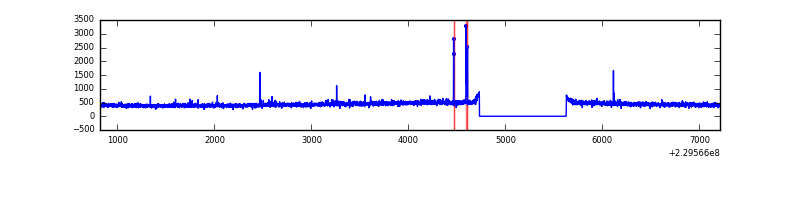 |
| D | 6392 | 5498 | 4 | 4 | 0.06% | 0.07% | 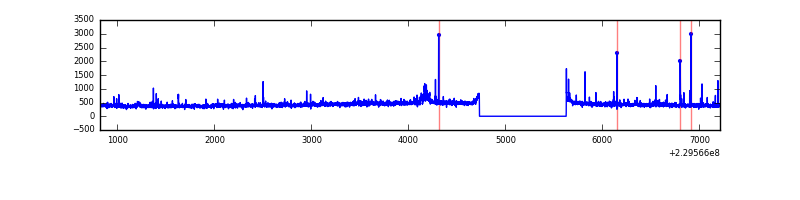 |
Top three noisy pixels from each quadrant. If the there are fewer than three noisy pixels in the level2.evt file, extra rows are filled as -1
| Pixel properties | Quadrant properties | ||||||
|---|---|---|---|---|---|---|---|
| Quadrant | DetID | PixID | Counts | Sigma | Mean | Median | Sigma |
| A | 13 | 251 | 9600 | 69.69 | 626 | 612 | 129.0 |
| A | 0 | 23 | 8613 | 62.04 | 626 | 612 | 129.0 |
| A | 13 | 248 | 7467 | 53.15 | 626 | 612 | 129.0 |
| B | 4 | 81 | 65110 | 533.68 | 630 | 614 | 120.9 |
| B | 0 | 214 | 27041 | 218.67 | 630 | 614 | 120.9 |
| B | 0 | 219 | 22746 | 183.13 | 630 | 614 | 120.9 |
| C | 9 | 54 | 26104 | 180.11 | 608 | 612 | 141.5 |
| C | 10 | 9 | 20769 | 142.41 | 608 | 612 | 141.5 |
| C | 13 | 61 | 4707 | 28.93 | 608 | 612 | 141.5 |
| D | 2 | 14 | 47201 | 286.89 | 602 | 588 | 162.5 |
| D | 7 | 71 | 21672 | 129.77 | 602 | 588 | 162.5 |
| D | 2 | 234 | 17852 | 106.26 | 602 | 588 | 162.5 |
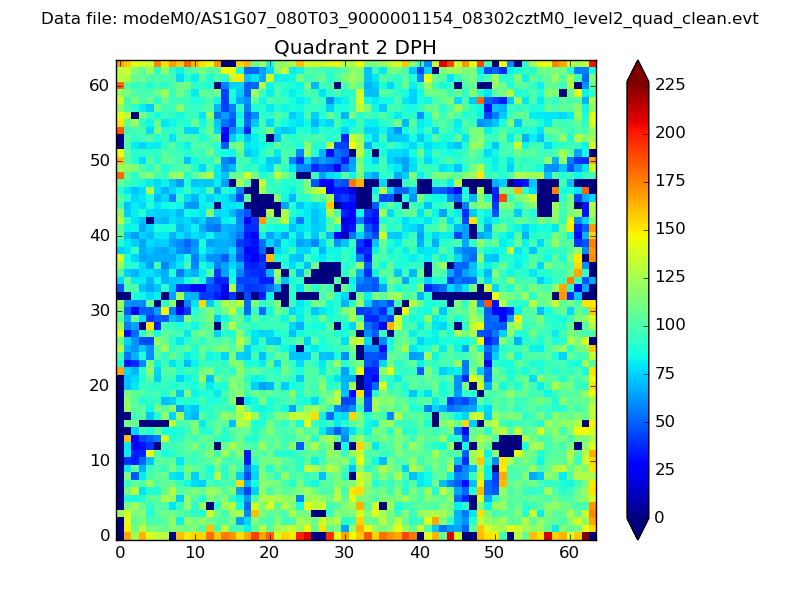
Histogram calculated using DETX and DETY for each event in the final _common_clean file
| Quadrant A | 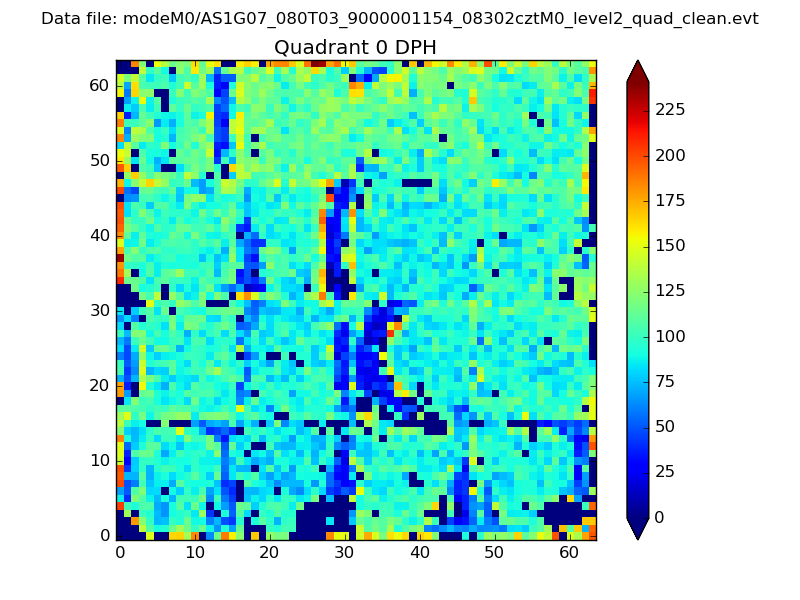 |
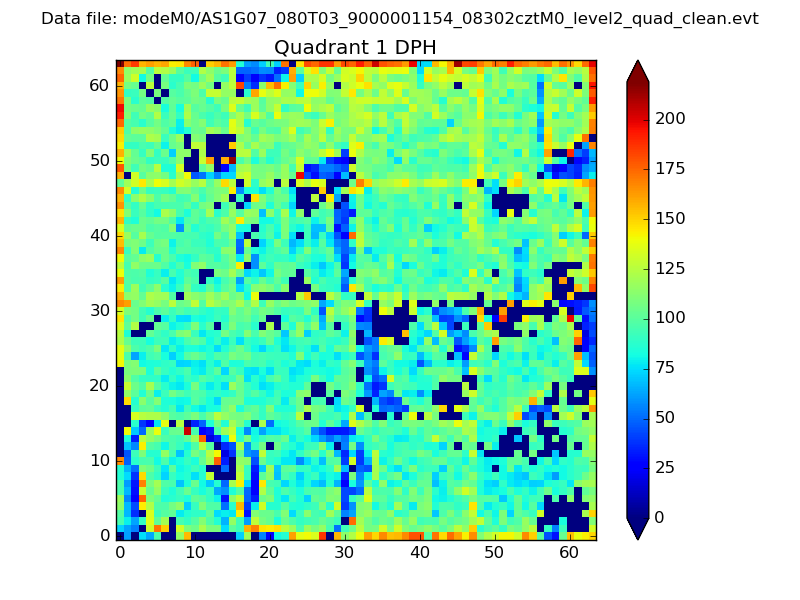 |
Quadrant B |
|---|---|---|---|
| Quadrant D | 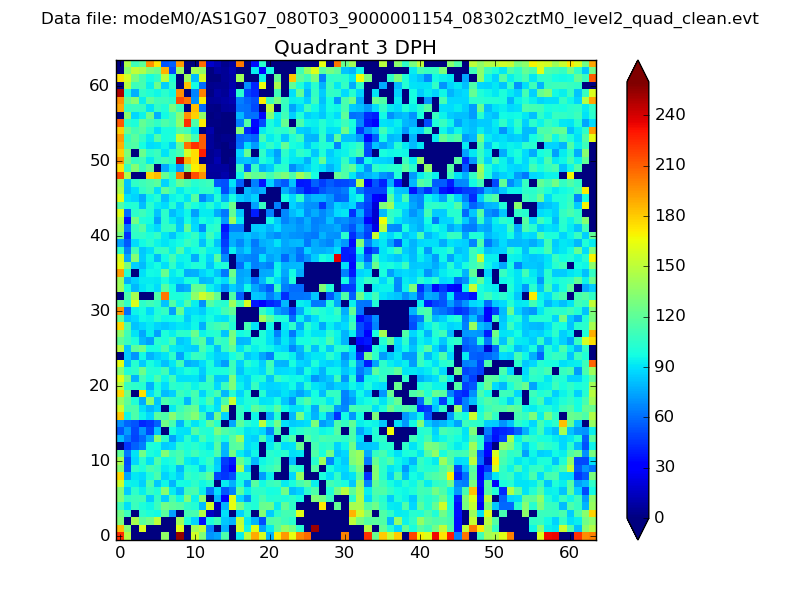 |
 |
Quadrant C |
| Plot type | Count rate plots | Images |
|---|---|---|
| Comparison with Poisson distribution Blue bars denote a histogram of data divided into 1 sec bins. Red curve is a Poisson curve with rate = median count rate of data. |
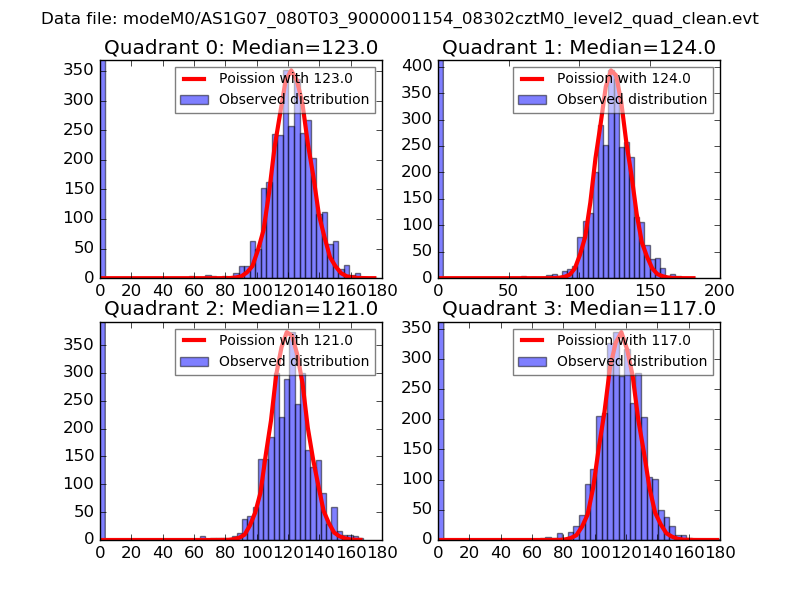 |
 |
| Quadrant-wise count rates Data is divided into 100 sec bins |
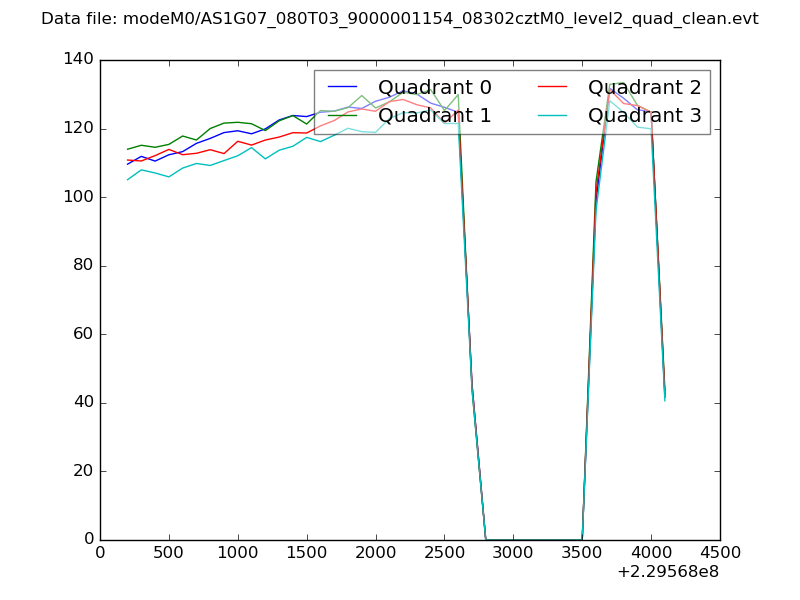 |
|
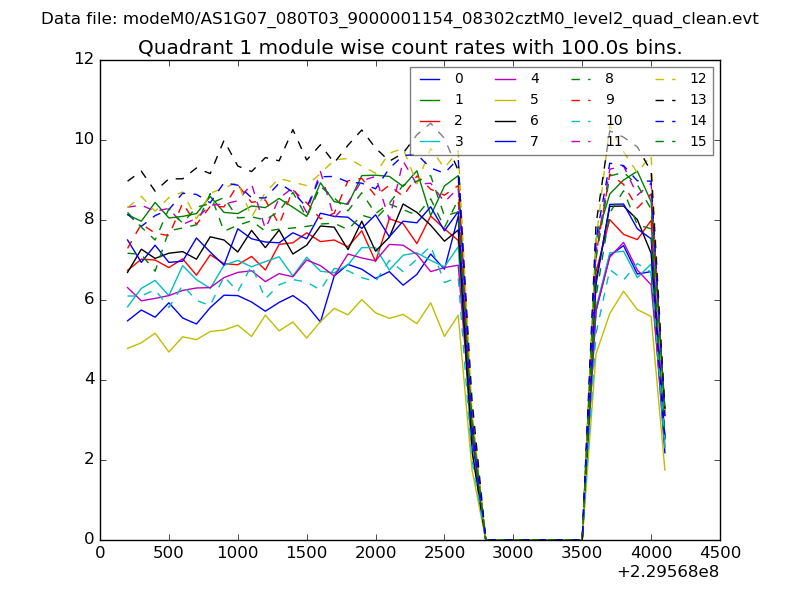
| Module-wise count rates for Quadrant A Data is divided into 100 sec bins |
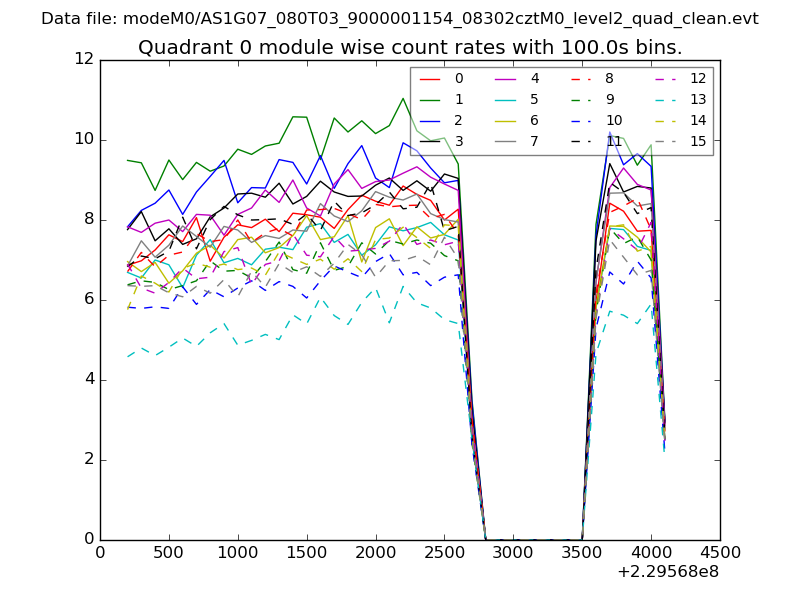 |
 |
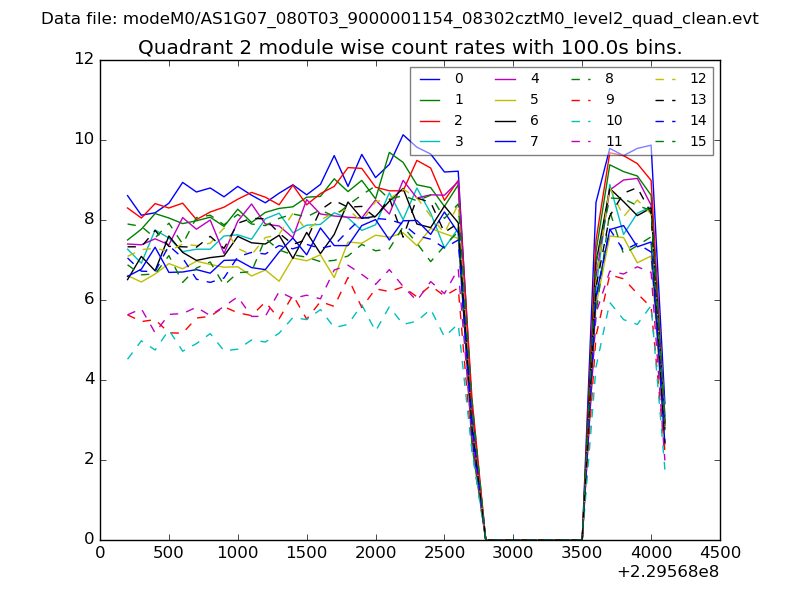
| Module-wise count rates for Quadrant B Data is divided into 100 sec bins |
 |
 |
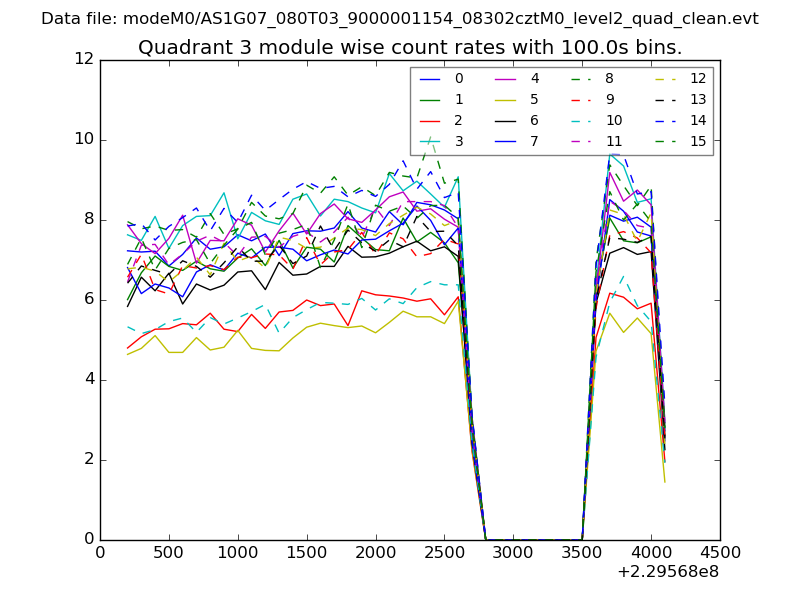
| Module-wise count rates for Quadrant C Data is divided into 100 sec bins |
 |
 |
| Module-wise count rates for Quadrant D Data is divided into 100 sec bins |
 |
 |
| Parameter | Plot |
|---|---|
| CZT HV Monitor | 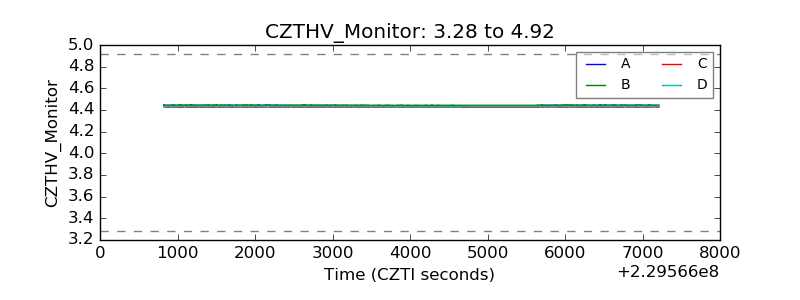 |
| D_VDD | 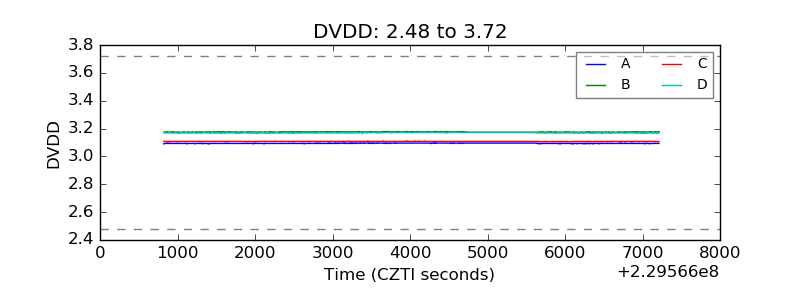 |
| Temperature 1 | 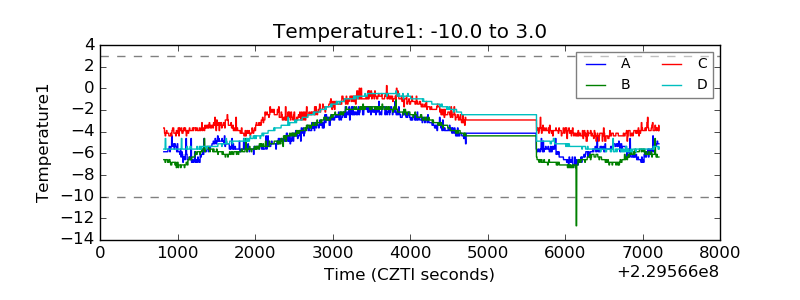 |
| Veto HV Monitor | 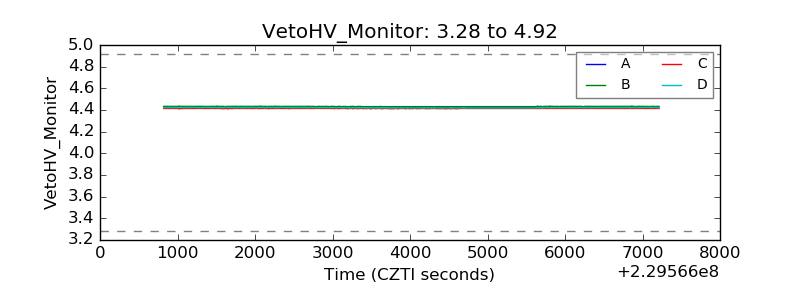 |
| Veto LLD | 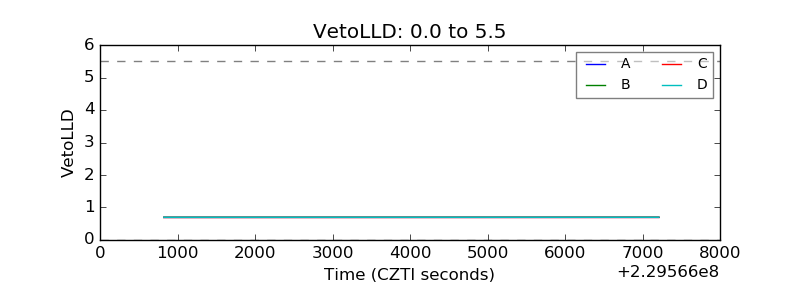 |
| Alpha Counter | 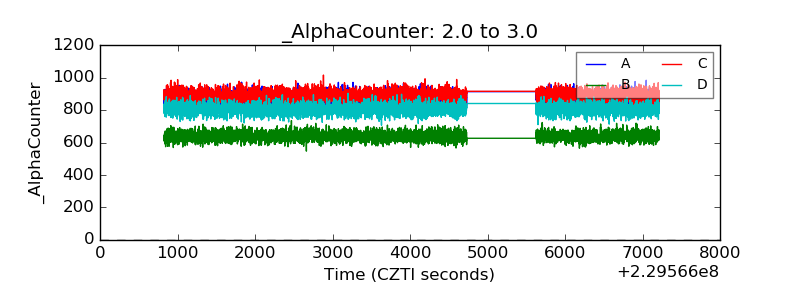 |
| _CPM_Rate | 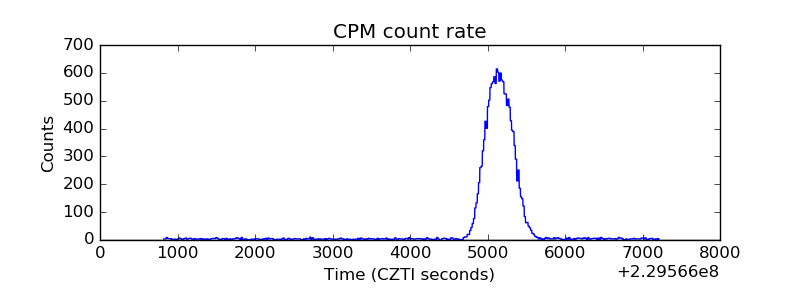 |
| CZT Counter | 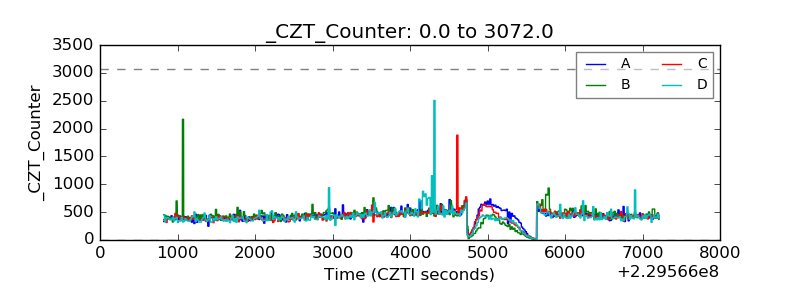 |
| +2.5 Volts monitor |  |
| +5 Volts monitor |  |
| _ROLL_ROT | 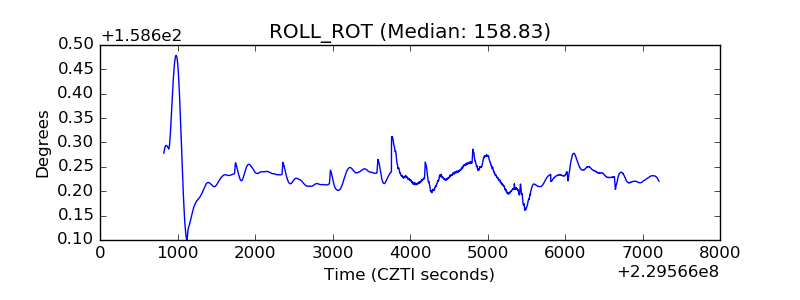 |
| _Roll_DEC | 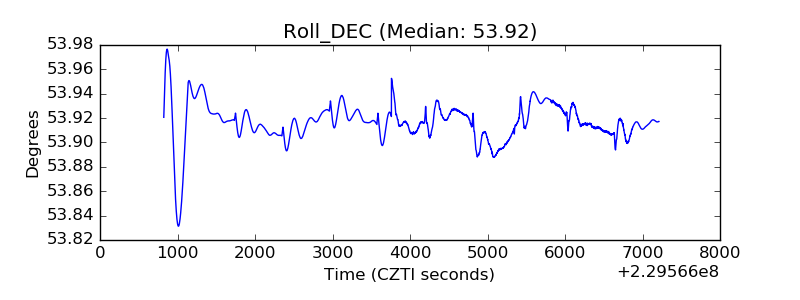 |
| _Roll_RA | 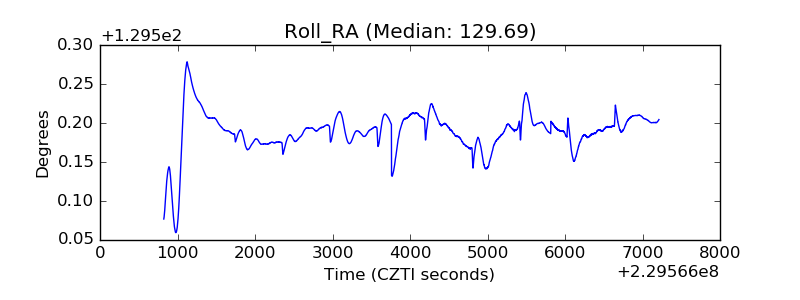 |
| Veto Counter | 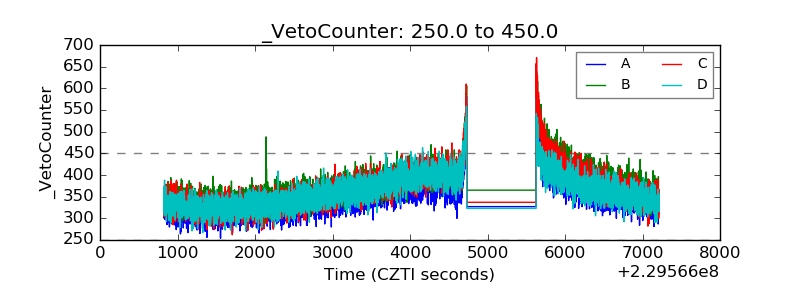 |