| Param | Original file | Final file |
|---|---|---|
| Filename | modeM0/AS1G07_080T03_9000001154_08305cztM0_level2.evt | modeM0/AS1G07_080T03_9000001154_08305cztM0_level2_quad_clean.evt |
| Size (bytes) | 407,335,680 | 64,696,320 |
| Size | 388.5 MB | 61.7 MB |
| Events in quadrant A | 2,999,283 | 384,345 |
| Events in quadrant B | 3,120,396 | 388,882 |
| Events in quadrant C | 2,884,921 | 379,043 |
| Events in quadrant D | 2,904,397 | 368,349 |
| Mode M9 | |||
|---|---|---|---|
| Quadrant | BADHDUFLAG | Total packets | Discarded packets |
| A | 0 | 11 | 0 |
| B | 0 | 11 | 0 |
| C | 0 | 11 | 0 |
| D | 0 | 11 | 0 |
| Mode M0 | |||
|---|---|---|---|
| Quadrant | BADHDUFLAG | Total packets | Discarded packets |
| A | 0 | 12895 | 2 |
| B | 0 | 13183 | 1 |
| C | 0 | 12853 | 1 |
| D | 0 | 13095 | 1 |
| Mode SS | |||
|---|---|---|---|
| Quadrant | BADHDUFLAG | Total packets | Discarded packets |
| A | 0 | 128 | 0 |
| B | 0 | 128 | 0 |
| C | 0 | 128 | 0 |
| D | 0 | 128 | 0 |
| Quadrant | Total seconds | Saturated seconds | Saturation percentage |
|---|---|---|---|
| A | 6276 | 40 | 0.637349% |
| B | 6276 | 46 | 0.732951% |
| C | 6276 | 30 | 0.478011% |
| D | 6276 | 33 | 0.525813% |
Noise dominated data is calculated using 1-second bins in cleaned event files. If a bin has >2000 counts, and if more than 50% of those come from <1% of pixels, then it is considered to be noise-dominated and hence unusable.
| Quadrant | # 1 sec bins | Bins with >0 counts | Bins with >2000 counts | High rate bins dominated by noise | Noise dominated (total time) | Noise dominated (detector-on time) | Marked lightcurve |
|---|---|---|---|---|---|---|---|
| A | 7416 | 6276 | 0 | 0 | 0.00% | 0.00% | 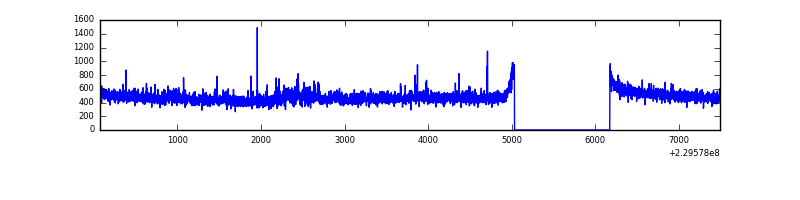 |
| B | 7416 | 6276 | 0 | 0 | 0.00% | 0.00% | 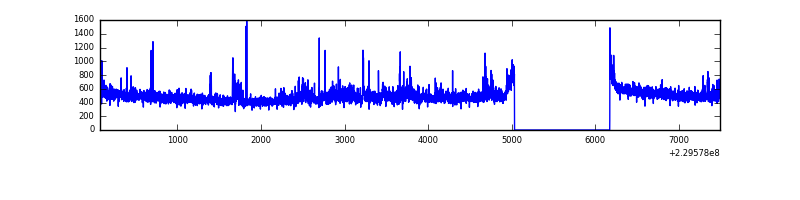 |
| C | 7416 | 6277 | 2 | 2 | 0.03% | 0.03% | 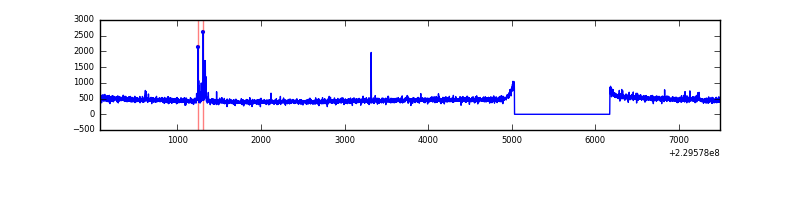 |
| D | 7416 | 6277 | 11 | 11 | 0.15% | 0.18% | 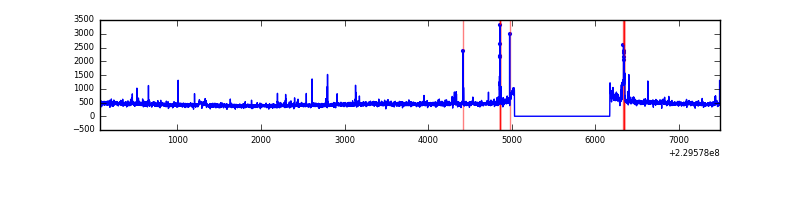 |
Top three noisy pixels from each quadrant. If the there are fewer than three noisy pixels in the level2.evt file, extra rows are filled as -1
| Pixel properties | Quadrant properties | ||||||
|---|---|---|---|---|---|---|---|
| Quadrant | DetID | PixID | Counts | Sigma | Mean | Median | Sigma |
| A | 0 | 23 | 22311 | 141.34 | 757 | 742 | 152.6 |
| A | 1 | 162 | 19788 | 124.8 | 757 | 742 | 152.6 |
| A | 13 | 251 | 14458 | 89.88 | 757 | 742 | 152.6 |
| B | 0 | 214 | 93463 | 644.94 | 760 | 743 | 143.8 |
| B | 4 | 81 | 55778 | 382.81 | 760 | 743 | 143.8 |
| B | 12 | 111 | 15158 | 100.27 | 760 | 743 | 143.8 |
| C | 9 | 54 | 37695 | 219.67 | 726 | 729 | 168.3 |
| C | 10 | 9 | 14826 | 83.77 | 726 | 729 | 168.3 |
| C | 13 | 61 | 5682 | 29.43 | 726 | 729 | 168.3 |
| D | 2 | 14 | 58534 | 306.47 | 722 | 704 | 188.7 |
| D | 13 | 105 | 47520 | 248.1 | 722 | 704 | 188.7 |
| D | 2 | 234 | 18768 | 95.73 | 722 | 704 | 188.7 |
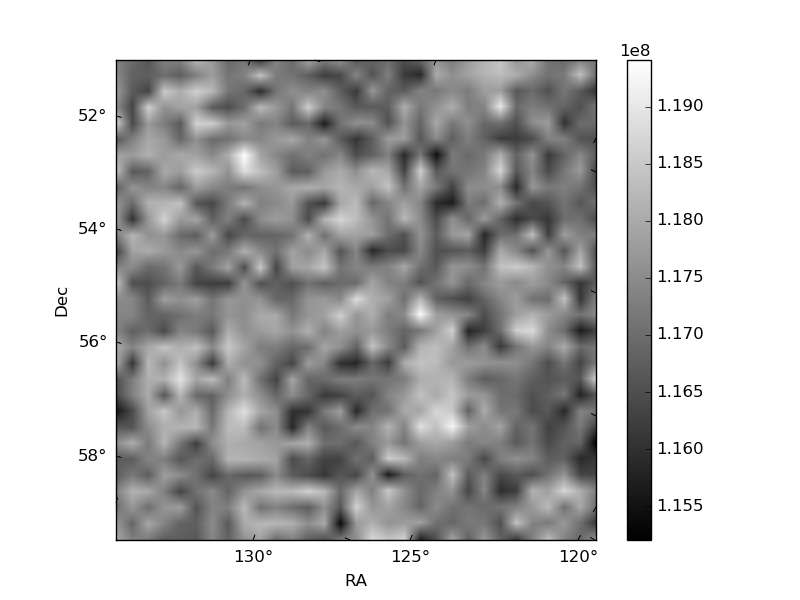
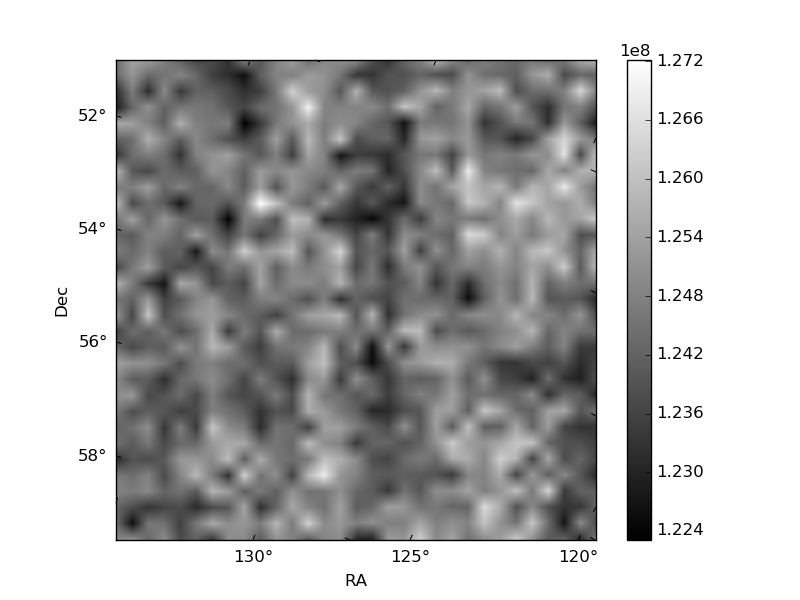
Histogram calculated using DETX and DETY for each event in the final _common_clean file
| Quadrant A | 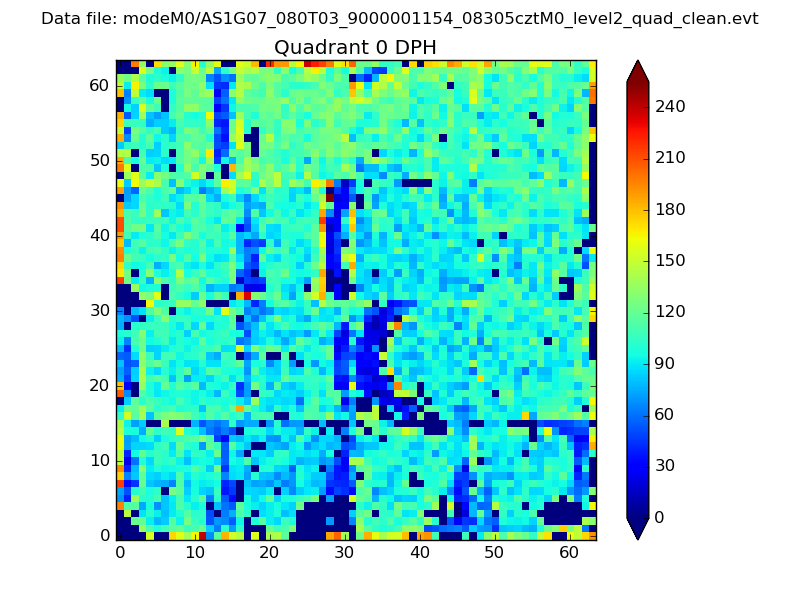 |
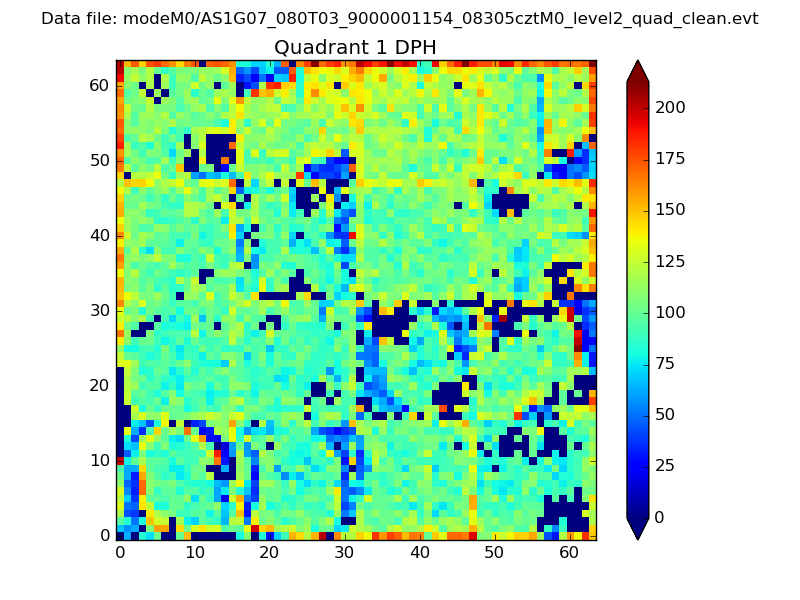 |
Quadrant B |
|---|---|---|---|
| Quadrant D | 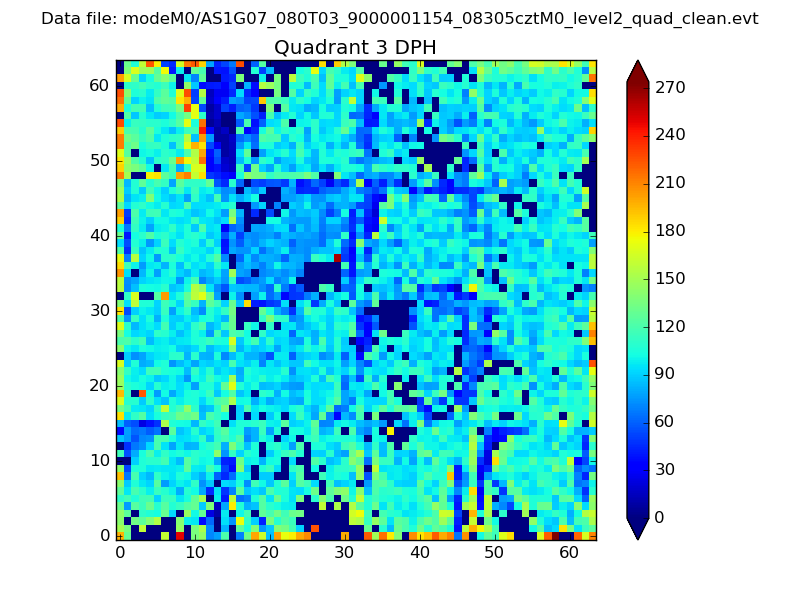 |
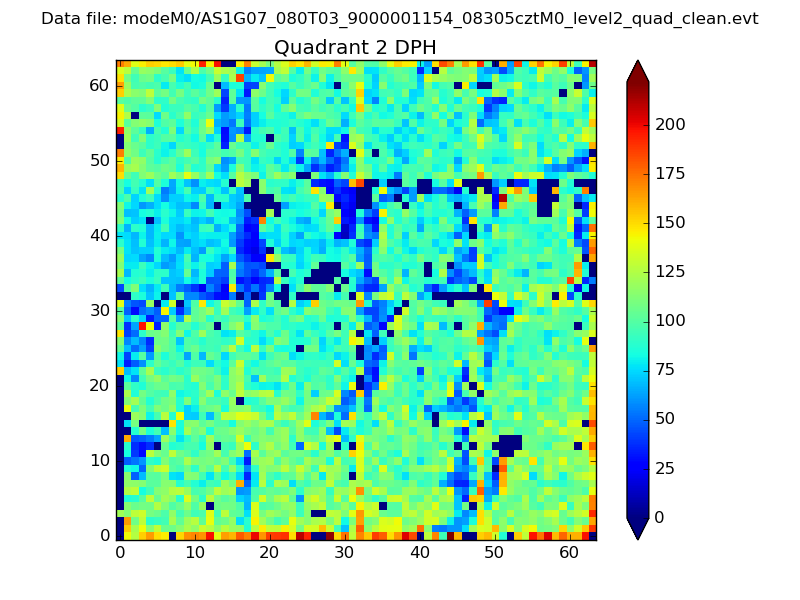 |
Quadrant C |
| Plot type | Count rate plots | Images |
|---|---|---|
| Comparison with Poisson distribution Blue bars denote a histogram of data divided into 1 sec bins. Red curve is a Poisson curve with rate = median count rate of data. |
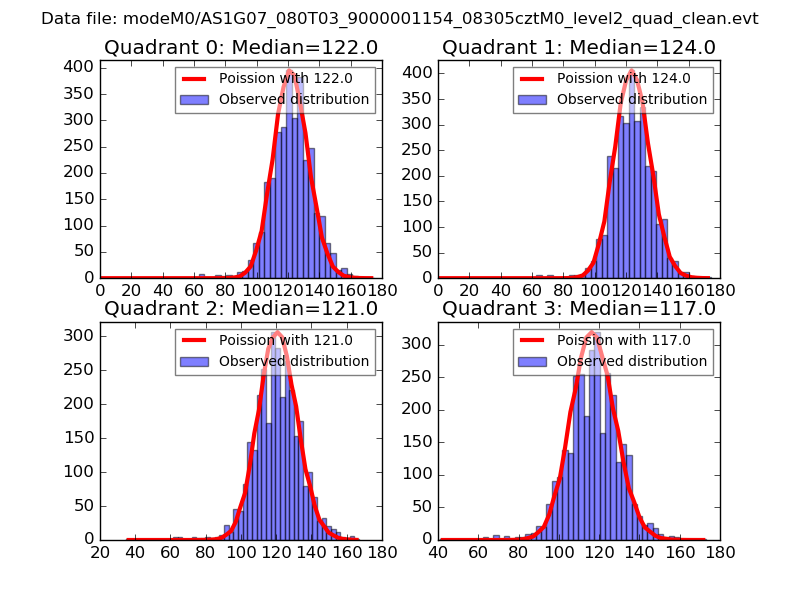 |
 |
| Quadrant-wise count rates Data is divided into 100 sec bins |
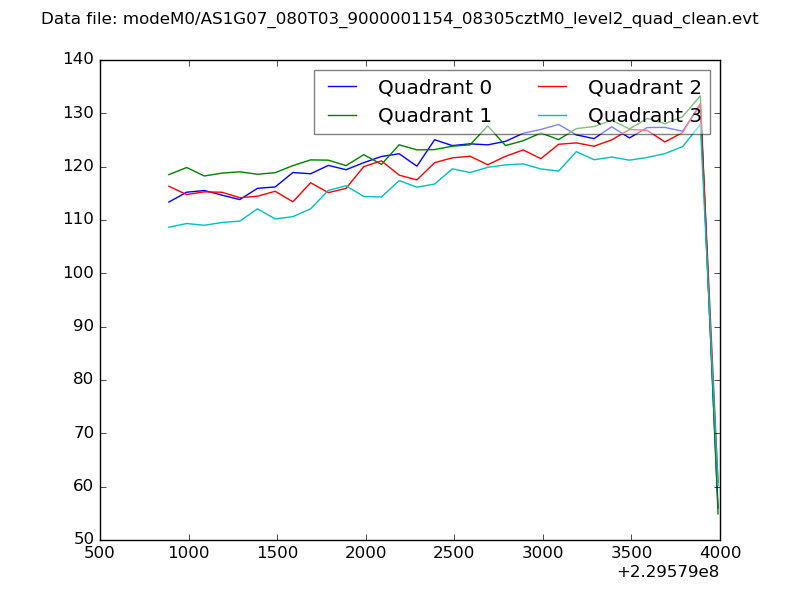 |
|
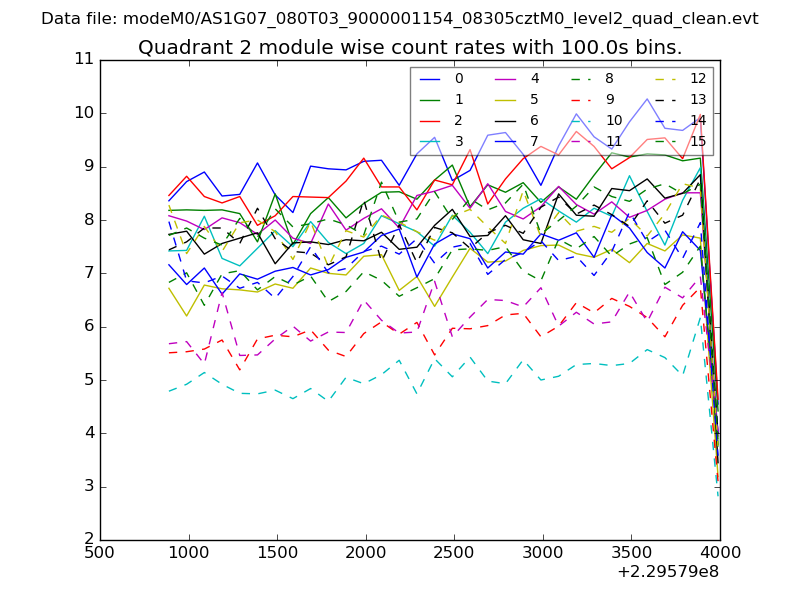
| Module-wise count rates for Quadrant A Data is divided into 100 sec bins |
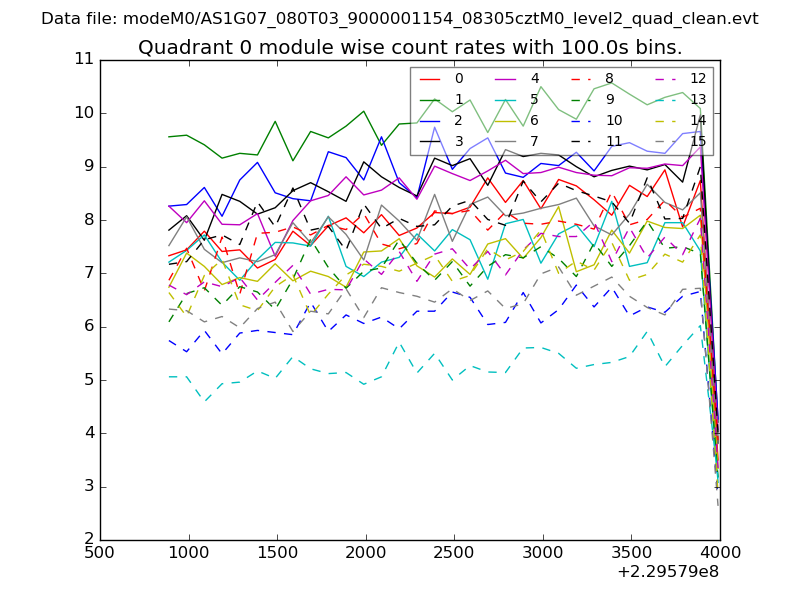 |
 |
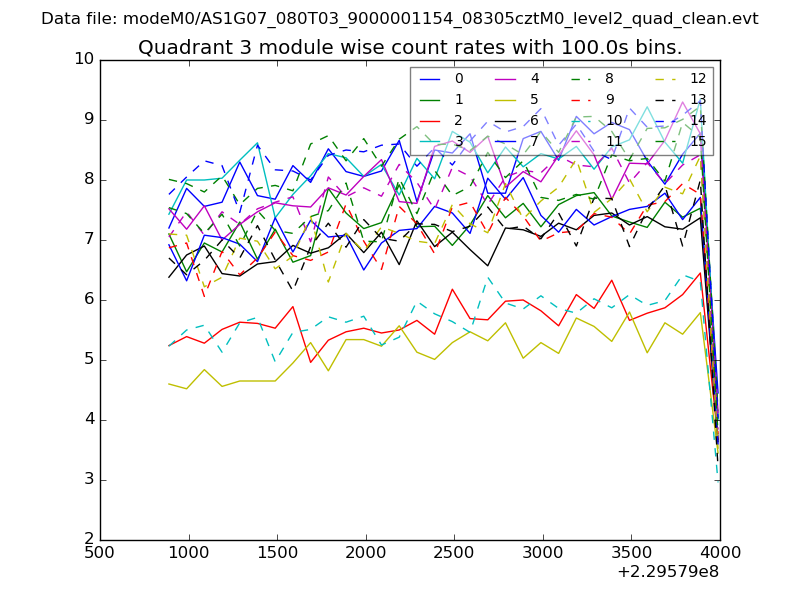
| Module-wise count rates for Quadrant B Data is divided into 100 sec bins |
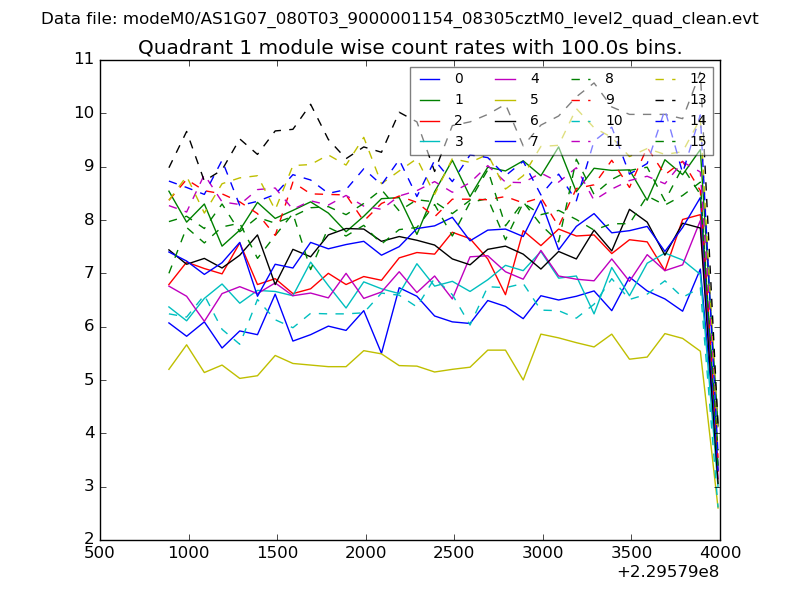 |
 |
| Module-wise count rates for Quadrant C Data is divided into 100 sec bins |
 |
 |
| Module-wise count rates for Quadrant D Data is divided into 100 sec bins |
 |
 |
| Parameter | Plot |
|---|---|
| CZT HV Monitor | 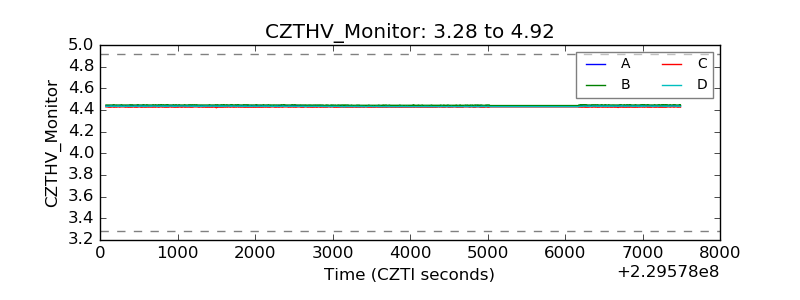 |
| D_VDD | 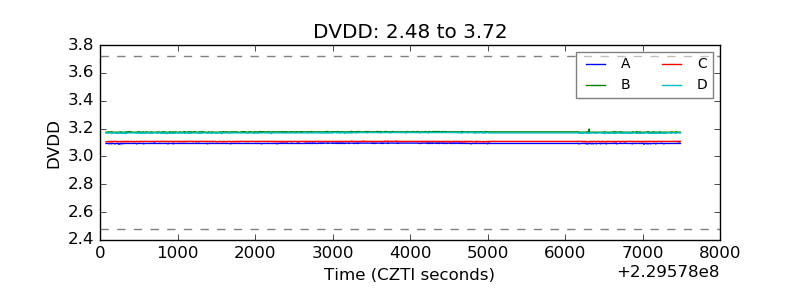 |
| Temperature 1 | 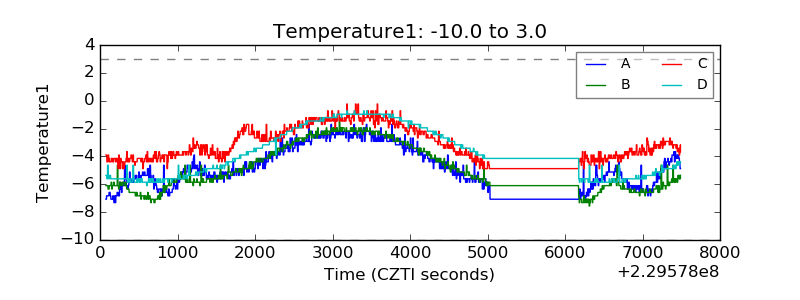 |
| Veto HV Monitor | 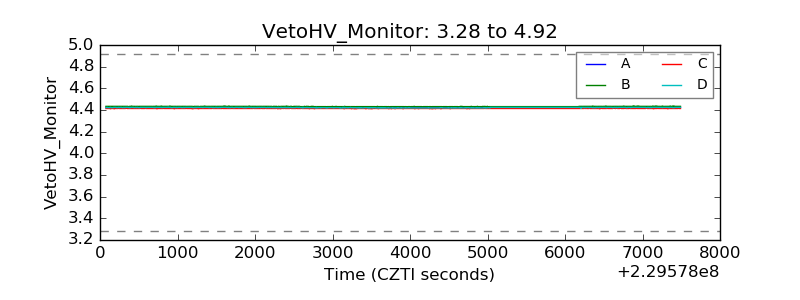 |
| Veto LLD | 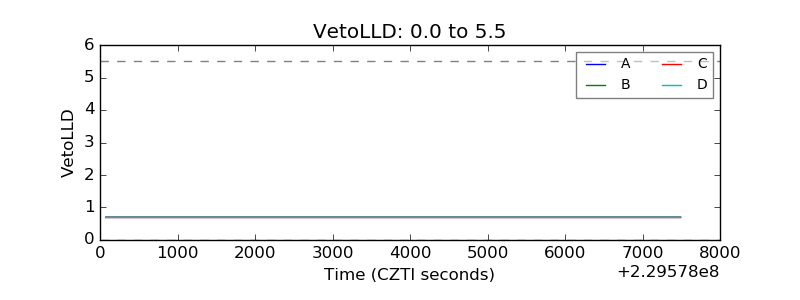 |
| Alpha Counter | 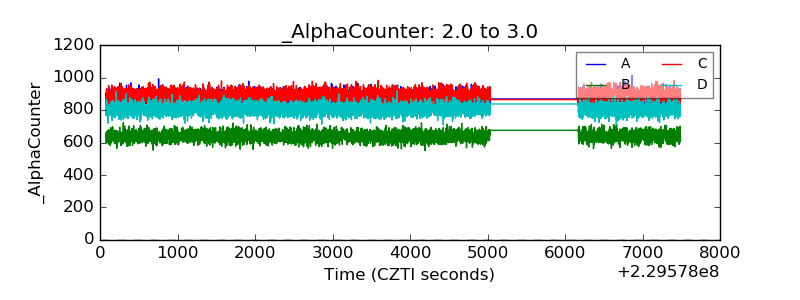 |
| _CPM_Rate | 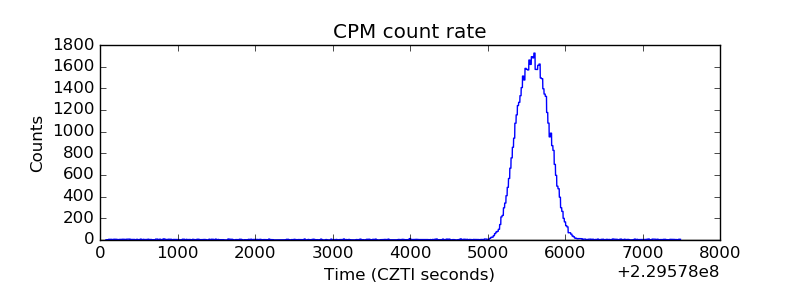 |
| CZT Counter | 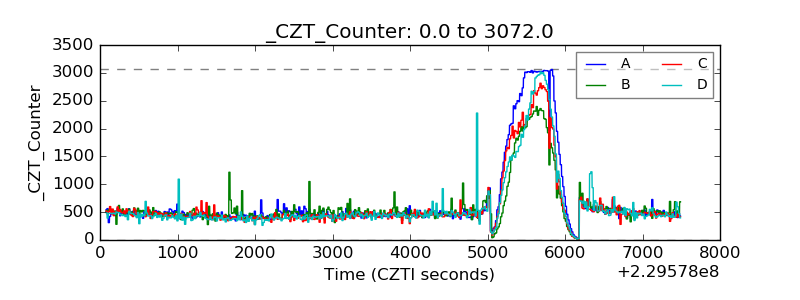 |
| +2.5 Volts monitor |  |
| +5 Volts monitor |  |
| _ROLL_ROT | 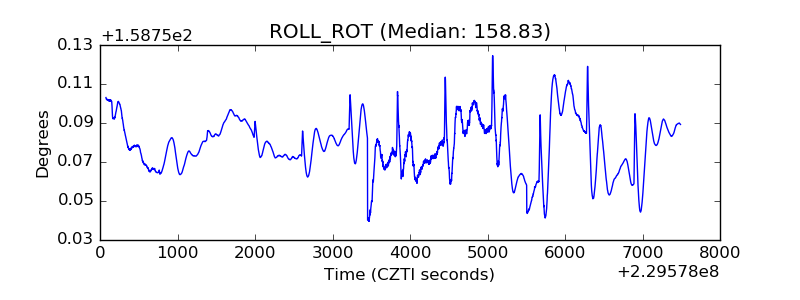 |
| _Roll_DEC | 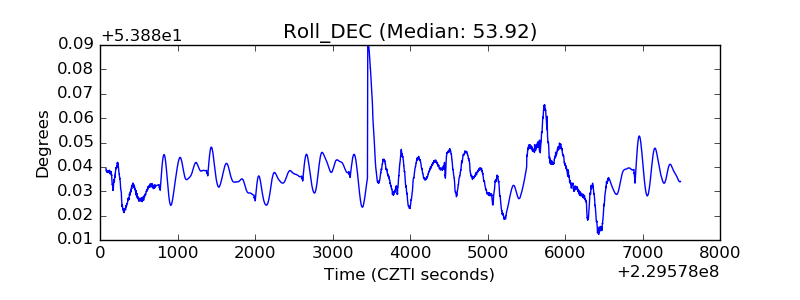 |
| _Roll_RA |  |
| Veto Counter | 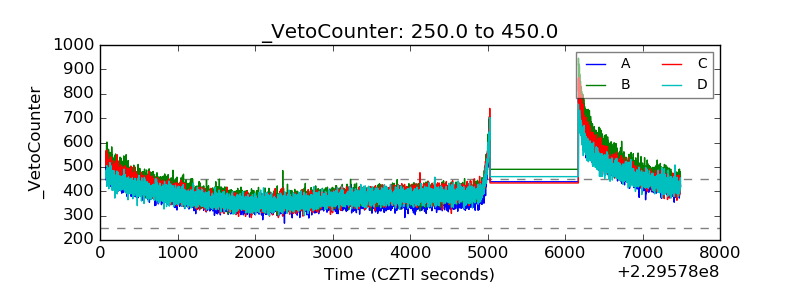 |