| Param | Original file | Final file |
|---|---|---|
| Filename | modeM0/AS1G07_080T03_9000001154_08306cztM0_level2.evt | modeM0/AS1G07_080T03_9000001154_08306cztM0_level2_quad_clean.evt |
| Size (bytes) | 436,017,600 | 75,801,600 |
| Size | 415.8 MB | 72.3 MB |
| Events in quadrant A | 3,171,309 | 470,347 |
| Events in quadrant B | 3,282,370 | 476,484 |
| Events in quadrant C | 3,028,414 | 459,242 |
| Events in quadrant D | 3,288,205 | 443,238 |
| Mode M9 | |||
|---|---|---|---|
| Quadrant | BADHDUFLAG | Total packets | Discarded packets |
| A | 0 | 14 | 0 |
| B | 0 | 14 | 0 |
| C | 0 | 14 | 0 |
| D | 0 | 15 | 0 |
| Mode M0 | |||
|---|---|---|---|
| Quadrant | BADHDUFLAG | Total packets | Discarded packets |
| A | 0 | 13411 | 3 |
| B | 0 | 13649 | 2 |
| C | 0 | 13224 | 4 |
| D | 0 | 13980 | 2 |
| Mode SS | |||
|---|---|---|---|
| Quadrant | BADHDUFLAG | Total packets | Discarded packets |
| A | 0 | 130 | 0 |
| B | 0 | 130 | 0 |
| C | 0 | 130 | 0 |
| D | 0 | 130 | 0 |
| Quadrant | Total seconds | Saturated seconds | Saturation percentage |
|---|---|---|---|
| A | 6391 | 87 | 1.361289% |
| B | 6391 | 95 | 1.486465% |
| C | 6390 | 62 | 0.970266% |
| D | 6391 | 111 | 1.736817% |
Noise dominated data is calculated using 1-second bins in cleaned event files. If a bin has >2000 counts, and if more than 50% of those come from <1% of pixels, then it is considered to be noise-dominated and hence unusable.
| Quadrant | # 1 sec bins | Bins with >0 counts | Bins with >2000 counts | High rate bins dominated by noise | Noise dominated (total time) | Noise dominated (detector-on time) | Marked lightcurve |
|---|---|---|---|---|---|---|---|
| A | 7591 | 6391 | 0 | 0 | 0.00% | 0.00% | 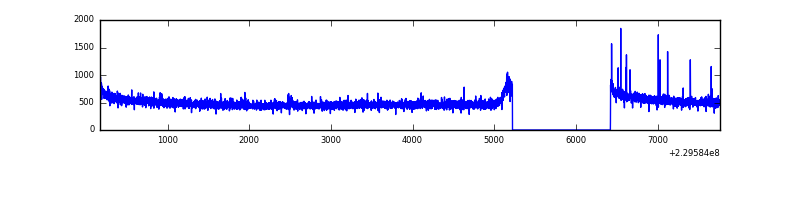 |
| B | 7591 | 6391 | 0 | 0 | 0.00% | 0.00% | 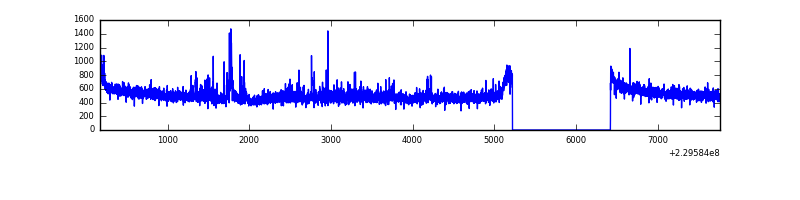 |
| C | 7591 | 6391 | 0 | 0 | 0.00% | 0.00% | 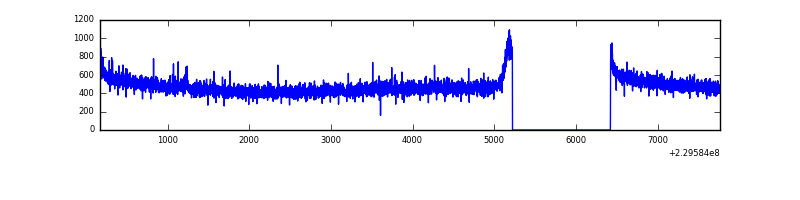 |
| D | 7591 | 6391 | 39 | 39 | 0.51% | 0.61% | 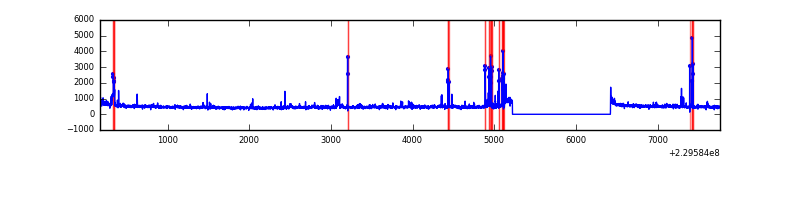 |
Top three noisy pixels from each quadrant. If the there are fewer than three noisy pixels in the level2.evt file, extra rows are filled as -1
| Pixel properties | Quadrant properties | ||||||
|---|---|---|---|---|---|---|---|
| Quadrant | DetID | PixID | Counts | Sigma | Mean | Median | Sigma |
| A | 0 | 23 | 19265 | 112.53 | 812 | 797 | 164.1 |
| A | 15 | 239 | 10467 | 58.92 | 812 | 797 | 164.1 |
| A | 15 | 234 | 10449 | 58.81 | 812 | 797 | 164.1 |
| B | 0 | 214 | 60861 | 391.24 | 811 | 793 | 153.5 |
| B | 4 | 81 | 50164 | 321.57 | 811 | 793 | 153.5 |
| B | 12 | 111 | 15894 | 98.36 | 811 | 793 | 153.5 |
| C | 13 | 61 | 5874 | 28.65 | 774 | 775 | 177.9 |
| C | 9 | 54 | 4864 | 22.98 | 774 | 775 | 177.9 |
| C | 10 | 9 | 3660 | 16.21 | 774 | 775 | 177.9 |
| D | 2 | 14 | 134348 | 678.15 | 772 | 752 | 197.0 |
| D | 12 | 221 | 80538 | 405.01 | 772 | 752 | 197.0 |
| D | 6 | 225 | 36601 | 181.98 | 772 | 752 | 197.0 |
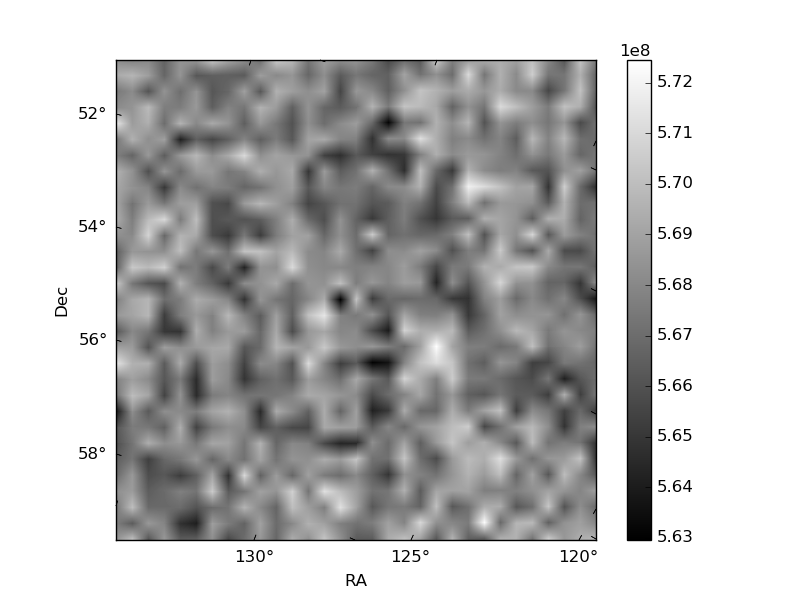
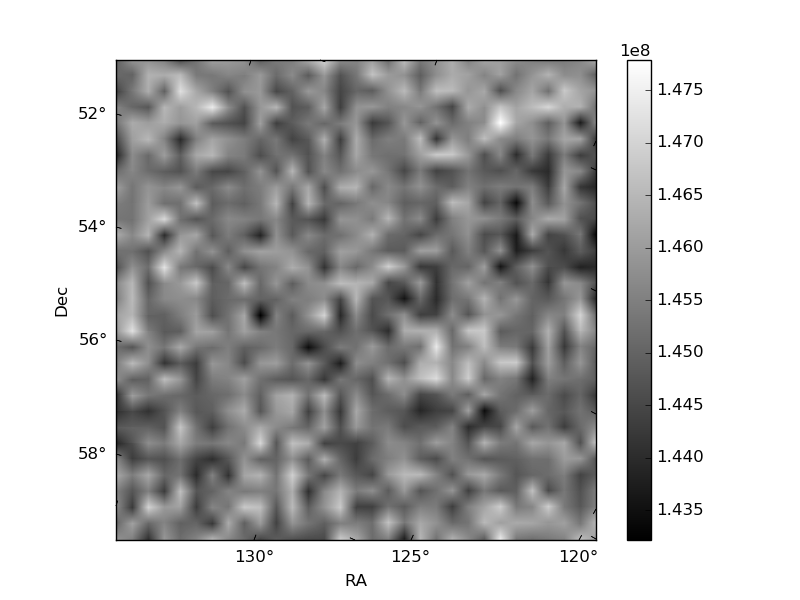
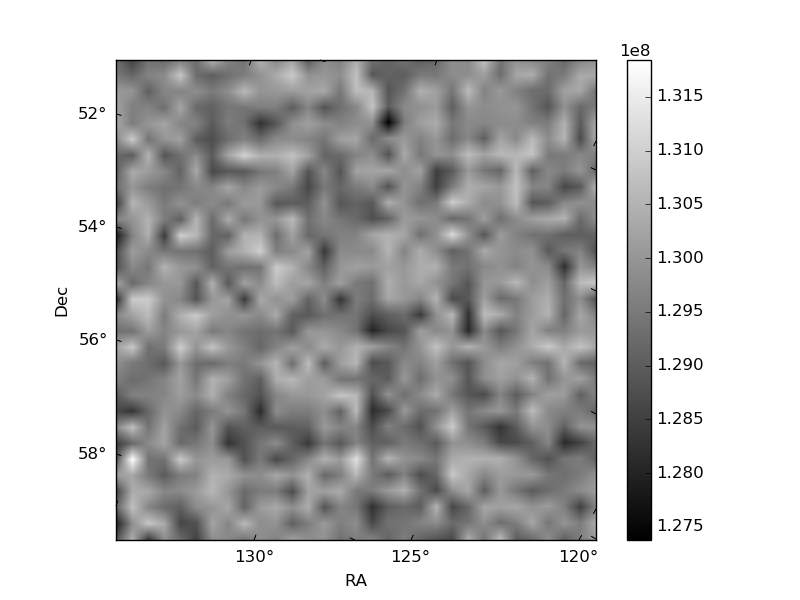
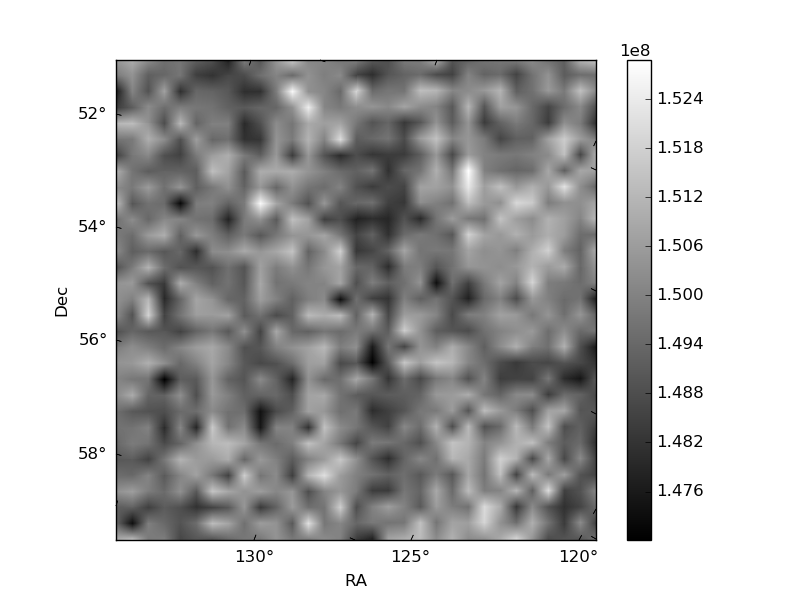
Histogram calculated using DETX and DETY for each event in the final _common_clean file
| Quadrant A | 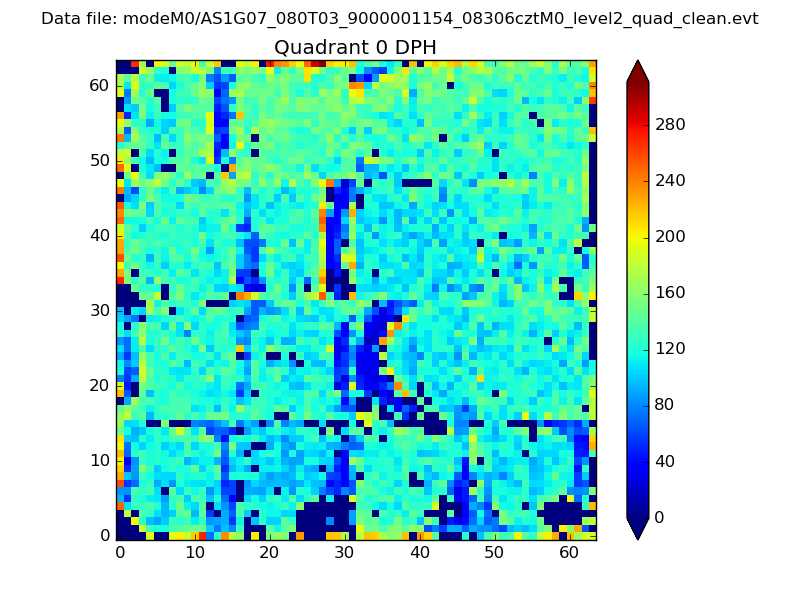 |
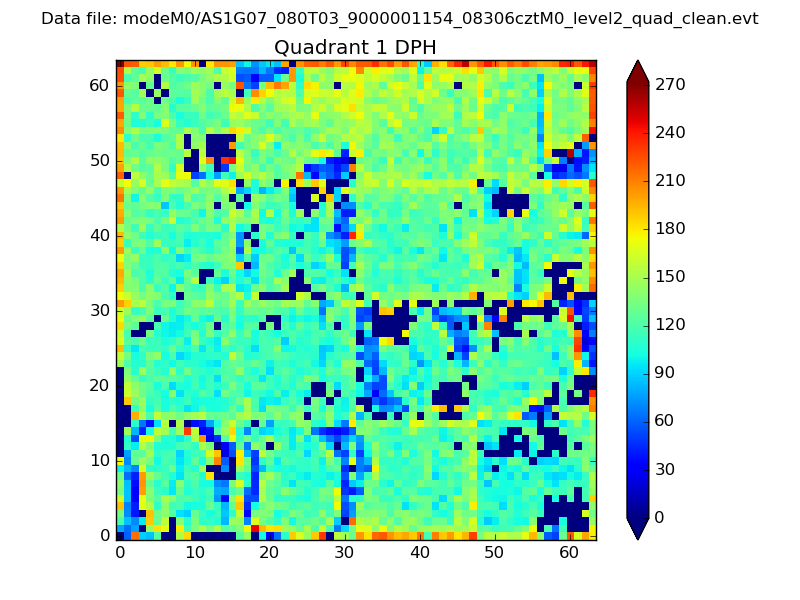 |
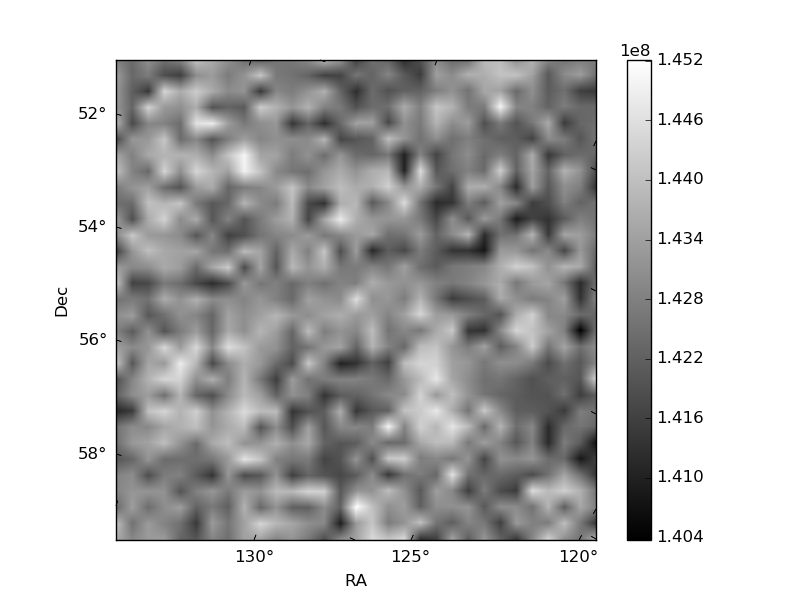
Quadrant B |
|---|---|---|---|
| Quadrant D | 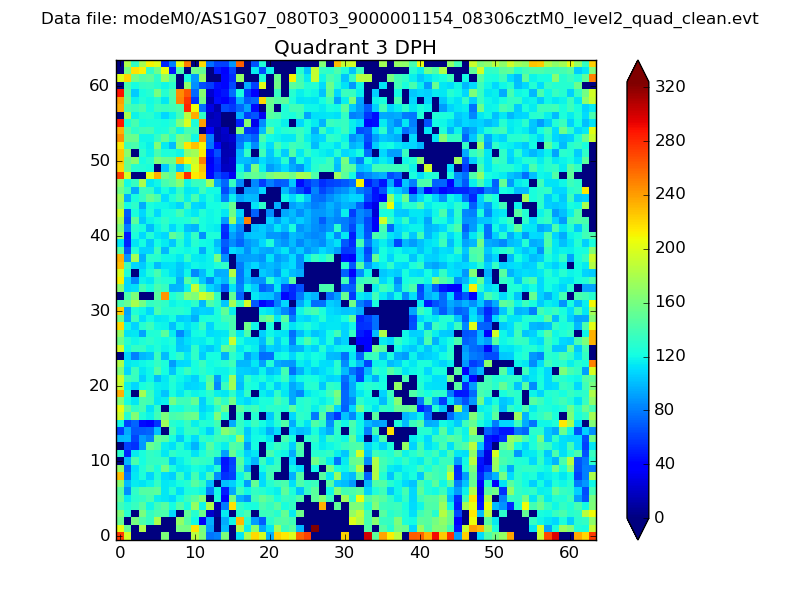 |
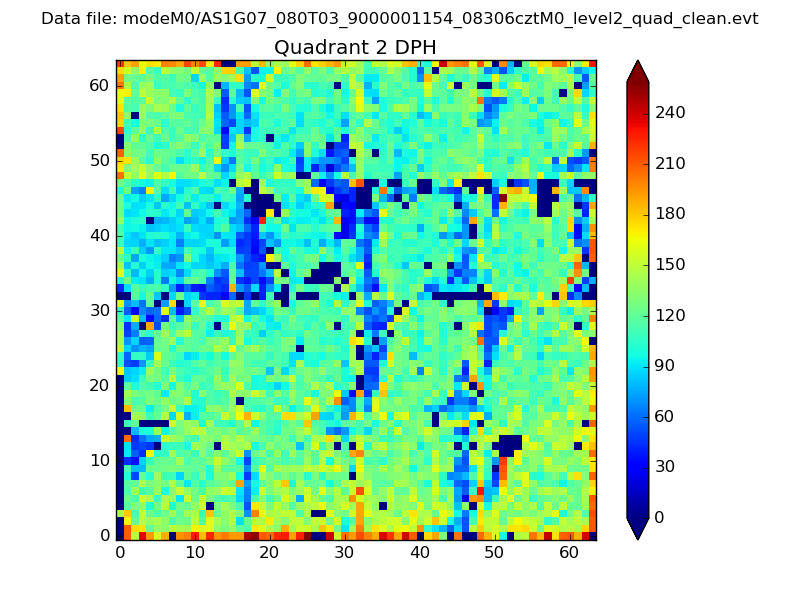 |
Quadrant C |
| Plot type | Count rate plots | Images |
|---|---|---|
| Comparison with Poisson distribution Blue bars denote a histogram of data divided into 1 sec bins. Red curve is a Poisson curve with rate = median count rate of data. |
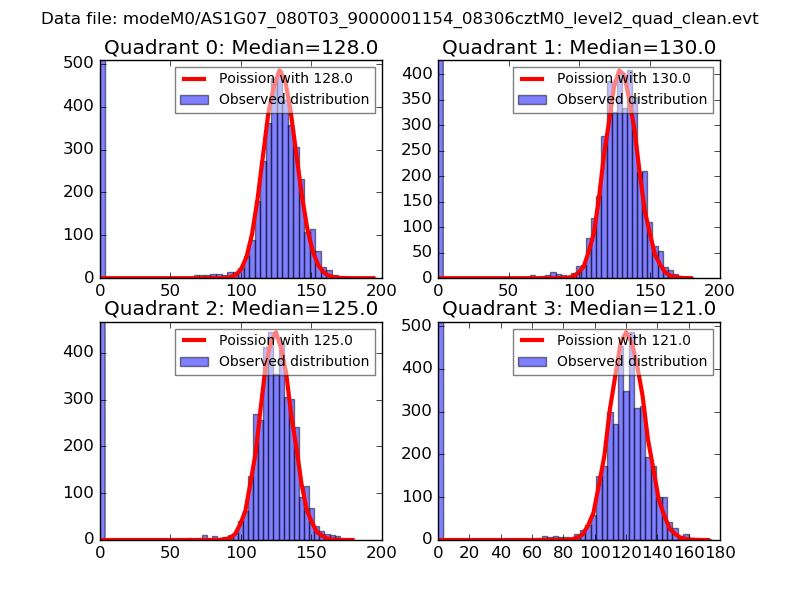 |
 |
| Quadrant-wise count rates Data is divided into 100 sec bins |
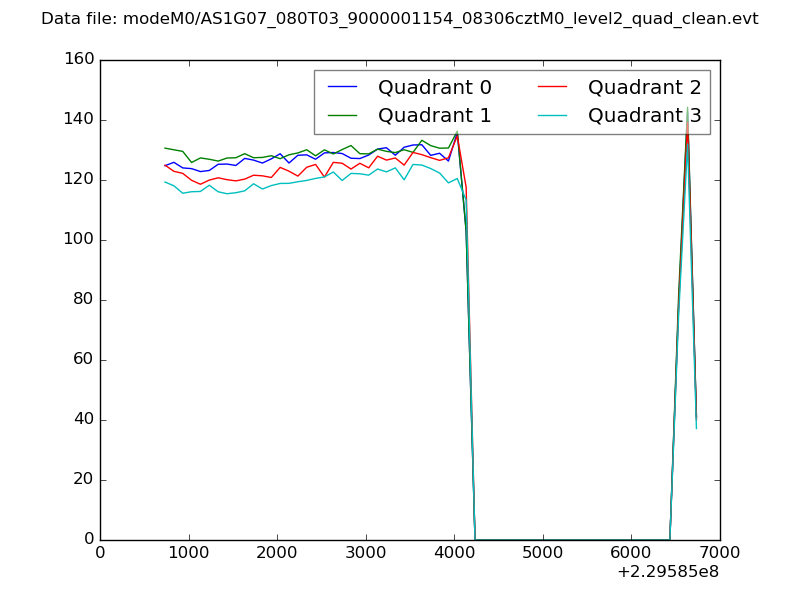 |
|
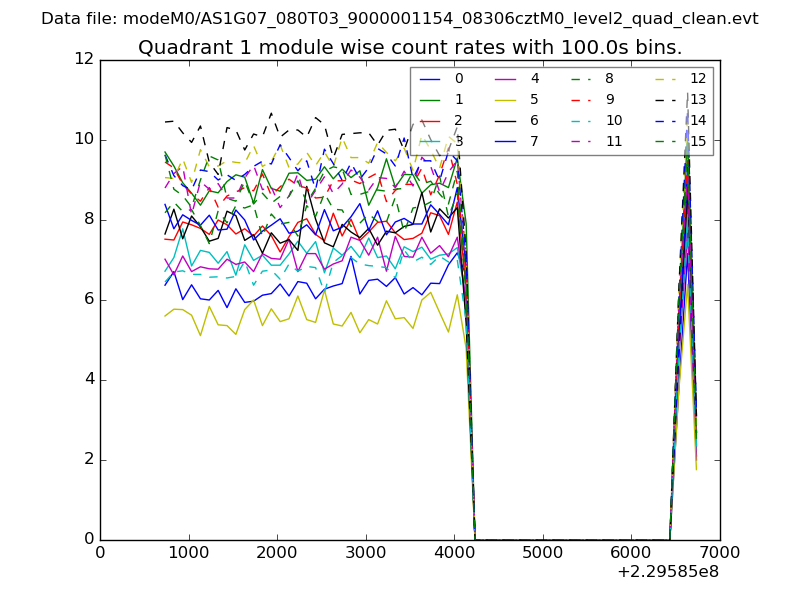
| Module-wise count rates for Quadrant A Data is divided into 100 sec bins |
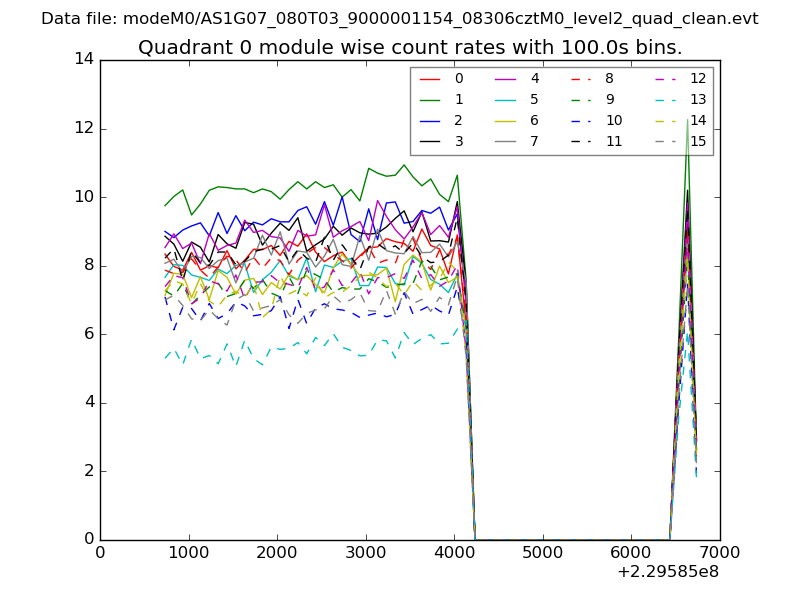 |
 |
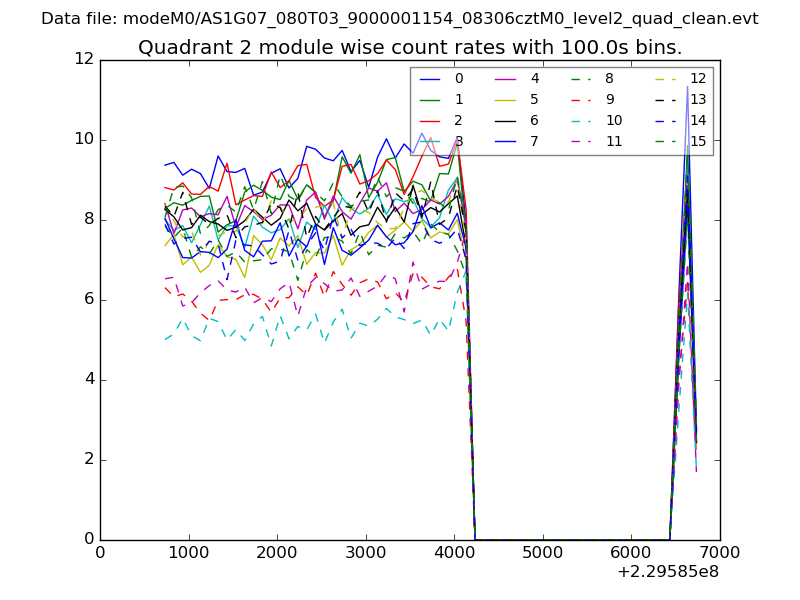
| Module-wise count rates for Quadrant B Data is divided into 100 sec bins |
 |
 |
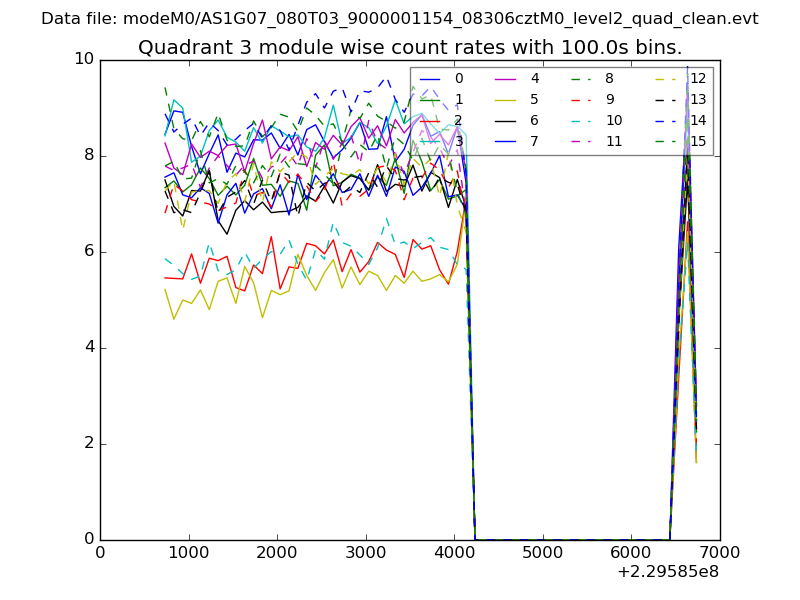
| Module-wise count rates for Quadrant C Data is divided into 100 sec bins |
 |
 |
| Module-wise count rates for Quadrant D Data is divided into 100 sec bins |
 |
 |
| Parameter | Plot |
|---|---|
| CZT HV Monitor | 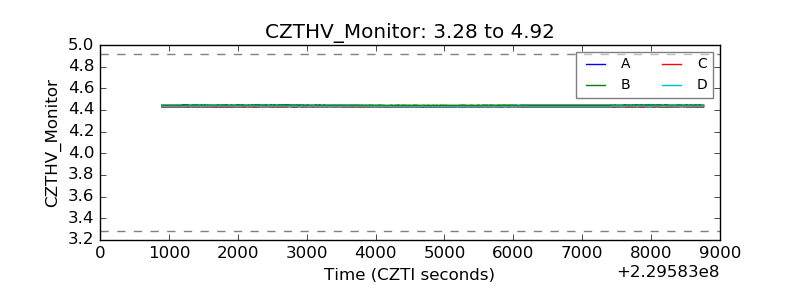 |
| D_VDD | 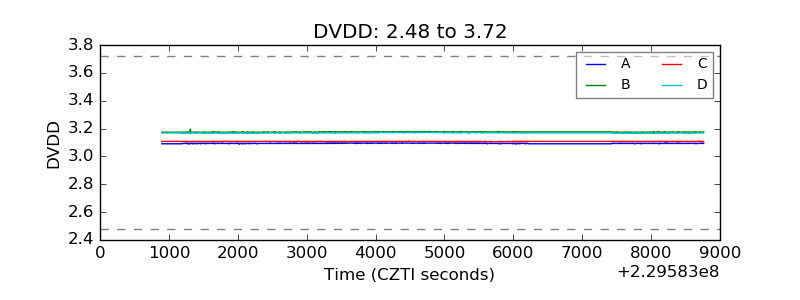 |
| Temperature 1 | 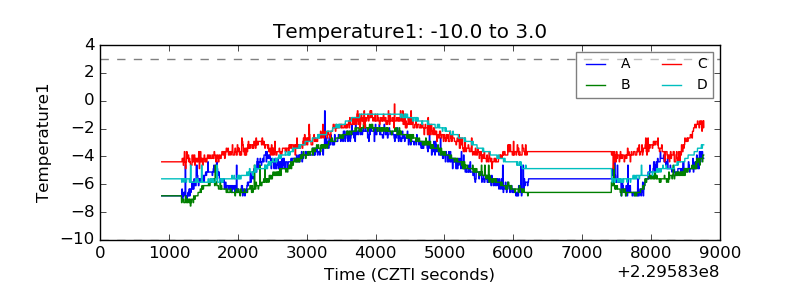 |
| Veto HV Monitor | 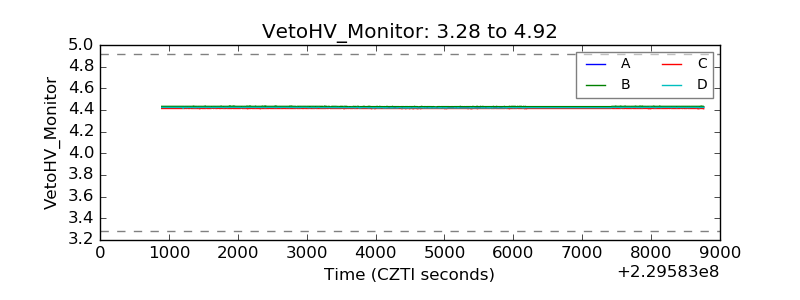 |
| Veto LLD | 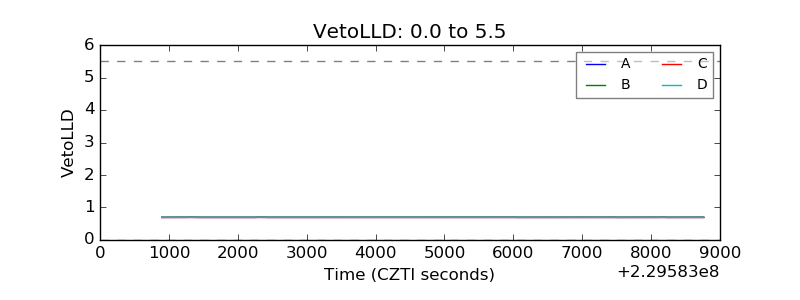 |
| Alpha Counter | 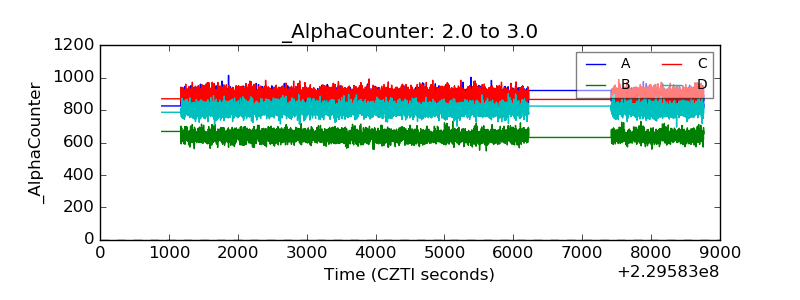 |
| _CPM_Rate | 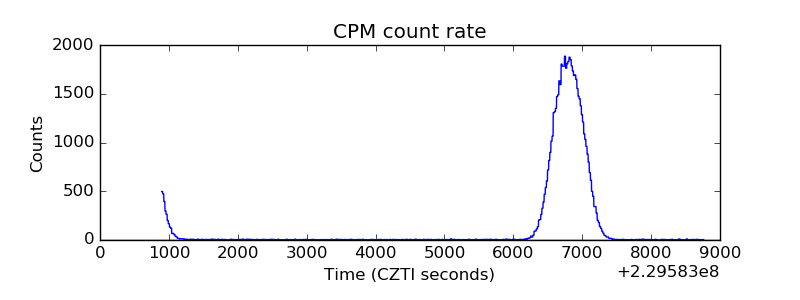 |
| CZT Counter | 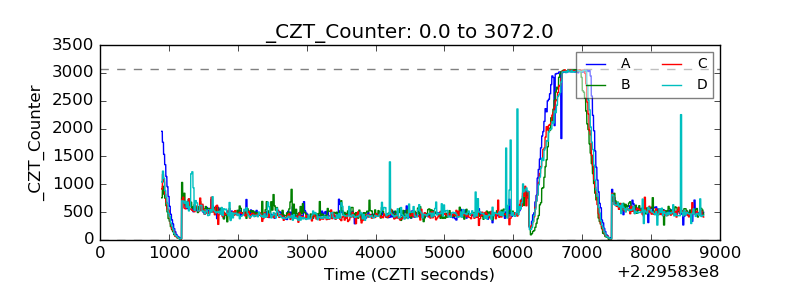 |
| +2.5 Volts monitor |  |
| +5 Volts monitor |  |
| _ROLL_ROT | 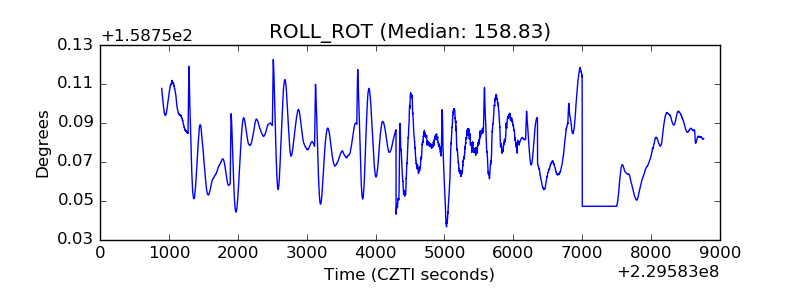 |
| _Roll_DEC | 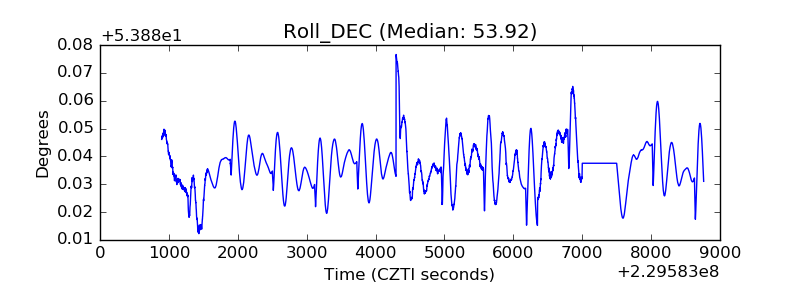 |
| _Roll_RA | 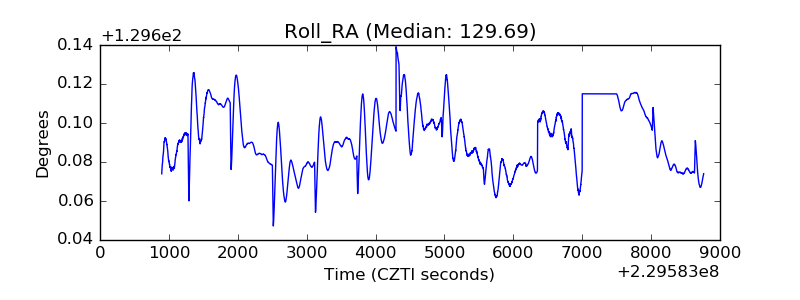 |
| Veto Counter | 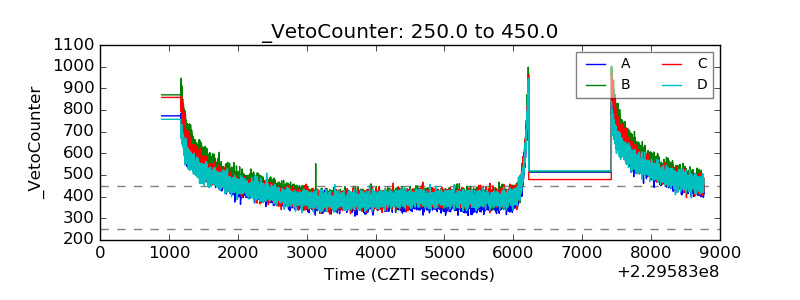 |