| Param | Original file | Final file |
|---|---|---|
| Filename | modeM0/AS1G07_080T03_9000001154_08307cztM0_level2.evt | modeM0/AS1G07_080T03_9000001154_08307cztM0_level2_quad_clean.evt |
| Size (bytes) | 442,834,560 | 92,076,480 |
| Size | 422.3 MB | 87.8 MB |
| Events in quadrant A | 3,200,218 | 599,071 |
| Events in quadrant B | 3,280,981 | 604,633 |
| Events in quadrant C | 3,025,544 | 581,939 |
| Events in quadrant D | 3,477,135 | 563,849 |
| Mode M9 | |||
|---|---|---|---|
| Quadrant | BADHDUFLAG | Total packets | Discarded packets |
| A | 0 | 12 | 0 |
| B | 0 | 12 | 0 |
| C | 0 | 12 | 0 |
| D | 0 | 12 | 0 |
| Mode M0 | |||
|---|---|---|---|
| Quadrant | BADHDUFLAG | Total packets | Discarded packets |
| A | 0 | 13361 | 2 |
| B | 0 | 13463 | 1 |
| C | 0 | 13000 | 1 |
| D | 0 | 14326 | 1 |
| Mode SS | |||
|---|---|---|---|
| Quadrant | BADHDUFLAG | Total packets | Discarded packets |
| A | 0 | 128 | 0 |
| B | 0 | 128 | 0 |
| C | 0 | 128 | 0 |
| D | 0 | 128 | 0 |
| Quadrant | Total seconds | Saturated seconds | Saturation percentage |
|---|---|---|---|
| A | 6286 | 107 | 1.702195% |
| B | 6286 | 113 | 1.797646% |
| C | 6286 | 72 | 1.145402% |
| D | 6286 | 151 | 2.402164% |
Noise dominated data is calculated using 1-second bins in cleaned event files. If a bin has >2000 counts, and if more than 50% of those come from <1% of pixels, then it is considered to be noise-dominated and hence unusable.
| Quadrant | # 1 sec bins | Bins with >0 counts | Bins with >2000 counts | High rate bins dominated by noise | Noise dominated (total time) | Noise dominated (detector-on time) | Marked lightcurve |
|---|---|---|---|---|---|---|---|
| A | 7536 | 6286 | 2 | 2 | 0.03% | 0.03% | 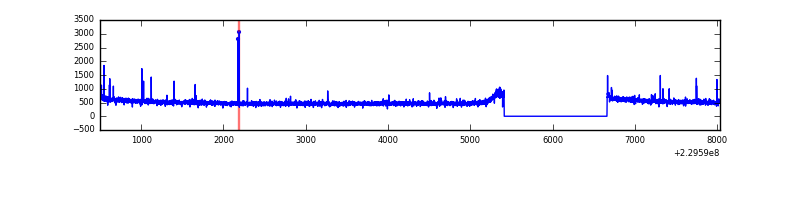 |
| B | 7536 | 6286 | 2 | 2 | 0.03% | 0.03% | 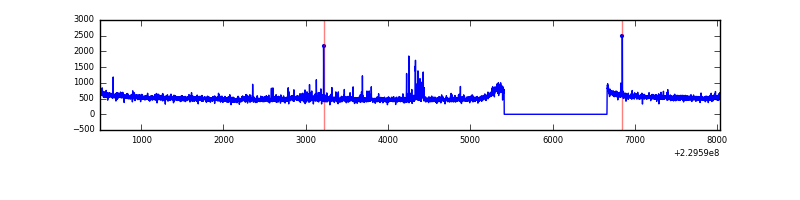 |
| C | 7536 | 6286 | 0 | 0 | 0.00% | 0.00% | 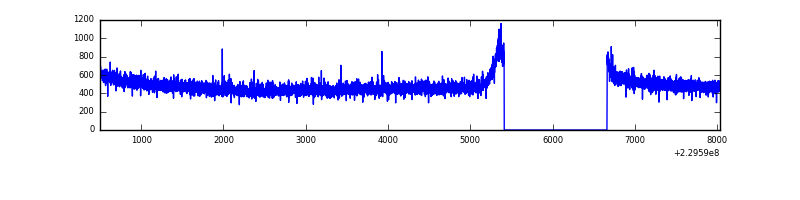 |
| D | 7536 | 6286 | 61 | 61 | 0.81% | 0.97% | 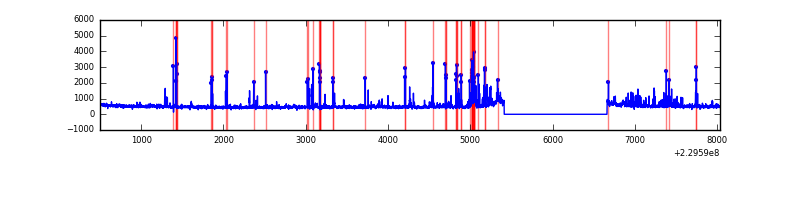 |
Top three noisy pixels from each quadrant. If the there are fewer than three noisy pixels in the level2.evt file, extra rows are filled as -1
| Pixel properties | Quadrant properties | ||||||
|---|---|---|---|---|---|---|---|
| Quadrant | DetID | PixID | Counts | Sigma | Mean | Median | Sigma |
| A | 0 | 23 | 26859 | 159.36 | 816 | 800 | 163.5 |
| A | 15 | 234 | 17259 | 100.65 | 816 | 800 | 163.5 |
| A | 15 | 239 | 10788 | 61.08 | 816 | 800 | 163.5 |
| B | 0 | 214 | 69378 | 452.05 | 811 | 793 | 151.7 |
| B | 0 | 229 | 28578 | 183.13 | 811 | 793 | 151.7 |
| B | 12 | 111 | 15596 | 97.57 | 811 | 793 | 151.7 |
| C | 13 | 61 | 5914 | 29.16 | 774 | 776 | 176.2 |
| C | 9 | 54 | 3628 | 16.19 | 774 | 776 | 176.2 |
| C | 3 | 202 | 1949 | 6.66 | 774 | 776 | 176.2 |
| D | 2 | 14 | 171370 | 879.41 | 778 | 760 | 194.0 |
| D | 6 | 225 | 133746 | 685.47 | 778 | 760 | 194.0 |
| D | 2 | 136 | 44152 | 223.66 | 778 | 760 | 194.0 |
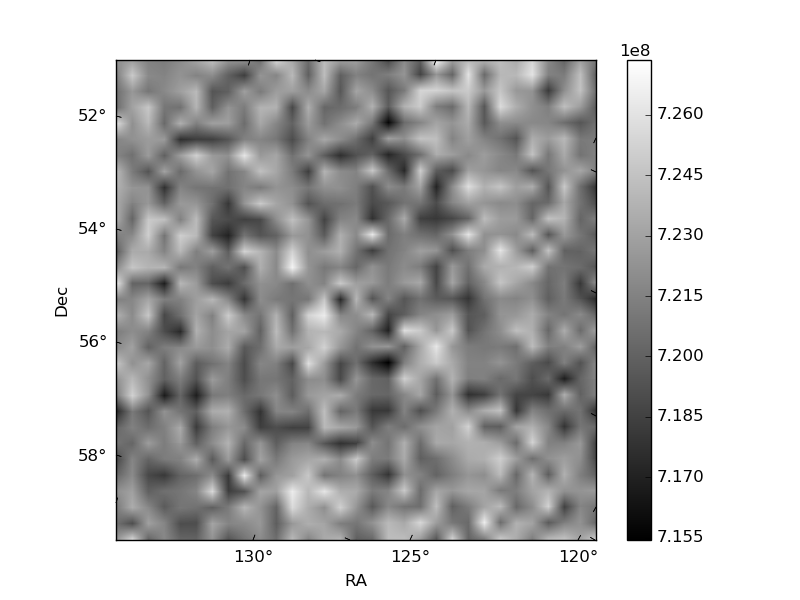
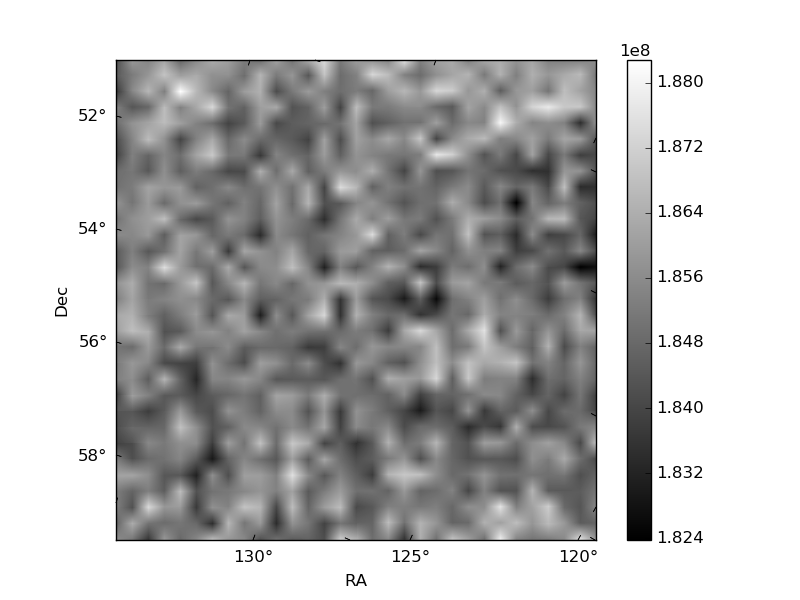
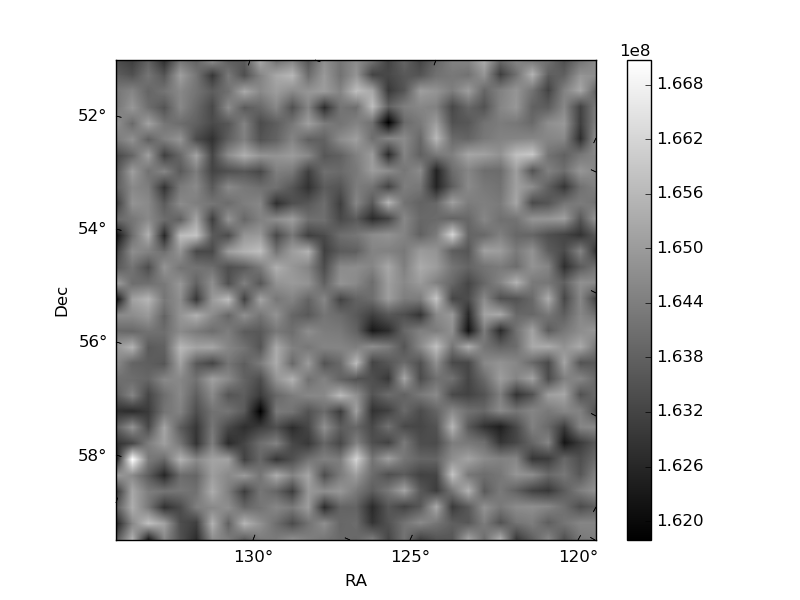
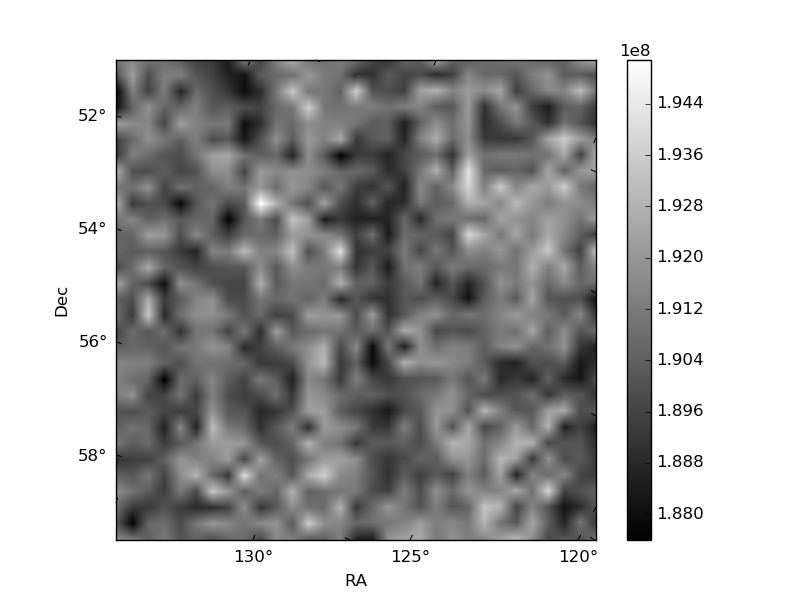
Histogram calculated using DETX and DETY for each event in the final _common_clean file
| Quadrant A | 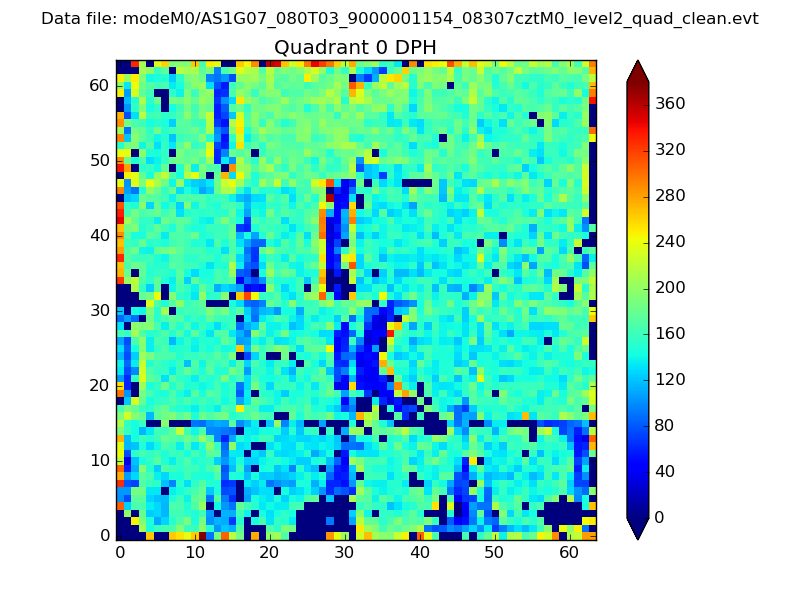 |
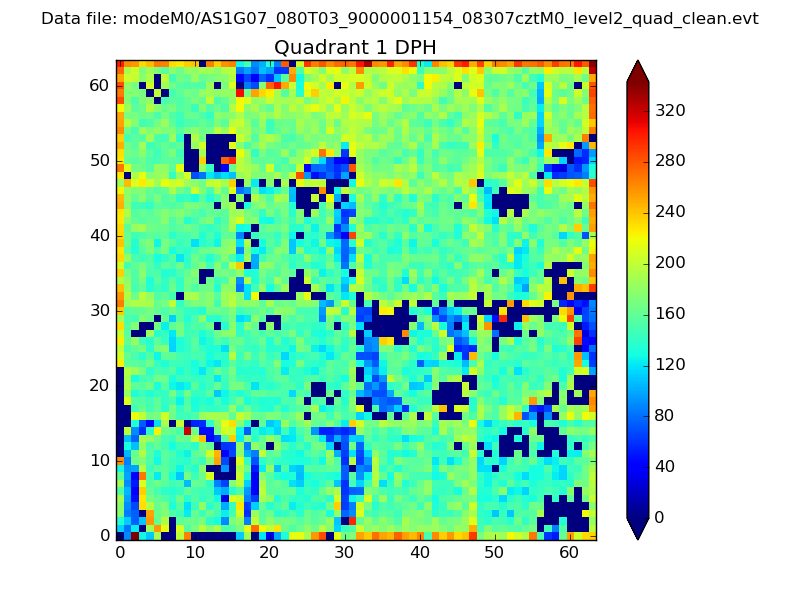 |
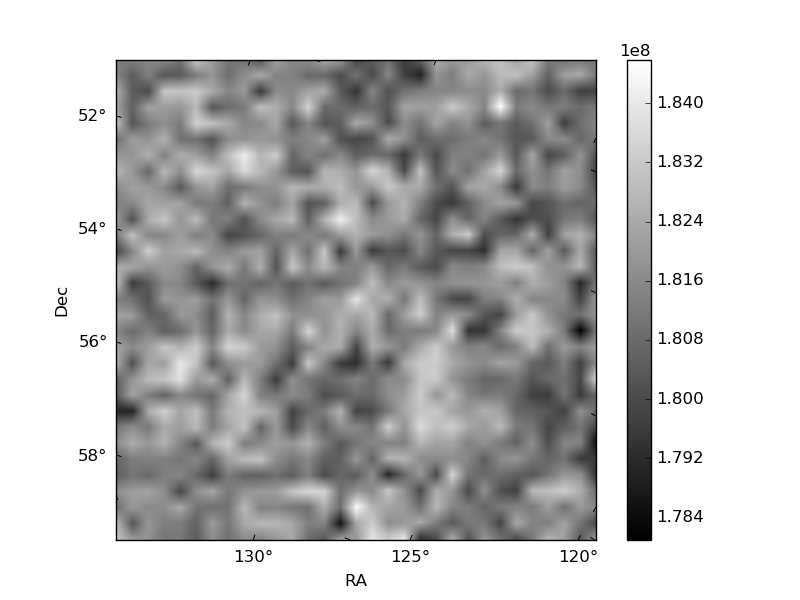
Quadrant B |
|---|---|---|---|
| Quadrant D | 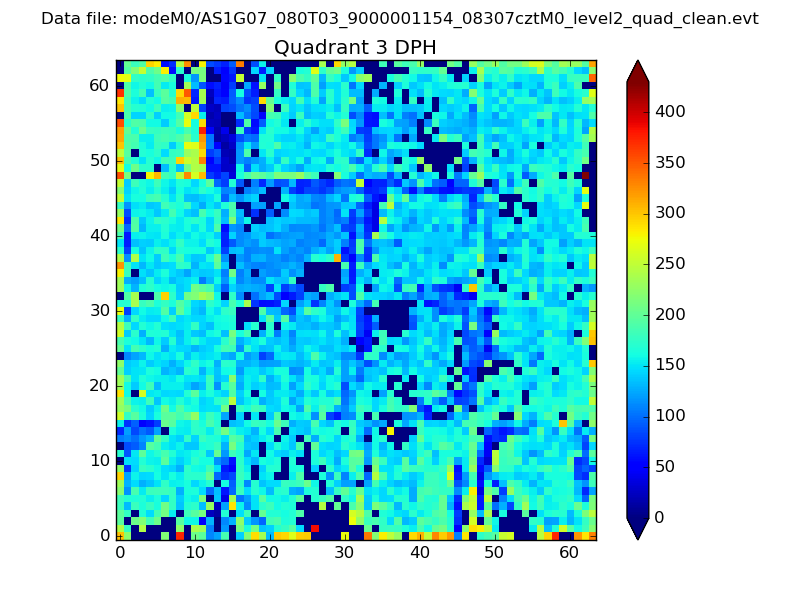 |
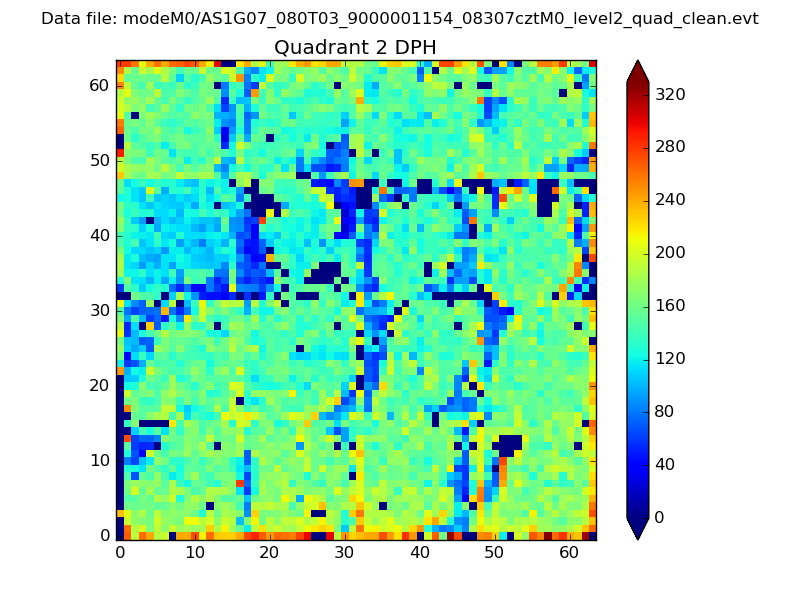 |
Quadrant C |
| Plot type | Count rate plots | Images |
|---|---|---|
| Comparison with Poisson distribution Blue bars denote a histogram of data divided into 1 sec bins. Red curve is a Poisson curve with rate = median count rate of data. |
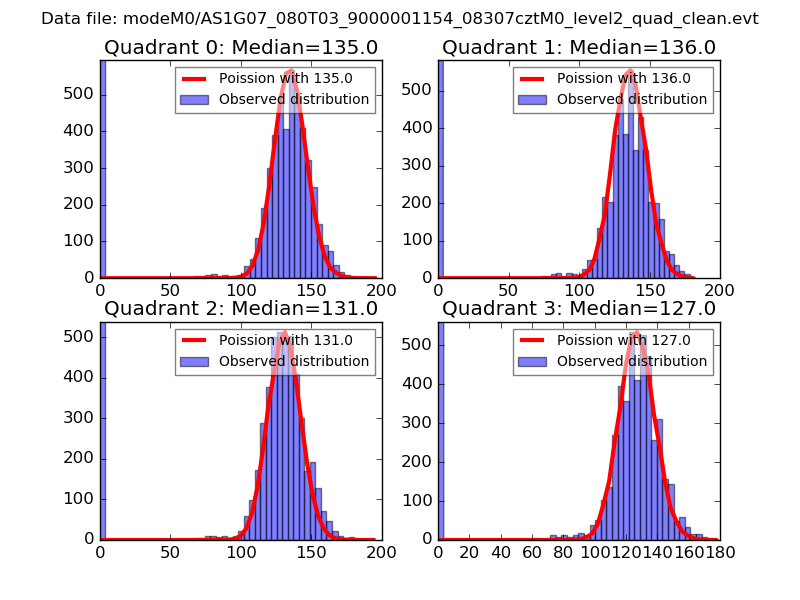 |
 |
| Quadrant-wise count rates Data is divided into 100 sec bins |
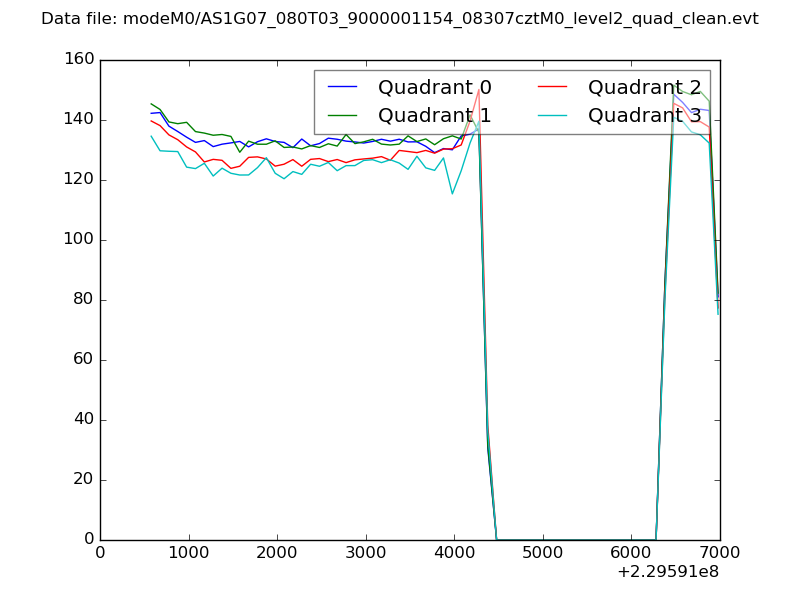 |
|
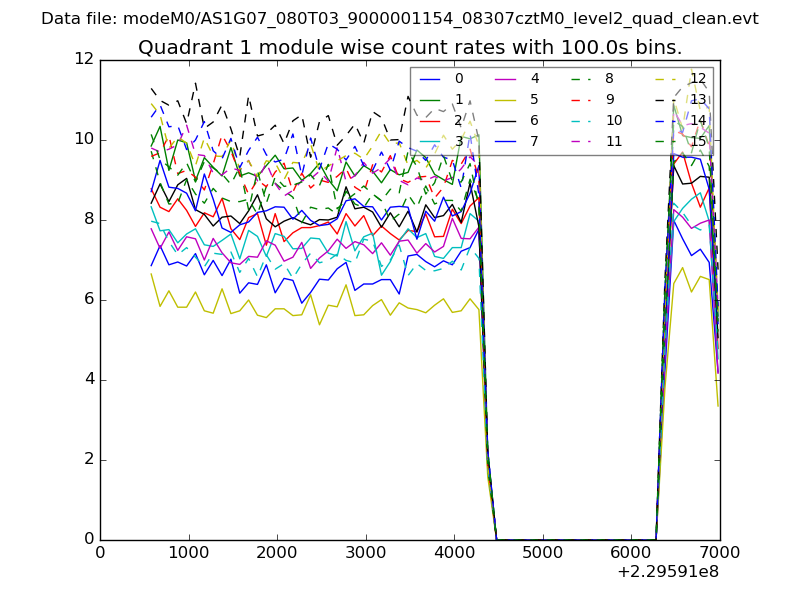
| Module-wise count rates for Quadrant A Data is divided into 100 sec bins |
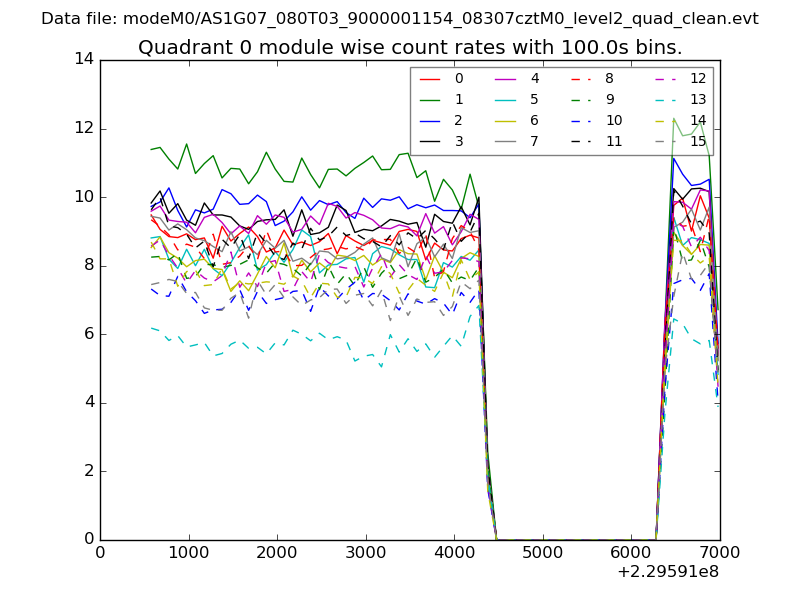 |
 |
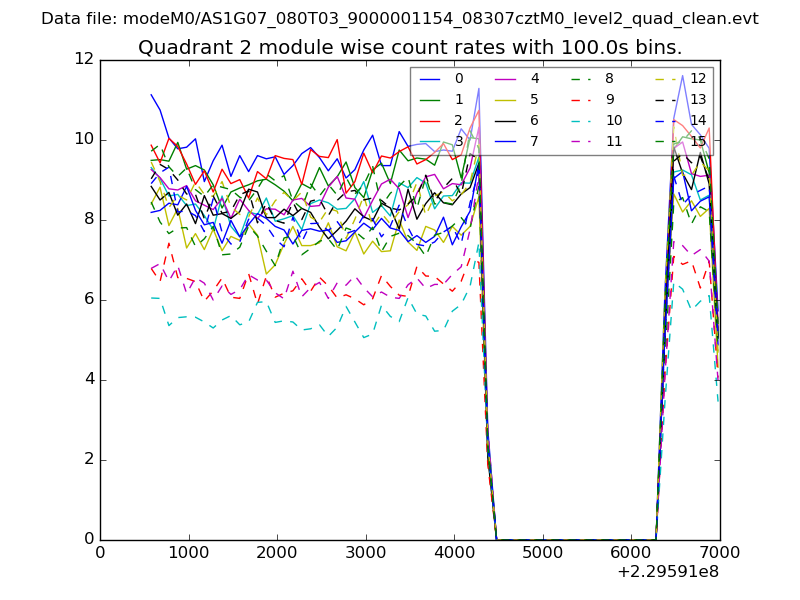
| Module-wise count rates for Quadrant B Data is divided into 100 sec bins |
 |
 |
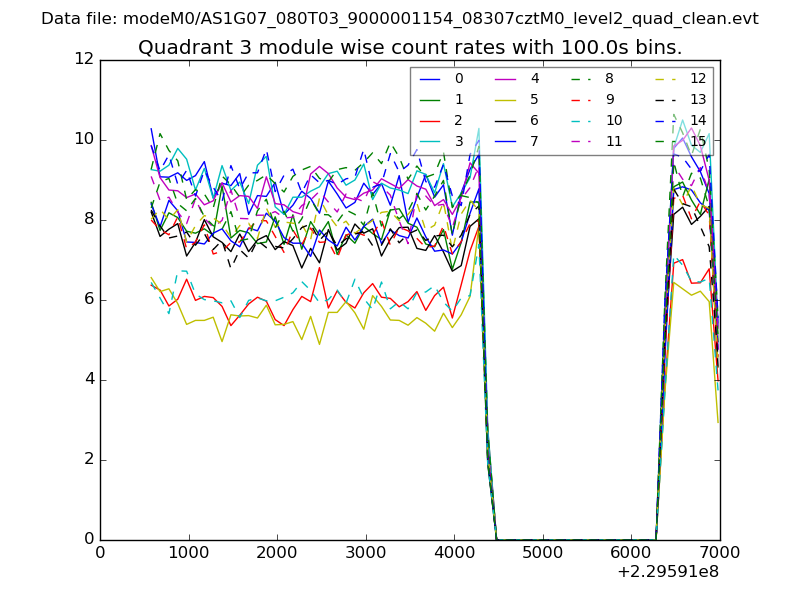
| Module-wise count rates for Quadrant C Data is divided into 100 sec bins |
 |
 |
| Module-wise count rates for Quadrant D Data is divided into 100 sec bins |
 |
 |
| Parameter | Plot |
|---|---|
| CZT HV Monitor | 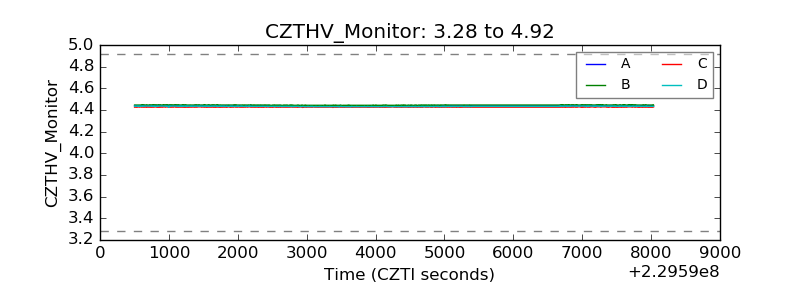 |
| D_VDD | 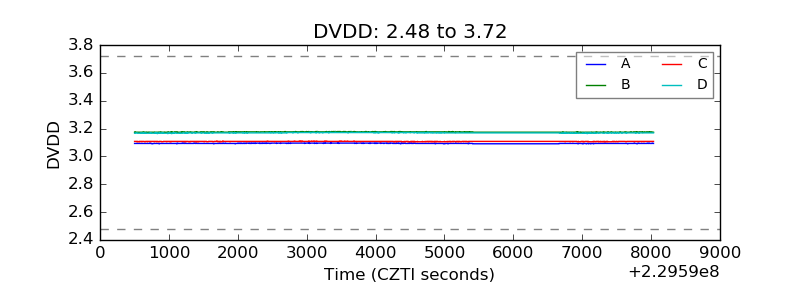 |
| Temperature 1 | 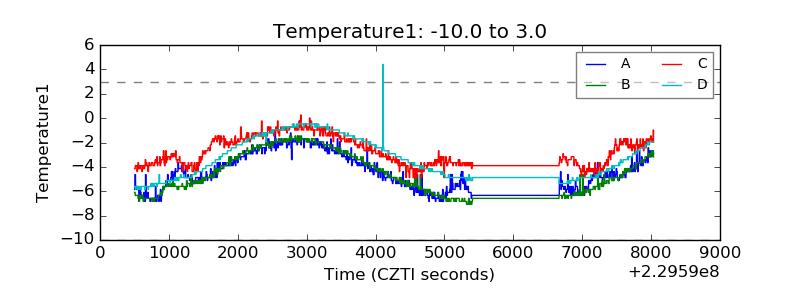 |
| Veto HV Monitor | 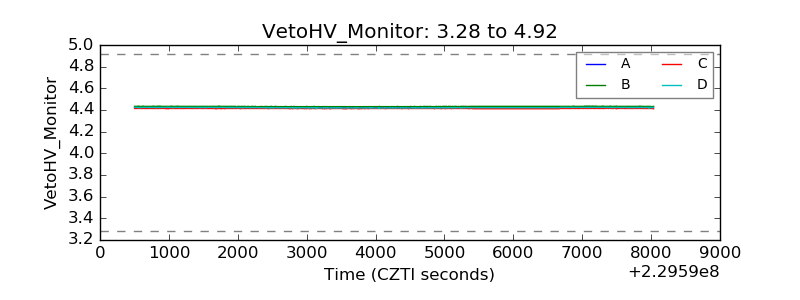 |
| Veto LLD | 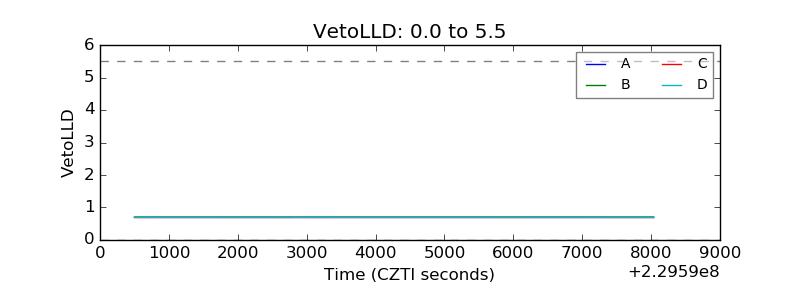 |
| Alpha Counter | 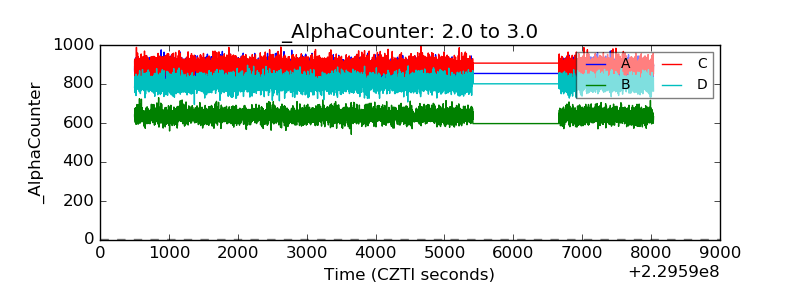 |
| _CPM_Rate | 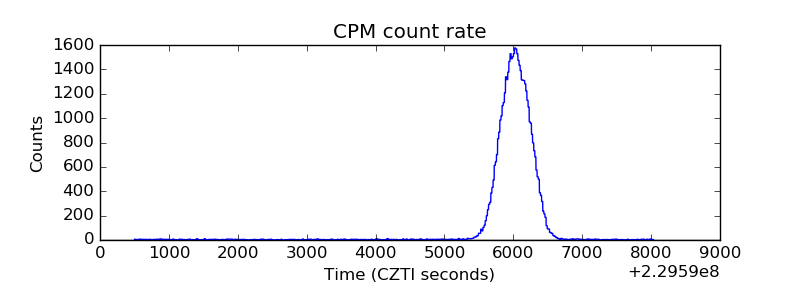 |
| CZT Counter | 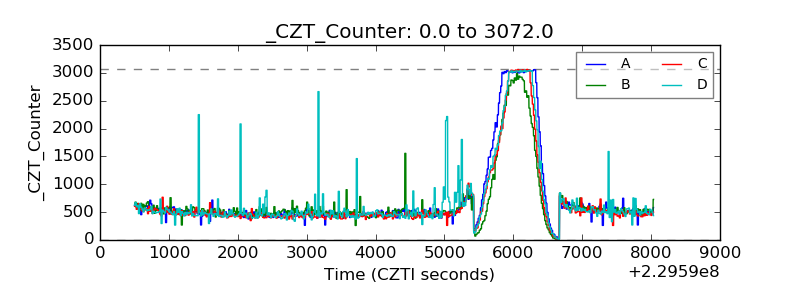 |
| +2.5 Volts monitor |  |
| +5 Volts monitor |  |
| _ROLL_ROT | 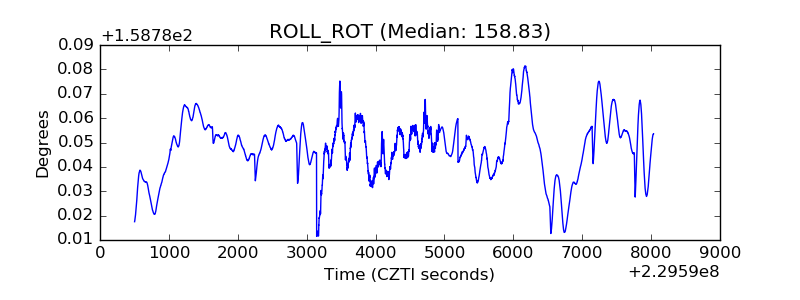 |
| _Roll_DEC | 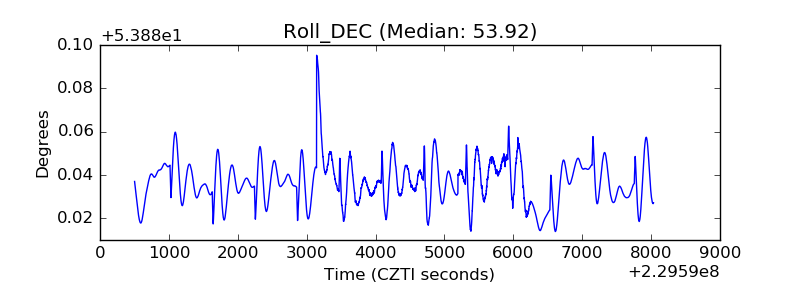 |
| _Roll_RA | 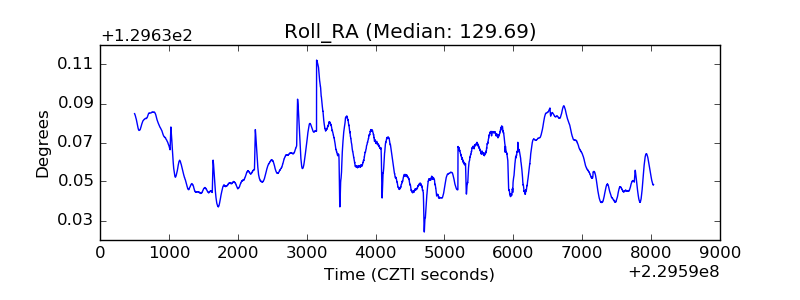 |
| Veto Counter | 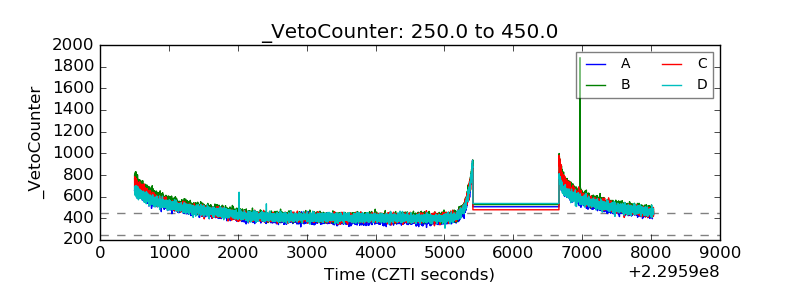 |