| Param | Original file | Final file |
|---|---|---|
| Filename | modeM0/AS1G07_080T03_9000001154_08308cztM0_level2.evt | modeM0/AS1G07_080T03_9000001154_08308cztM0_level2_quad_clean.evt |
| Size (bytes) | 475,269,120 | 100,848,960 |
| Size | 453.3 MB | 96.2 MB |
| Events in quadrant A | 3,793,474 | 665,423 |
| Events in quadrant B | 3,212,032 | 676,043 |
| Events in quadrant C | 3,002,118 | 649,982 |
| Events in quadrant D | 3,959,560 | 624,628 |
| Mode M9 | |||
|---|---|---|---|
| Quadrant | BADHDUFLAG | Total packets | Discarded packets |
| A | 0 | 13 | 0 |
| B | 0 | 13 | 0 |
| C | 0 | 13 | 0 |
| D | 0 | 13 | 0 |
| Mode M0 | |||
|---|---|---|---|
| Quadrant | BADHDUFLAG | Total packets | Discarded packets |
| A | 0 | 15226 | 3 |
| B | 0 | 13337 | 2 |
| C | 0 | 12949 | 2 |
| D | 0 | 15750 | 2 |
| Mode SS | |||
|---|---|---|---|
| Quadrant | BADHDUFLAG | Total packets | Discarded packets |
| A | 0 | 128 | 0 |
| B | 0 | 128 | 0 |
| C | 0 | 128 | 0 |
| D | 0 | 128 | 0 |
| Quadrant | Total seconds | Saturated seconds | Saturation percentage |
|---|---|---|---|
| A | 6276 | 325 | 5.178458% |
| B | 6276 | 111 | 1.768642% |
| C | 6276 | 70 | 1.115360% |
| D | 6276 | 209 | 3.330147% |
Noise dominated data is calculated using 1-second bins in cleaned event files. If a bin has >2000 counts, and if more than 50% of those come from <1% of pixels, then it is considered to be noise-dominated and hence unusable.
| Quadrant | # 1 sec bins | Bins with >0 counts | Bins with >2000 counts | High rate bins dominated by noise | Noise dominated (total time) | Noise dominated (detector-on time) | Marked lightcurve |
|---|---|---|---|---|---|---|---|
| A | 7556 | 6276 | 160 | 160 | 2.12% | 2.55% | 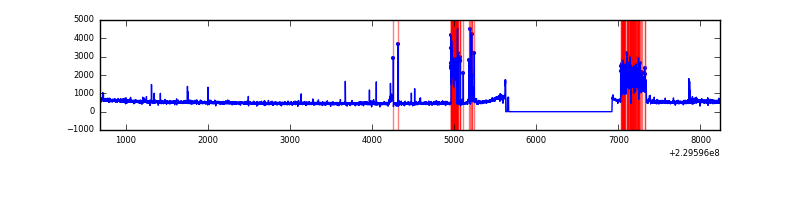 |
| B | 7556 | 6276 | 4 | 4 | 0.05% | 0.06% | 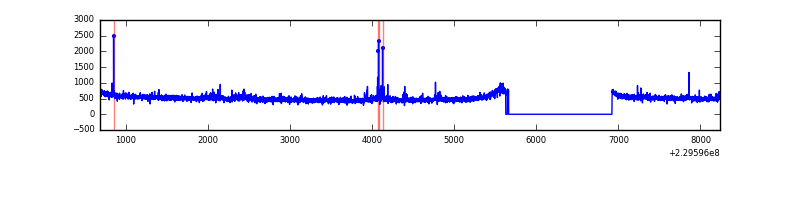 |
| C | 7556 | 6276 | 0 | 0 | 0.00% | 0.00% | 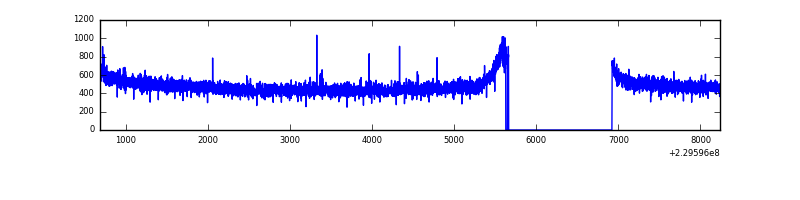 |
| D | 7556 | 6277 | 136 | 136 | 1.80% | 2.17% | 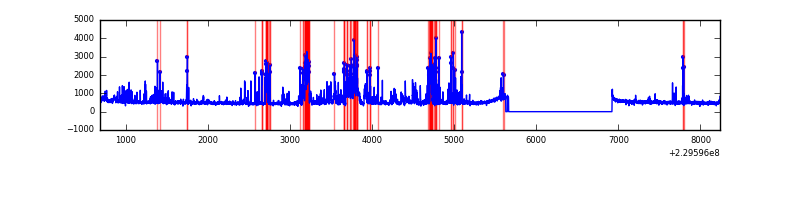 |
Top three noisy pixels from each quadrant. If the there are fewer than three noisy pixels in the level2.evt file, extra rows are filled as -1
| Pixel properties | Quadrant properties | ||||||
|---|---|---|---|---|---|---|---|
| Quadrant | DetID | PixID | Counts | Sigma | Mean | Median | Sigma |
| A | 0 | 23 | 608665 | 3823.44 | 799 | 782 | 159.0 |
| A | 0 | 226 | 49432 | 305.99 | 799 | 782 | 159.0 |
| A | 15 | 234 | 33070 | 203.08 | 799 | 782 | 159.0 |
| B | 0 | 214 | 57416 | 377.42 | 803 | 786 | 150.0 |
| B | 0 | 229 | 18555 | 118.43 | 803 | 786 | 150.0 |
| B | 12 | 111 | 15345 | 97.03 | 803 | 786 | 150.0 |
| C | 13 | 61 | 5826 | 28.89 | 768 | 771 | 175.0 |
| C | 9 | 54 | 5040 | 24.4 | 768 | 771 | 175.0 |
| C | 3 | 202 | 1885 | 6.37 | 768 | 771 | 175.0 |
| D | 6 | 225 | 573718 | 2791.86 | 769 | 751 | 205.2 |
| D | 2 | 14 | 163650 | 793.75 | 769 | 751 | 205.2 |
| D | 13 | 105 | 146296 | 709.19 | 769 | 751 | 205.2 |
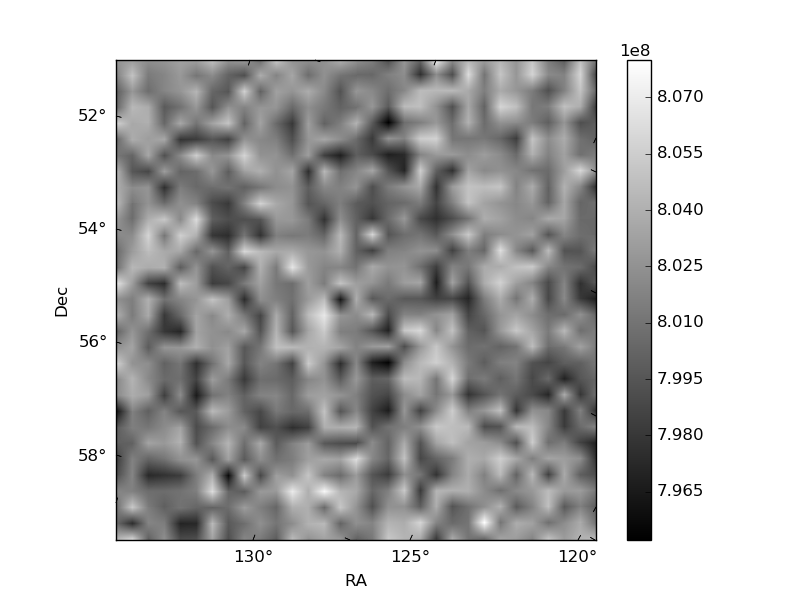
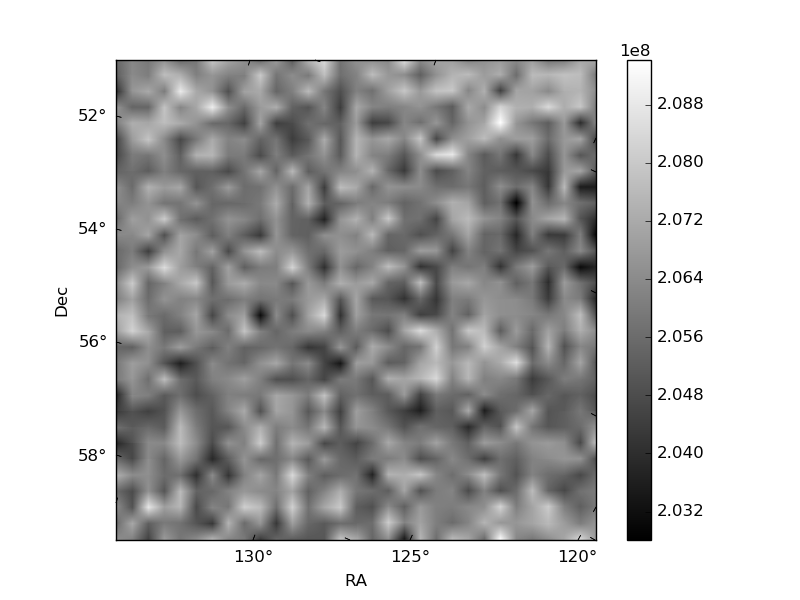
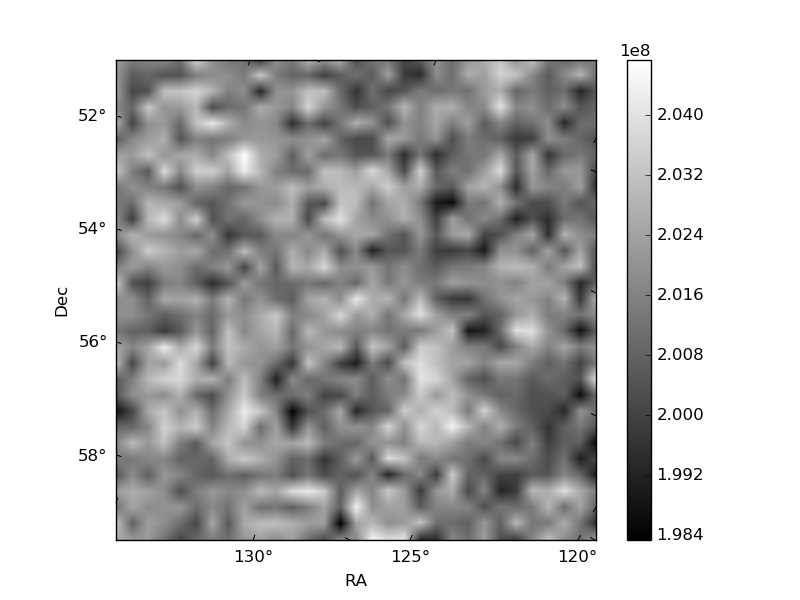
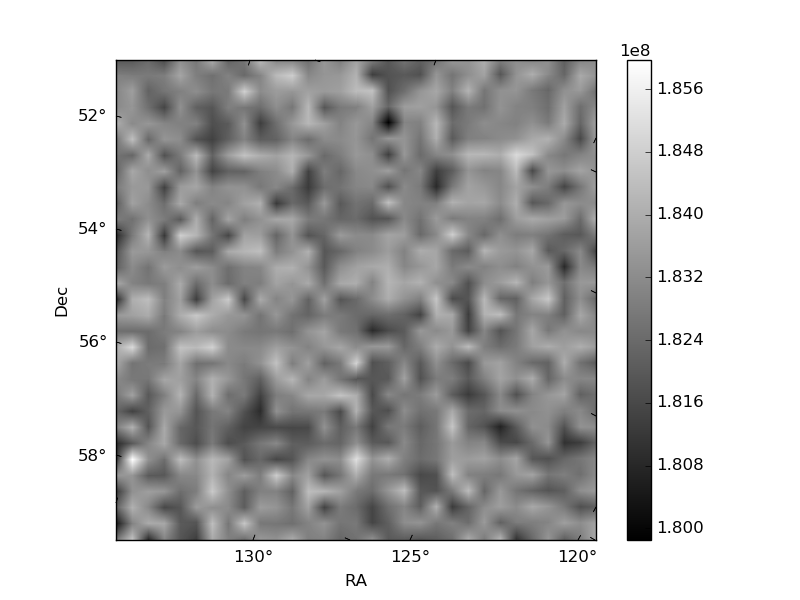
Histogram calculated using DETX and DETY for each event in the final _common_clean file
| Quadrant A | 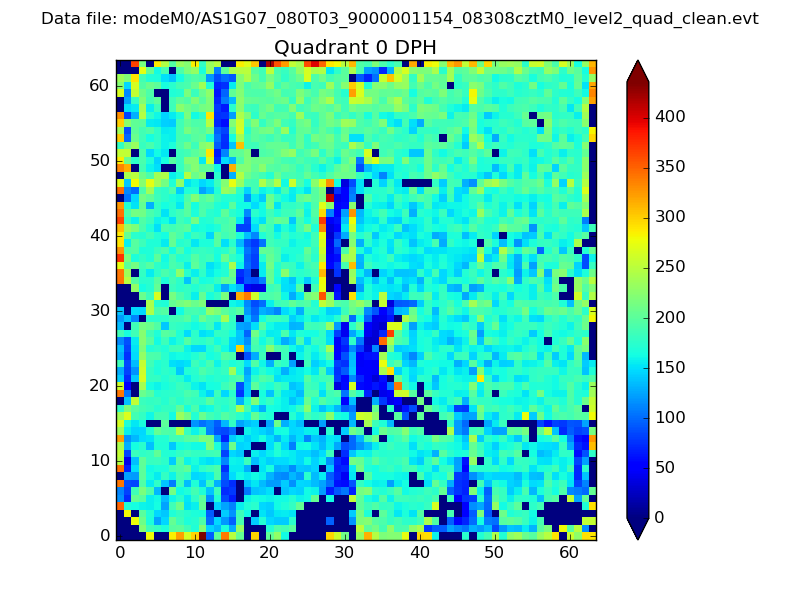 |
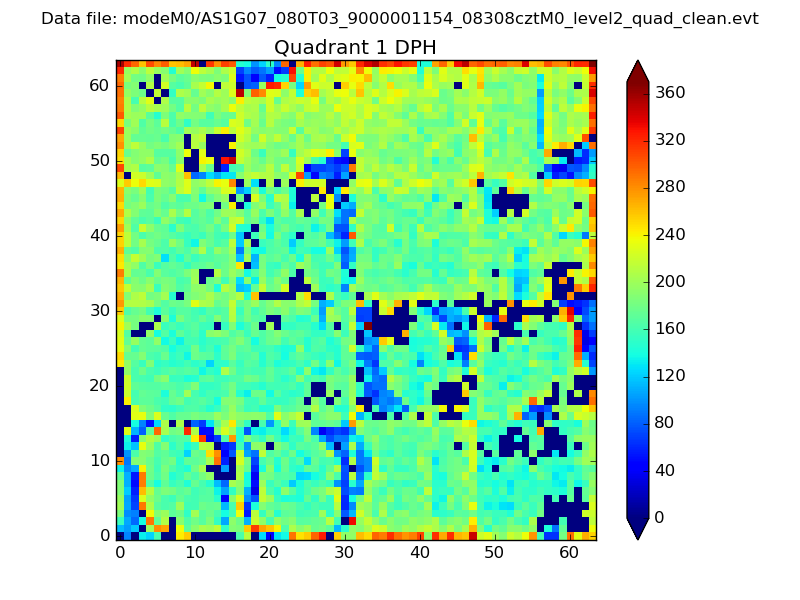 |
Quadrant B |
|---|---|---|---|
| Quadrant D |  |
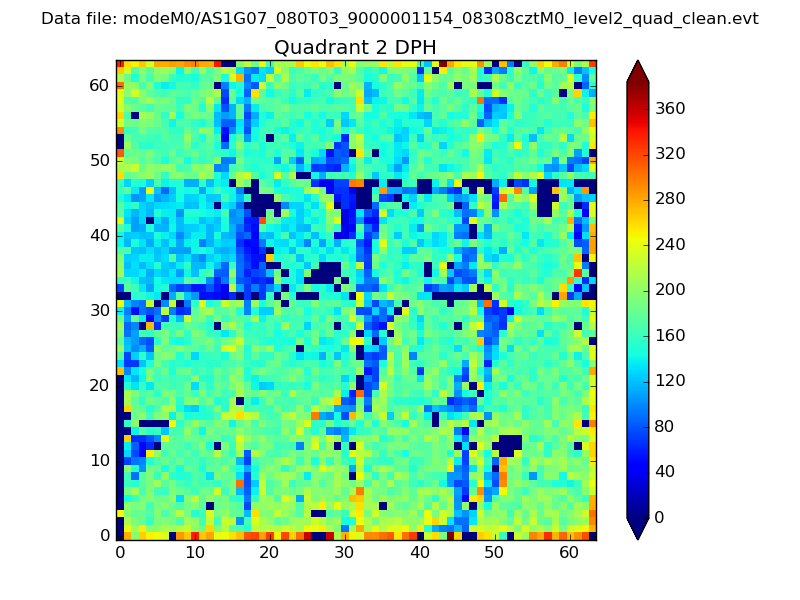 |
Quadrant C |
| Plot type | Count rate plots | Images |
|---|---|---|
| Comparison with Poisson distribution Blue bars denote a histogram of data divided into 1 sec bins. Red curve is a Poisson curve with rate = median count rate of data. |
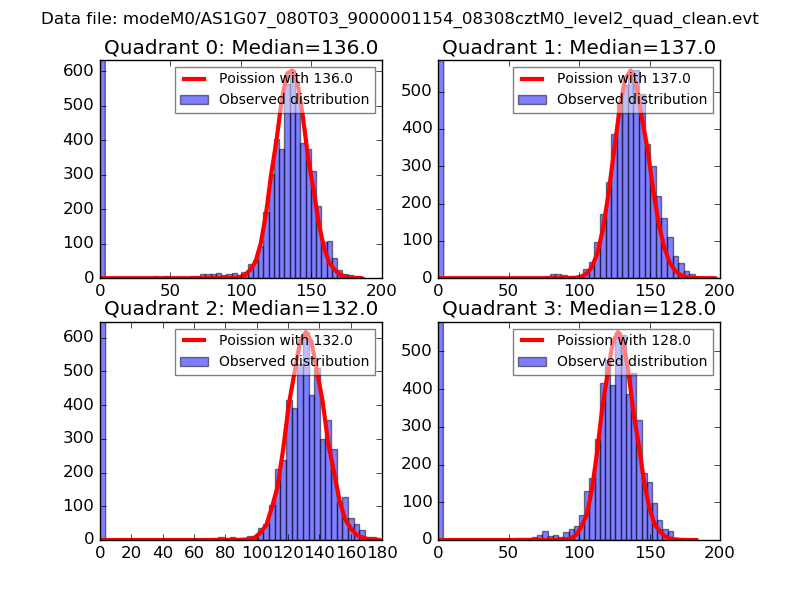 |
 |
| Quadrant-wise count rates Data is divided into 100 sec bins |
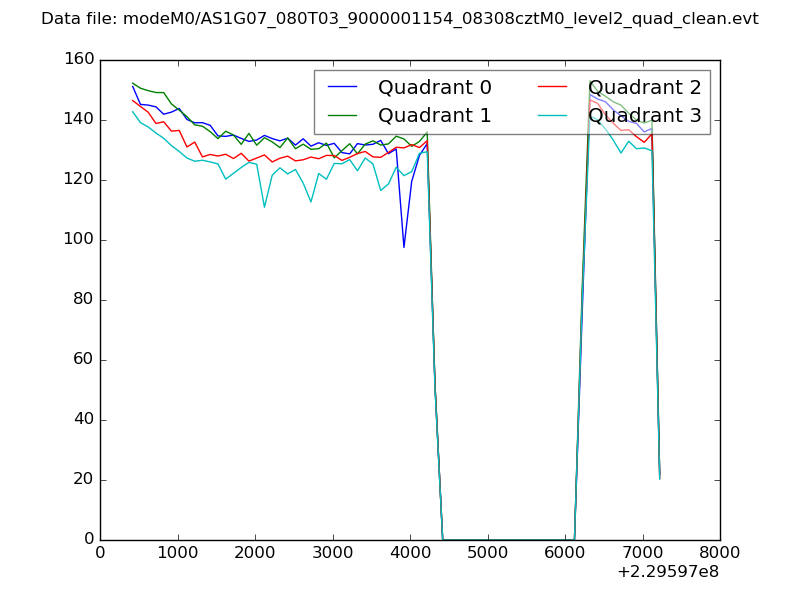 |
|
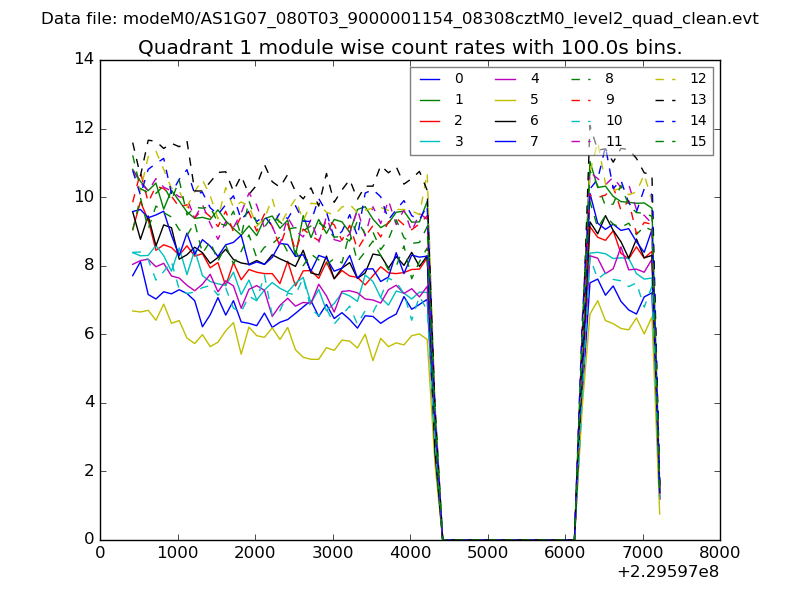
| Module-wise count rates for Quadrant A Data is divided into 100 sec bins |
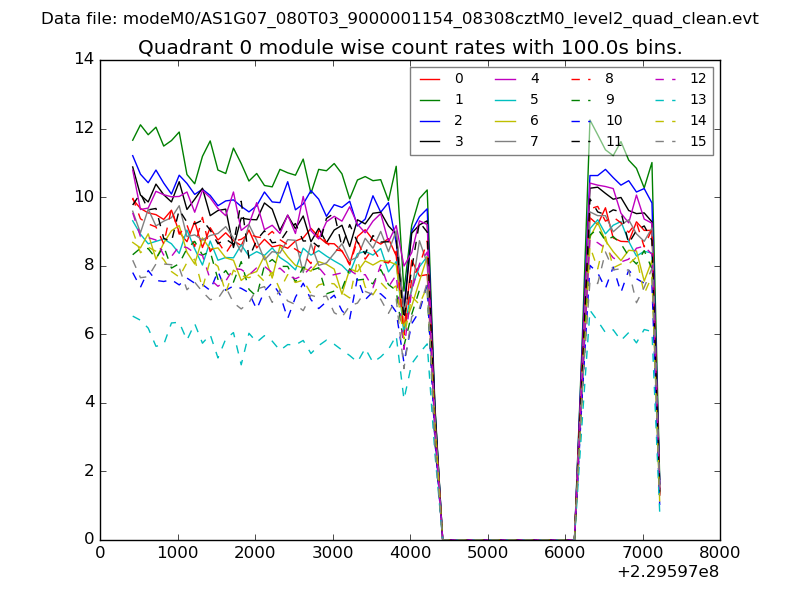 |
 |
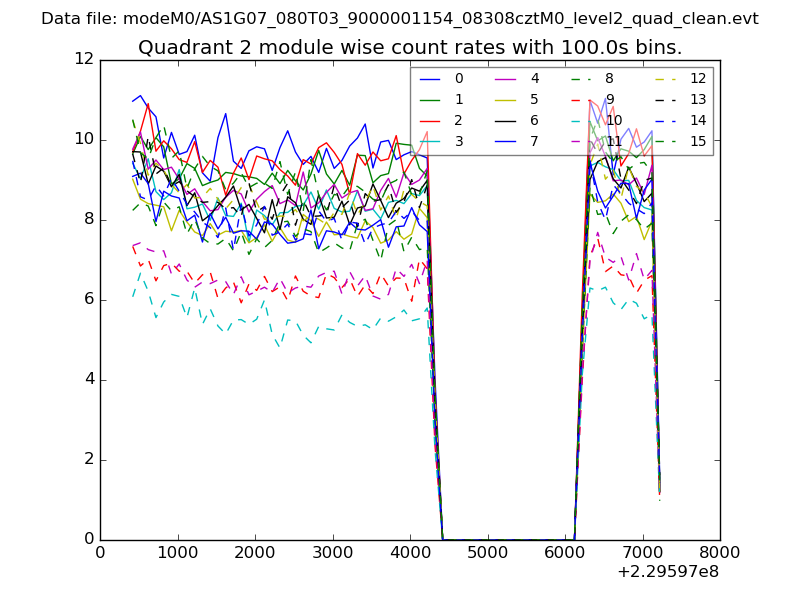
| Module-wise count rates for Quadrant B Data is divided into 100 sec bins |
 |
 |
| Module-wise count rates for Quadrant C Data is divided into 100 sec bins |
 |
 |
| Module-wise count rates for Quadrant D Data is divided into 100 sec bins |
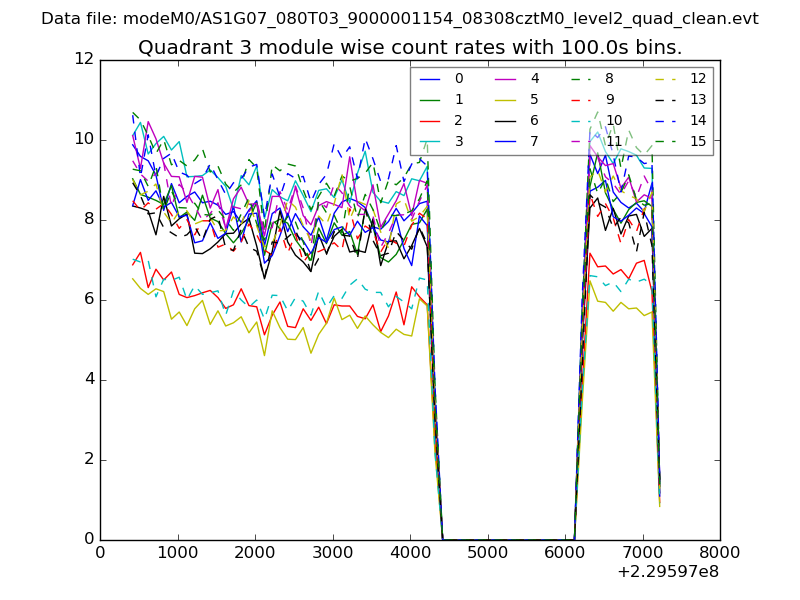 |
 |
| Parameter | Plot |
|---|---|
| CZT HV Monitor | 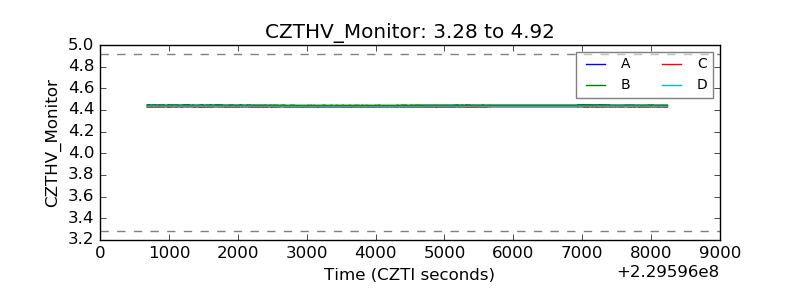 |
| D_VDD | 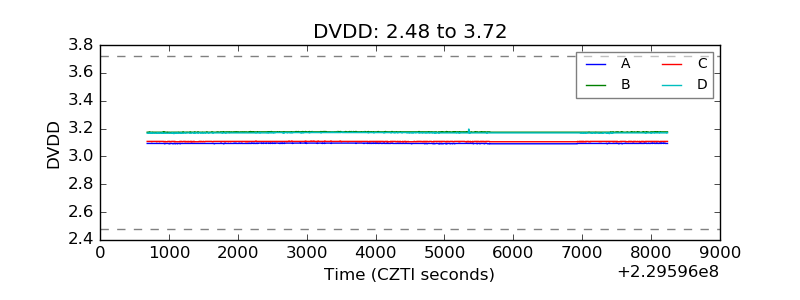 |
| Temperature 1 | 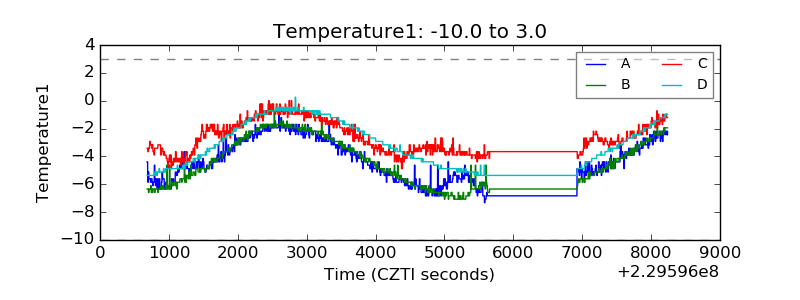 |
| Veto HV Monitor | 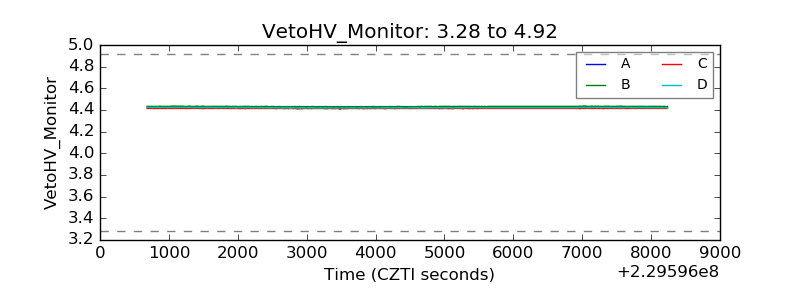 |
| Veto LLD | 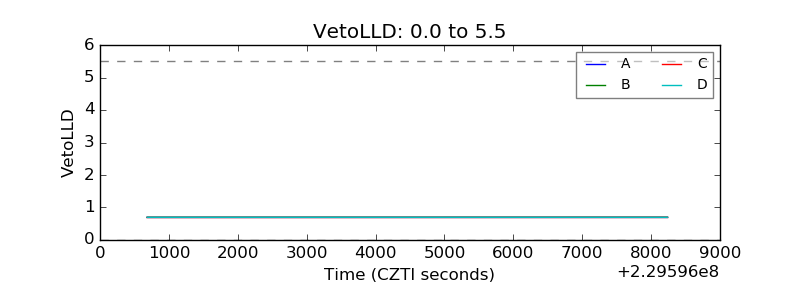 |
| Alpha Counter | 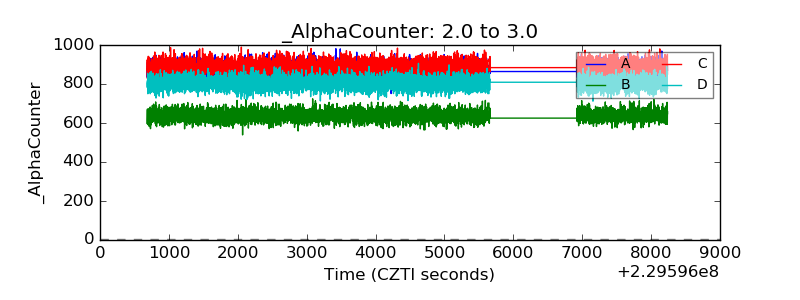 |
| _CPM_Rate | 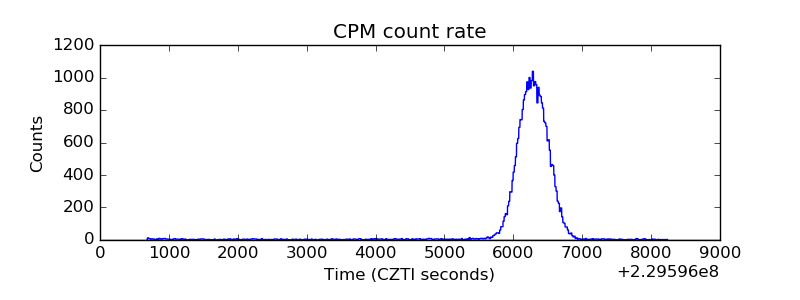 |
| CZT Counter | 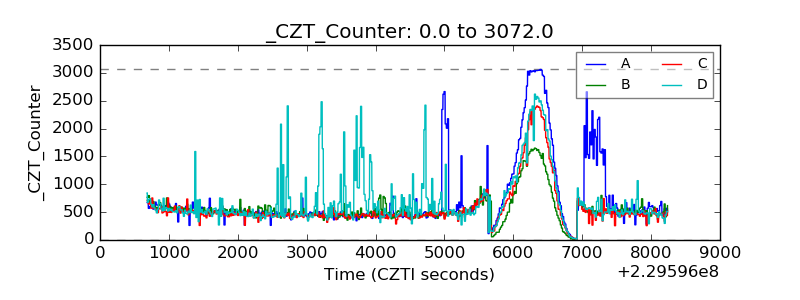 |
| +2.5 Volts monitor | 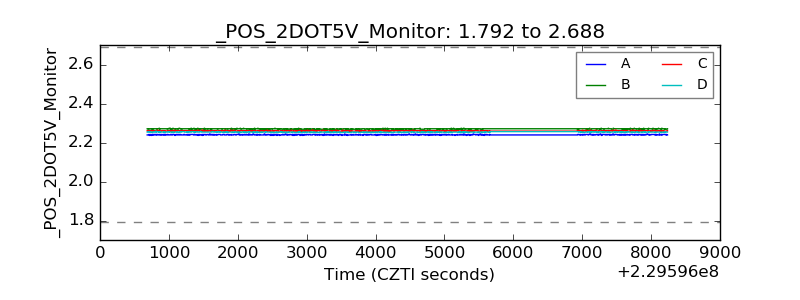 |
| +5 Volts monitor |  |
| _ROLL_ROT | 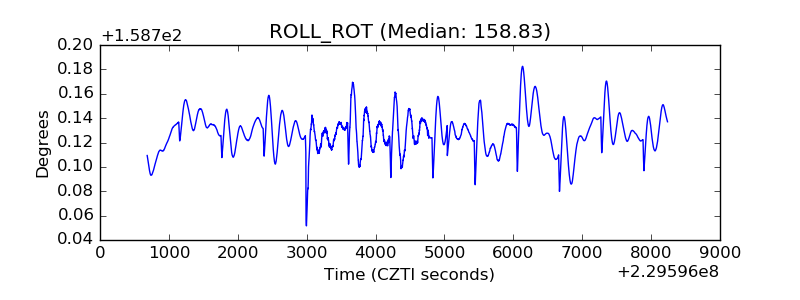 |
| _Roll_DEC | 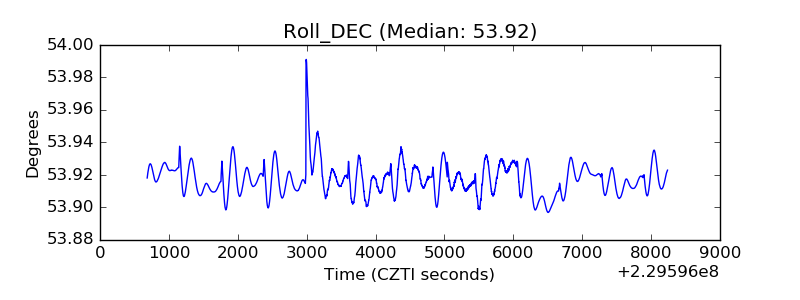 |
| _Roll_RA | 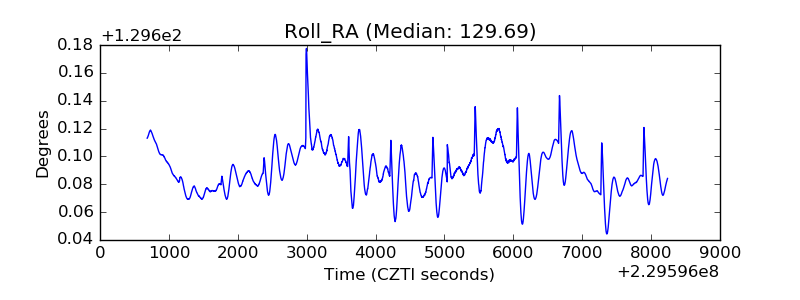 |
| Veto Counter | 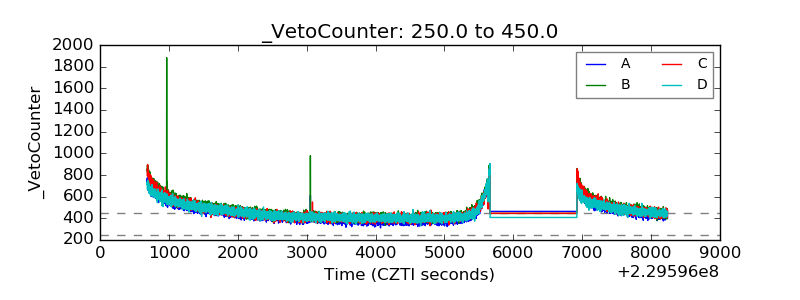 |