| Param | Original file | Final file |
|---|---|---|
| Filename | modeM0/AS1G07_080T03_9000001154_08310cztM0_level2.evt | modeM0/AS1G07_080T03_9000001154_08310cztM0_level2_quad_clean.evt |
| Size (bytes) | 132,338,880 | 39,553,920 |
| Size | 126.2 MB | 37.7 MB |
| Events in quadrant A | 1,013,630 | 266,285 |
| Events in quadrant B | 956,683 | 265,904 |
| Events in quadrant C | 898,412 | 258,314 |
| Events in quadrant D | 990,507 | 251,628 |
| Mode M0 | |||
|---|---|---|---|
| Quadrant | BADHDUFLAG | Total packets | Discarded packets |
| A | 0 | 4489 | 0 |
| B | 0 | 4354 | 0 |
| C | 0 | 4285 | 0 |
| D | 0 | 4437 | 0 |
| Mode SS | |||
|---|---|---|---|
| Quadrant | BADHDUFLAG | Total packets | Discarded packets |
| A | 0 | 44 | 0 |
| B | 0 | 44 | 0 |
| C | 0 | 44 | 0 |
| D | 0 | 44 | 0 |
| Quadrant | Total seconds | Saturated seconds | Saturation percentage |
|---|---|---|---|
| A | 2142 | 3 | 0.140056% |
| B | 2142 | 1 | 0.046685% |
| C | 2142 | 0 | 0.000000% |
| D | 2142 | 0 | 0.000000% |
Noise dominated data is calculated using 1-second bins in cleaned event files. If a bin has >2000 counts, and if more than 50% of those come from <1% of pixels, then it is considered to be noise-dominated and hence unusable.
| Quadrant | # 1 sec bins | Bins with >0 counts | Bins with >2000 counts | High rate bins dominated by noise | Noise dominated (total time) | Noise dominated (detector-on time) | Marked lightcurve |
|---|---|---|---|---|---|---|---|
| A | 2142 | 2142 | 2 | 2 | 0.09% | 0.09% |  |
| B | 2142 | 2142 | 1 | 1 | 0.05% | 0.05% |  |
| C | 2142 | 2142 | 0 | 0 | 0.00% | 0.00% | 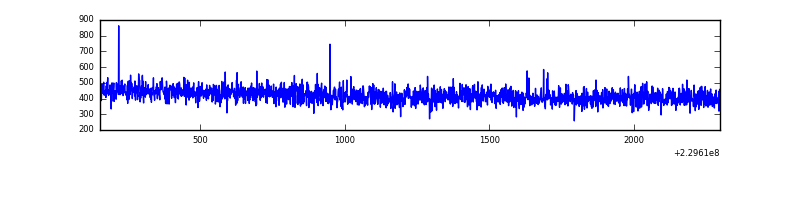 |
| D | 2142 | 2142 | 0 | 0 | 0.00% | 0.00% |  |
Top three noisy pixels from each quadrant. If the there are fewer than three noisy pixels in the level2.evt file, extra rows are filled as -1
| Pixel properties | Quadrant properties | ||||||
|---|---|---|---|---|---|---|---|
| Quadrant | DetID | PixID | Counts | Sigma | Mean | Median | Sigma |
| A | 0 | 23 | 58975 | 1204.68 | 236 | 230 | 48.8 |
| A | 15 | 234 | 30562 | 622.01 | 236 | 230 | 48.8 |
| A | 15 | 239 | 8405 | 167.64 | 236 | 230 | 48.8 |
| B | 0 | 229 | 15057 | 320.78 | 234 | 228 | 46.2 |
| B | 0 | 214 | 14055 | 299.1 | 234 | 228 | 46.2 |
| B | 0 | 187 | 8387 | 176.49 | 234 | 228 | 46.2 |
| C | 9 | 68 | 4717 | 83.11 | 229 | 230 | 54.0 |
| C | 13 | 61 | 1766 | 28.45 | 229 | 230 | 54.0 |
| C | 3 | 202 | 600 | 6.85 | 229 | 230 | 54.0 |
| D | 1 | 7 | 61530 | 1055.89 | 232 | 225 | 58.1 |
| D | 13 | 169 | 17838 | 303.35 | 232 | 225 | 58.1 |
| D | 2 | 234 | 7987 | 133.68 | 232 | 225 | 58.1 |
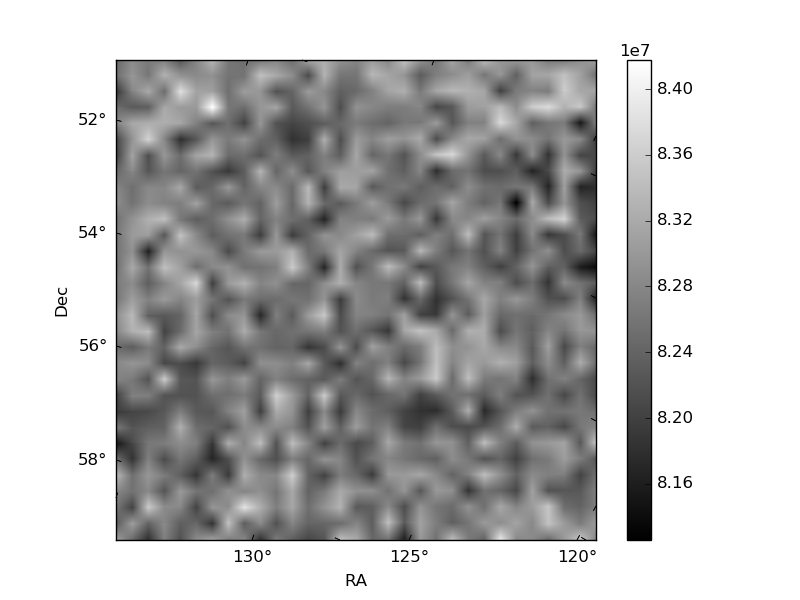
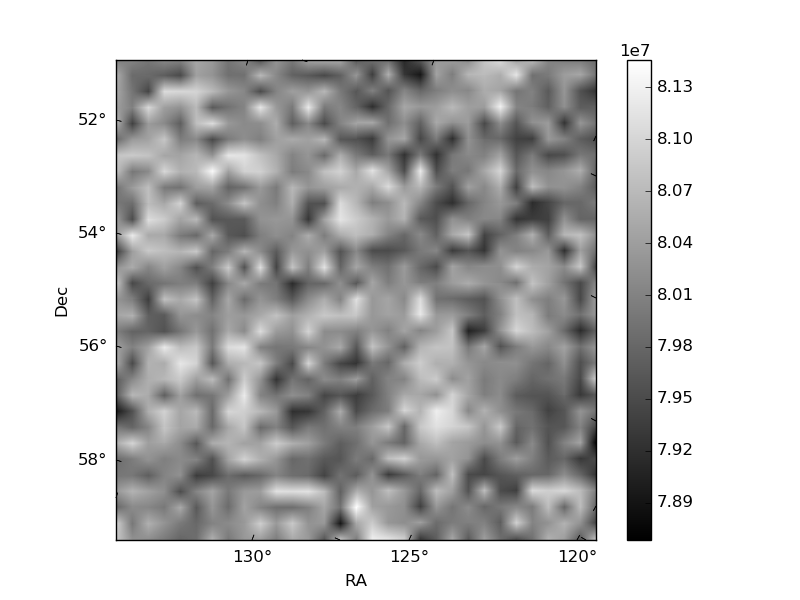
Histogram calculated using DETX and DETY for each event in the final _common_clean file
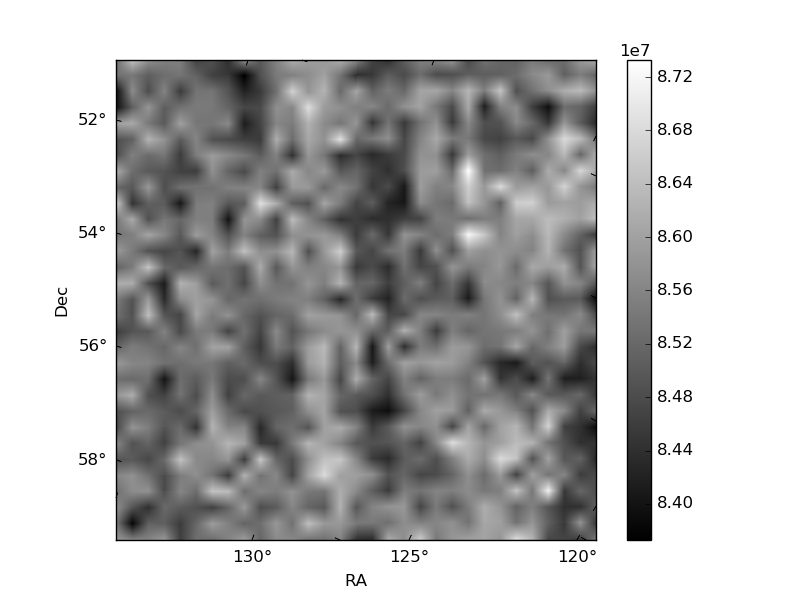
| Quadrant A | 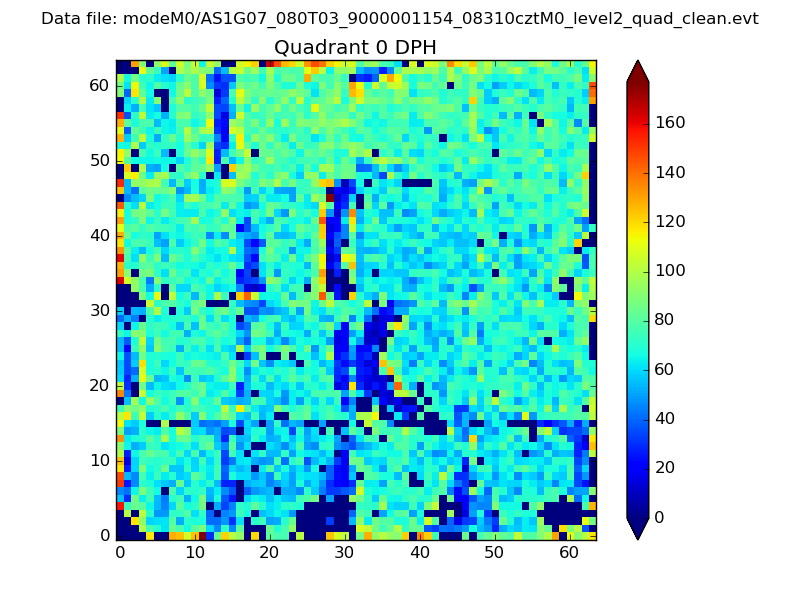 |
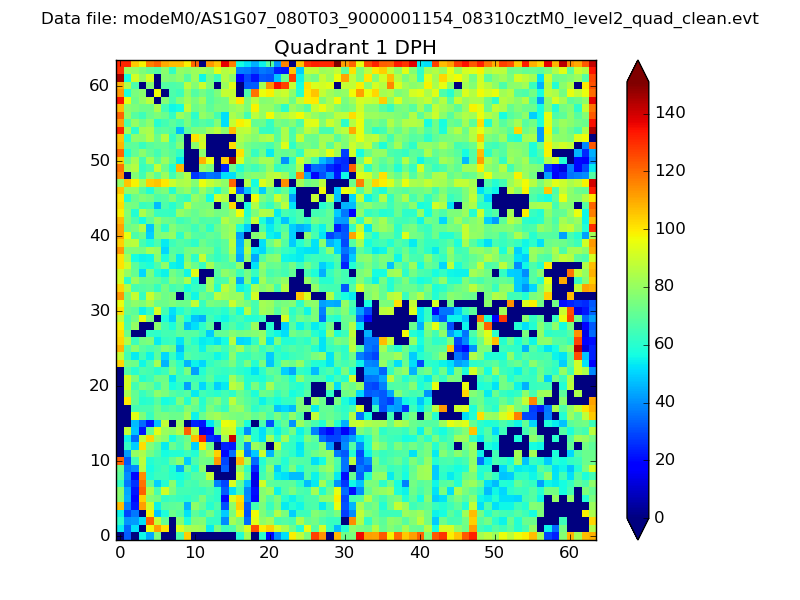 |
Quadrant B |
|---|---|---|---|
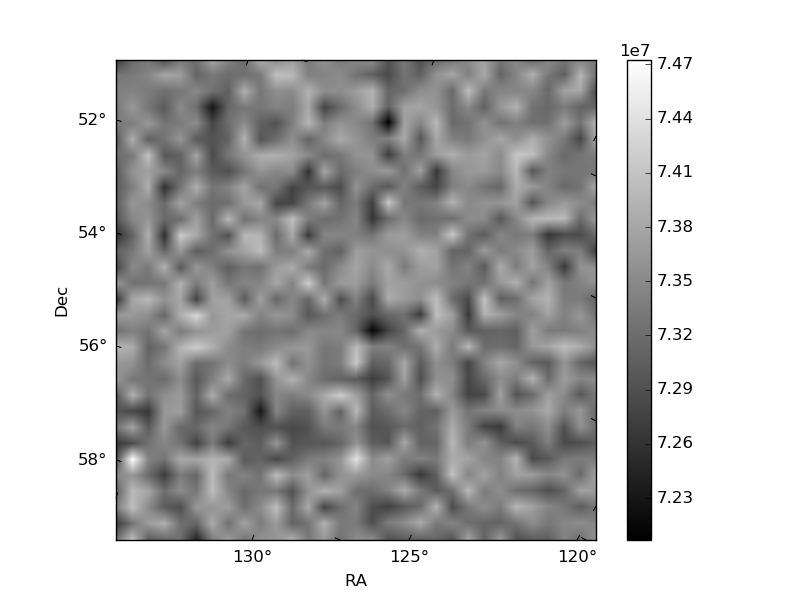
| Quadrant D | 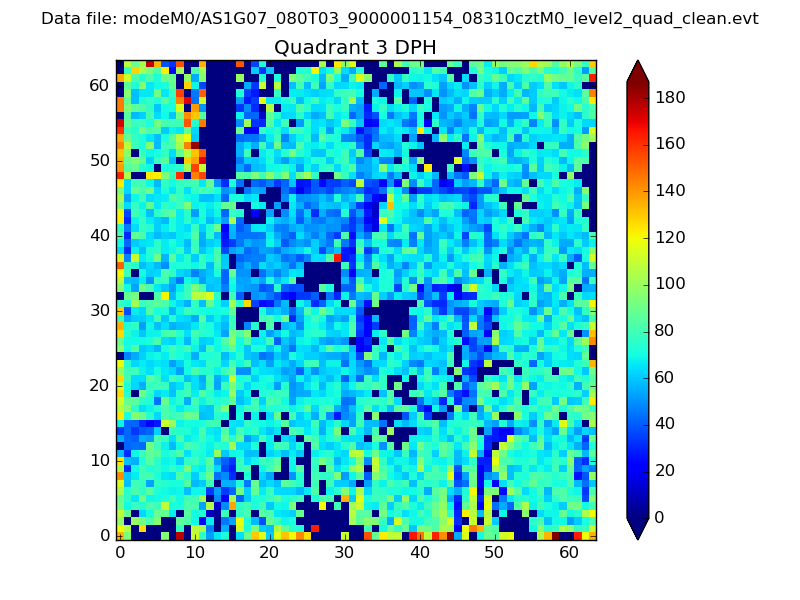 |
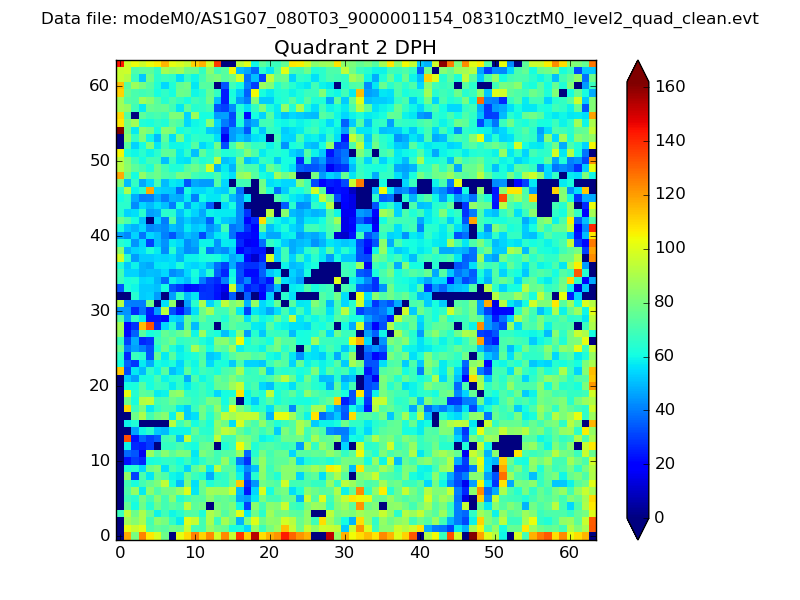 |
Quadrant C |
| Plot type | Count rate plots | Images |
|---|---|---|
| Comparison with Poisson distribution Blue bars denote a histogram of data divided into 1 sec bins. Red curve is a Poisson curve with rate = median count rate of data. |
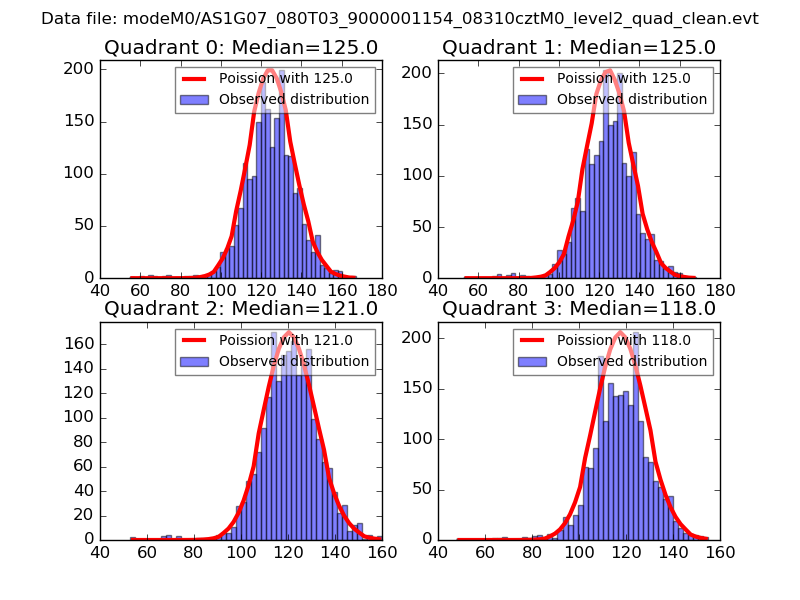 |
 |
| Quadrant-wise count rates Data is divided into 100 sec bins |
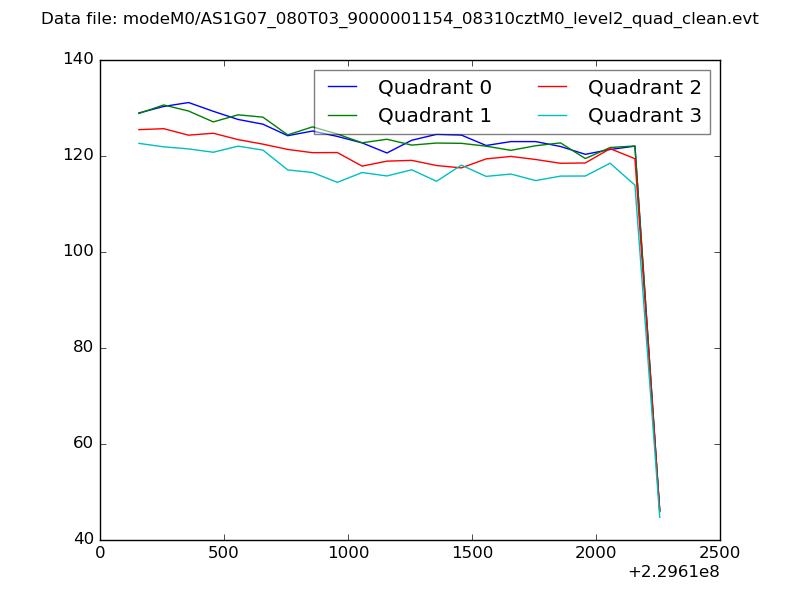 |
|
| Module-wise count rates for Quadrant A Data is divided into 100 sec bins |
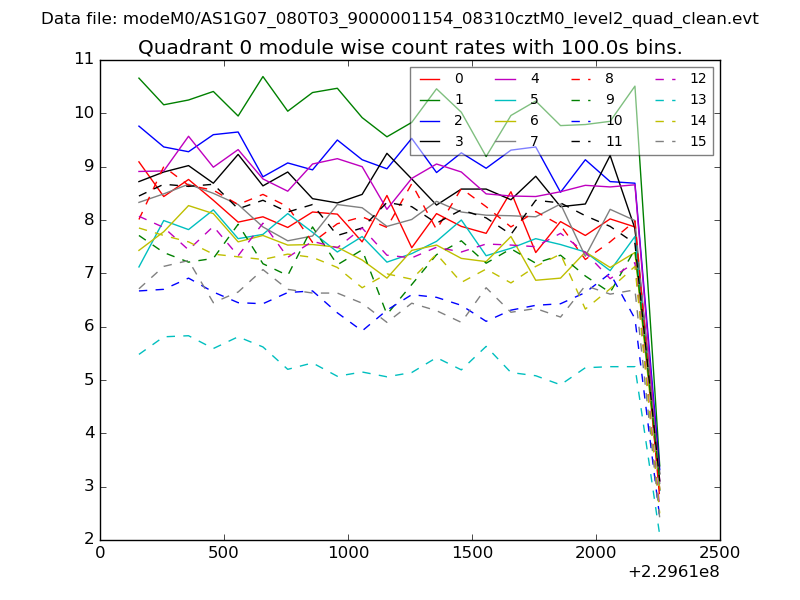 |
 |
| Module-wise count rates for Quadrant B Data is divided into 100 sec bins |
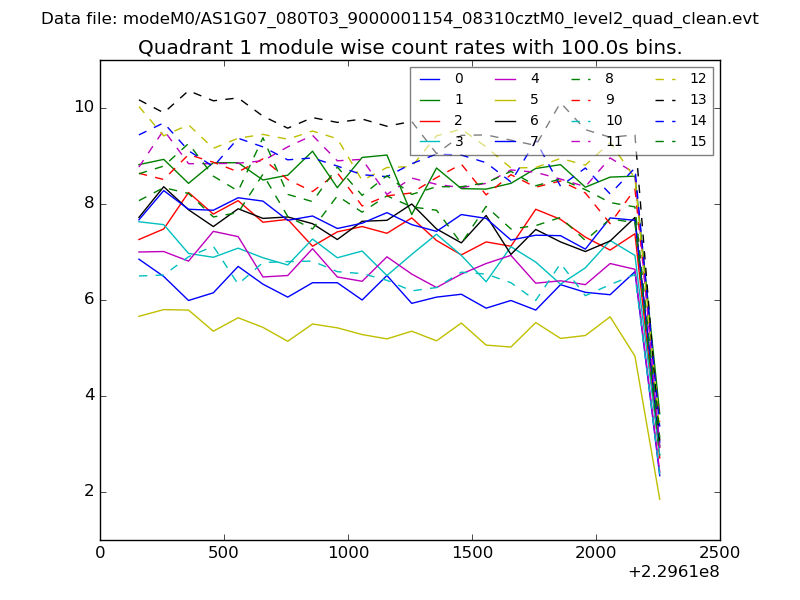 |
 |
| Module-wise count rates for Quadrant C Data is divided into 100 sec bins |
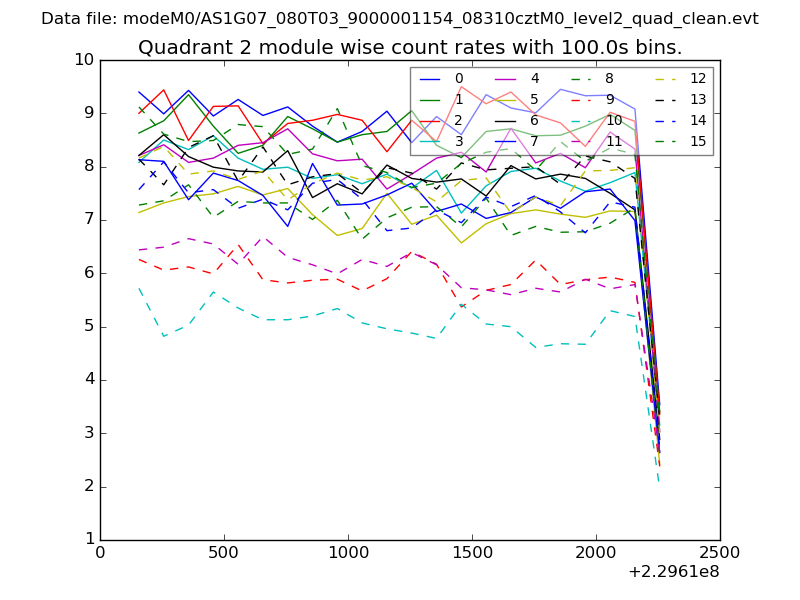 |
 |
| Module-wise count rates for Quadrant D Data is divided into 100 sec bins |
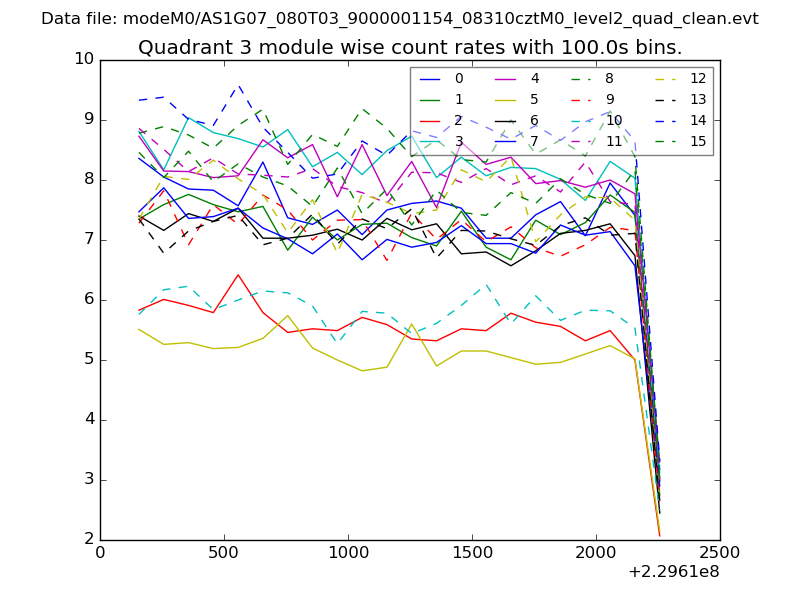 |
 |
| Parameter | Plot |
|---|---|
| CZT HV Monitor | 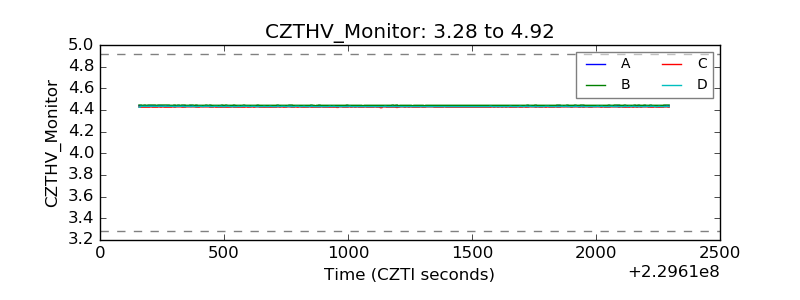 |
| D_VDD | 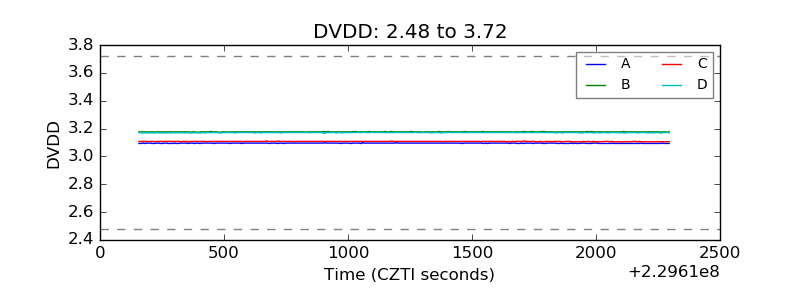 |
| Temperature 1 | 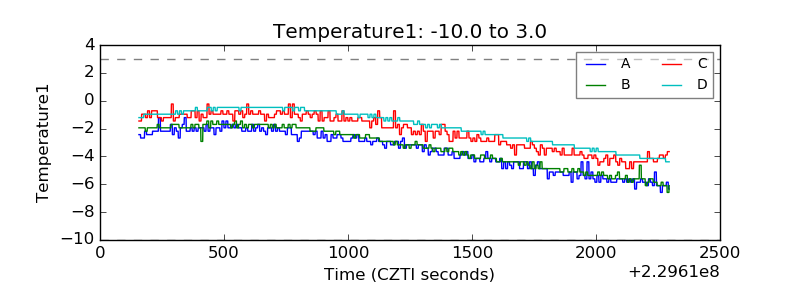 |
| Veto HV Monitor | 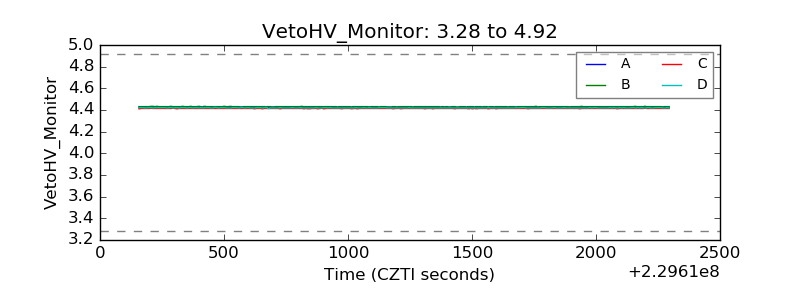 |
| Veto LLD | 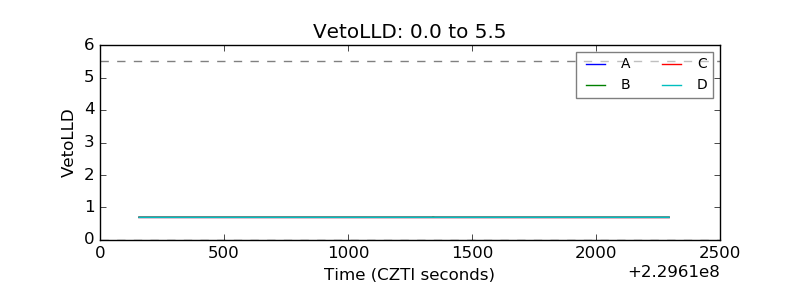 |
| Alpha Counter | 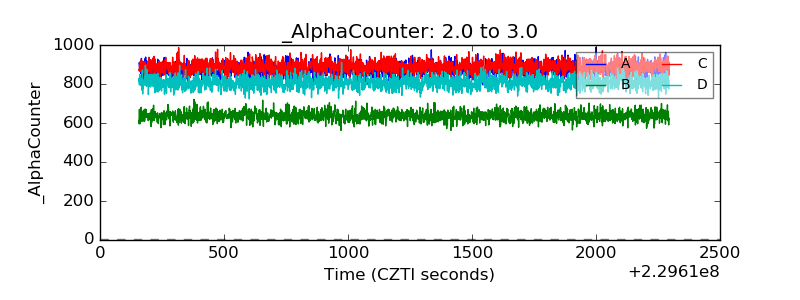 |
| _CPM_Rate | 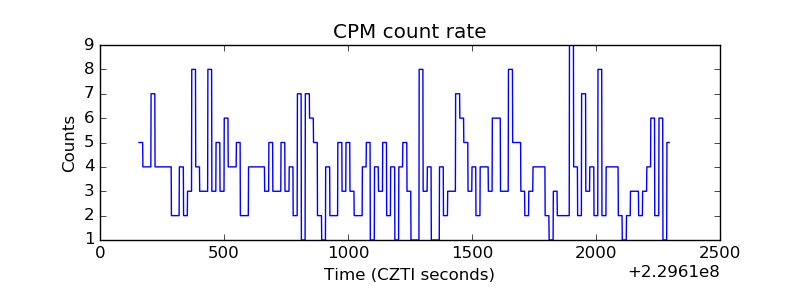 |
| CZT Counter | 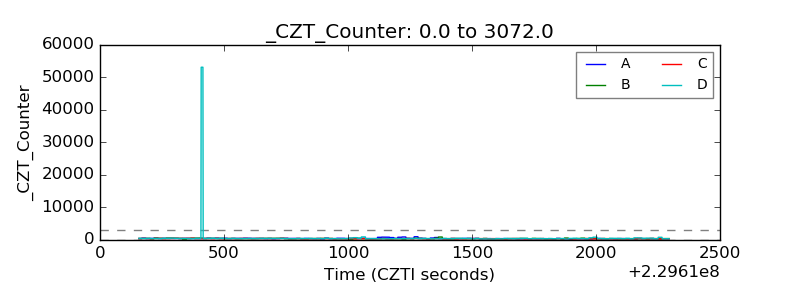 |
| +2.5 Volts monitor |  |
| +5 Volts monitor |  |
| _ROLL_ROT | 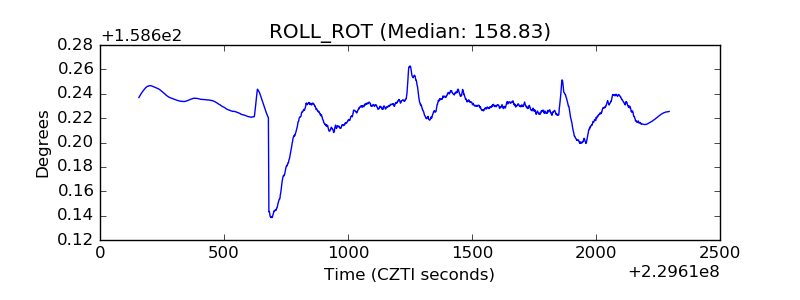 |
| _Roll_DEC | 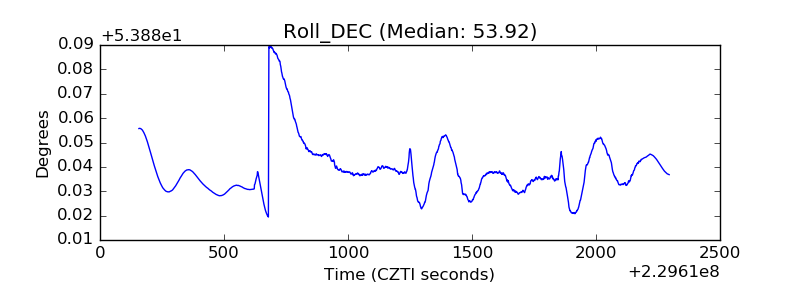 |
| _Roll_RA | 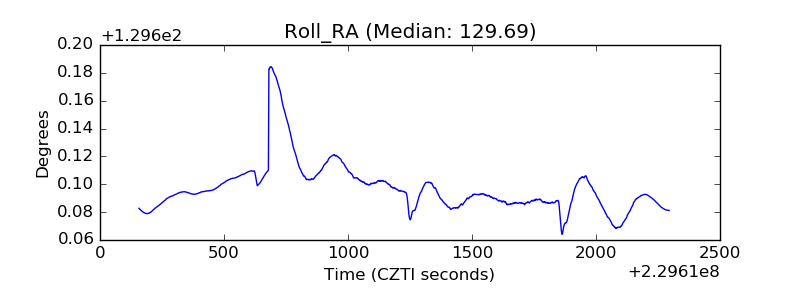 |
| Veto Counter | 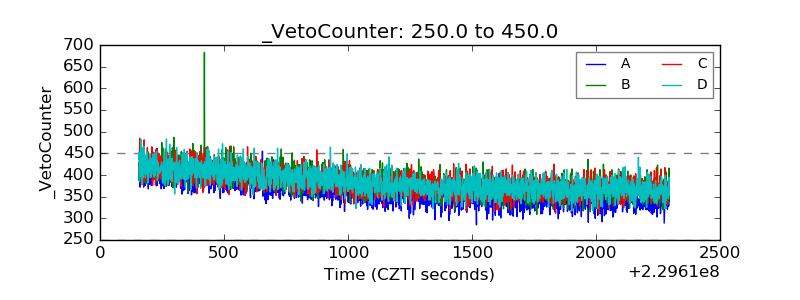 |