| Param | Original file | Final file |
|---|---|---|
| Filename | modeM0/AS1G07_029T01_9000001158cztM0_level2.fits | modeM0/AS1G07_029T01_9000001158cztM0_level2_quad_clean.evt |
| Size (bytes) | 1,198,036,800 | 1,122,523,200 |
| Size | 1.1 GB | 1.0 GB |
| Events in quadrant A | 7,173,612 | 6,507,322 |
| Events in quadrant B | 7,022,056 | 6,654,117 |
| Events in quadrant C | 7,150,074 | 6,297,254 |
| Events in quadrant D | 6,214,582 | 5,817,906 |
| Mode SS | |||
|---|---|---|---|
| Quadrant | BADHDUFLAG | Total packets | Discarded packets |
| A | 0 | 2588 | 0 |
| B | 0 | 2588 | 0 |
| C | 0 | 2588 | 0 |
| D | 0 | 2586 | 0 |
| Mode M0 | |||
|---|---|---|---|
| Quadrant | BADHDUFLAG | Total packets | Discarded packets |
| A | 0 | 291220 | 0 |
| B | 0 | 274316 | 0 |
| C | 0 | 268096 | 0 |
| D | 0 | 280518 | 0 |
| Mode M9 | |||
|---|---|---|---|
| Quadrant | BADHDUFLAG | Total packets | Discarded packets |
| A | 0 | 178 | 0 |
| B | 0 | 178 | 0 |
| C | 0 | 178 | 0 |
| D | 0 | 178 | 0 |
| Quadrant | Total seconds | Saturated seconds | Saturation percentage |
|---|---|---|---|
| A | 127259 | 5751 | 4.519130% |
| B | 127260 | 2858 | 2.245796% |
| C | 127262 | 1542 | 1.211674% |
| D | 127259 | 1507 | 1.184199% |
Noise dominated data is calculated using 1-second bins in cleaned event files. If a bin has >2000 counts, and if more than 50% of those come from <1% of pixels, then it is considered to be noise-dominated and hence unusable.
| Quadrant | # 1 sec bins | Bins with >0 counts | Bins with >2000 counts | High rate bins dominated by noise | Noise dominated (total time) | Noise dominated (detector-on time) | Marked lightcurve |
|---|---|---|---|---|---|---|---|
| A | 144966 | 127257 | 0 | 0 | 0.00% | 0.00% | 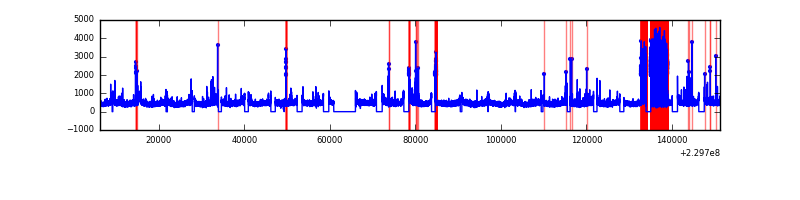 |
| B | 144966 | 127263 | 0 | 0 | 0.00% | 0.00% |  |
| C | 144966 | 127254 | 0 | 0 | 0.00% | 0.00% | 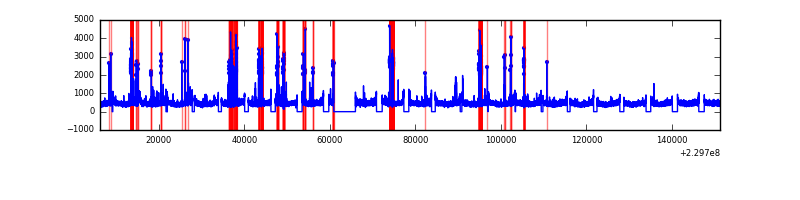 |
| D | 144966 | 127255 | 0 | 0 | 0.00% | 0.00% |  |
Top three noisy pixels from each quadrant. If the there are fewer than three noisy pixels in the level2.evt file, extra rows are filled as -1
| Pixel properties | Quadrant properties | ||||||
|---|---|---|---|---|---|---|---|
| Quadrant | DetID | PixID | Counts | Sigma | Mean | Median | Sigma |
| A | 0 | 29 | 6725 | 10.68 | 1866 | 1734 | 467.3 |
| A | 7 | 110 | 5913 | 8.94 | 1866 | 1734 | 467.3 |
| A | 0 | 30 | 5235 | 7.49 | 1866 | 1734 | 467.3 |
| B | 2 | 9 | 6036 | 11.48 | 1849 | 1751 | 373.3 |
| B | 14 | 254 | 4792 | 8.15 | 1849 | 1751 | 373.3 |
| B | 3 | 17 | 4757 | 8.05 | 1849 | 1751 | 373.3 |
| C | 1 | 81 | 5209 | 6.91 | 1887 | 1743 | 501.4 |
| C | 1 | 80 | 5143 | 6.78 | 1887 | 1743 | 501.4 |
| C | 12 | 241 | 4954 | 6.4 | 1887 | 1743 | 501.4 |
| D | 3 | 14 | 4583 | 6.32 | 1771 | 1606 | 471.2 |
| D | 6 | 231 | 4532 | 6.21 | 1771 | 1606 | 471.2 |
| D | 7 | 5 | 4373 | 5.87 | 1771 | 1606 | 471.2 |
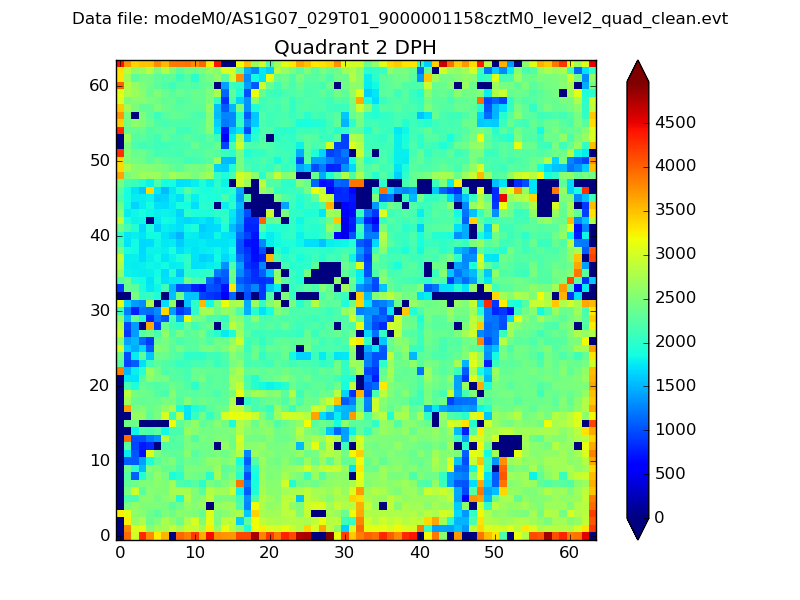
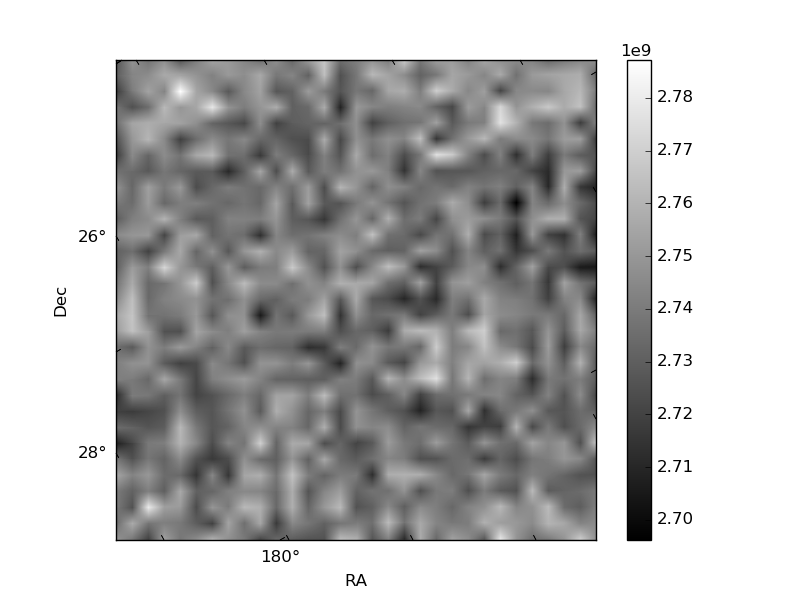
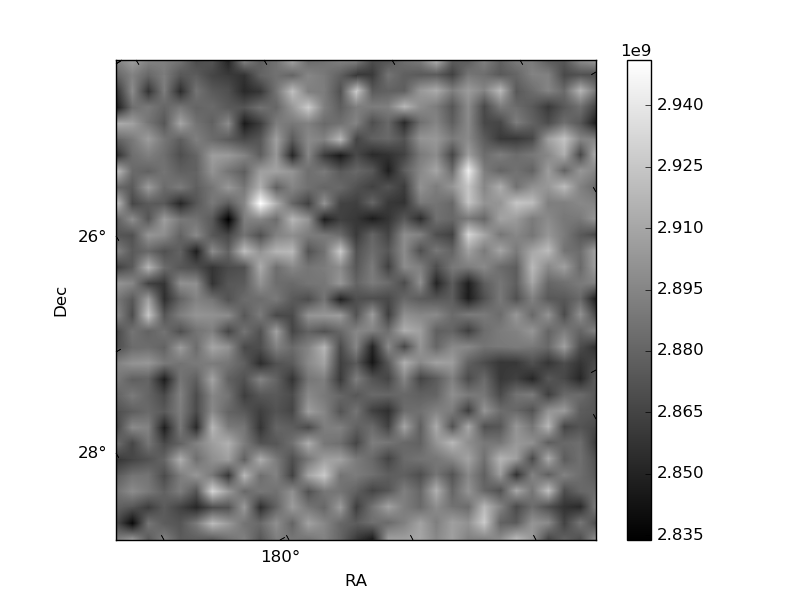
Histogram calculated using DETX and DETY for each event in the final _common_clean file
| Quadrant A | 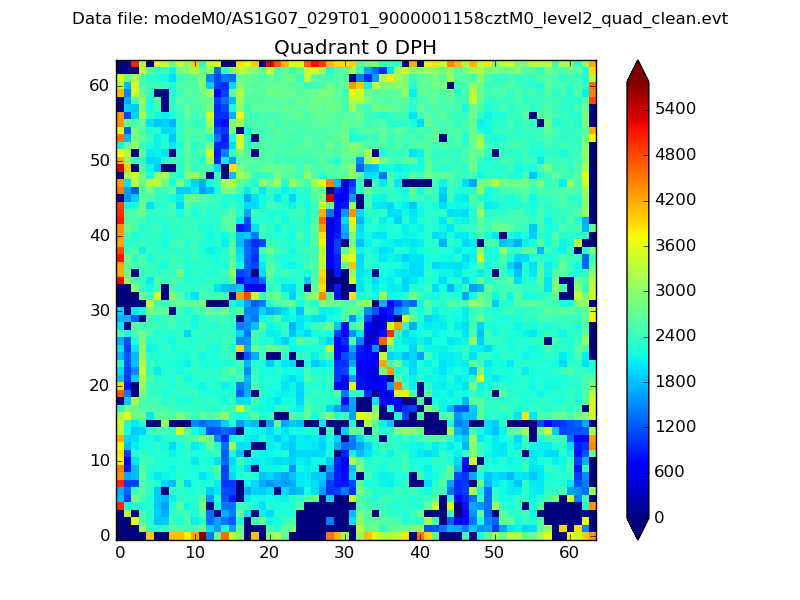 |
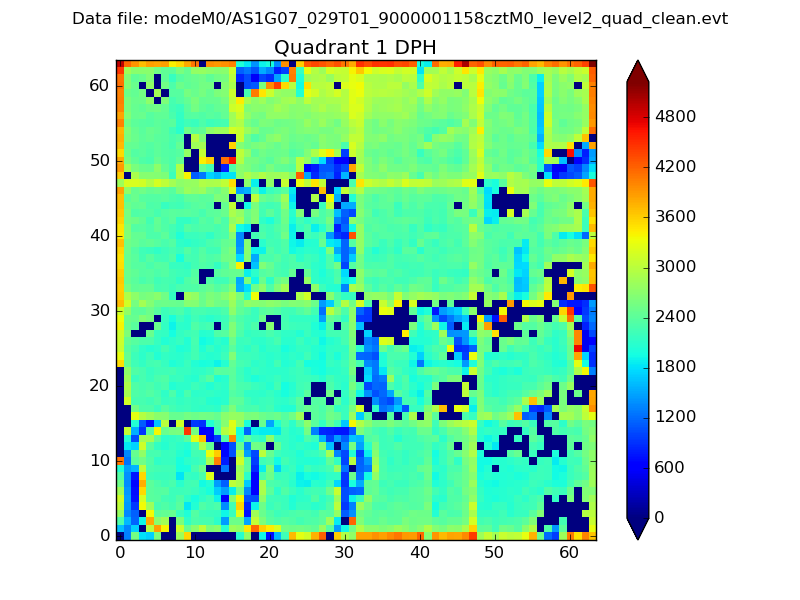 |
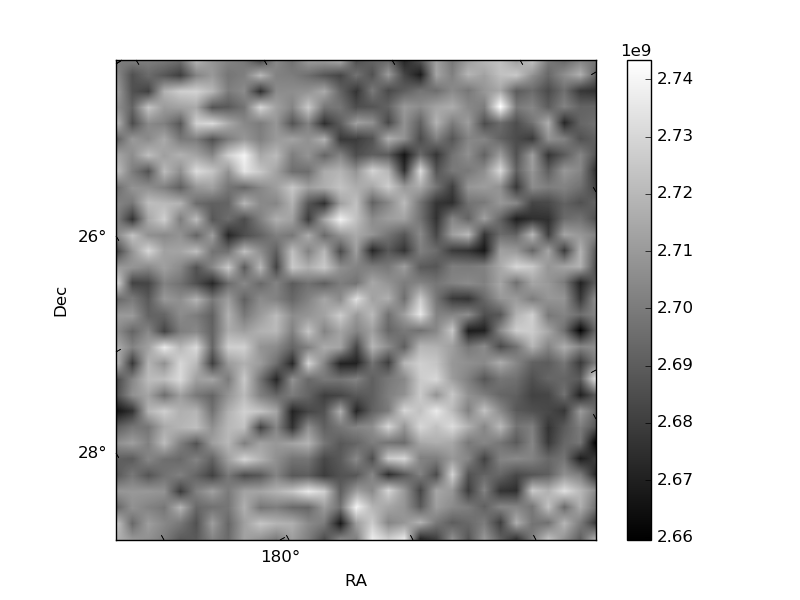
Quadrant B |
|---|---|---|---|
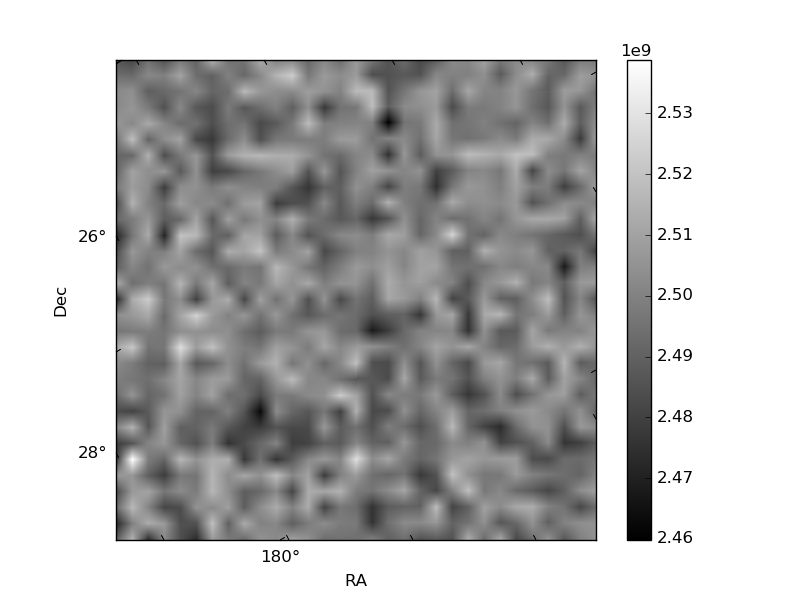
| Quadrant D | 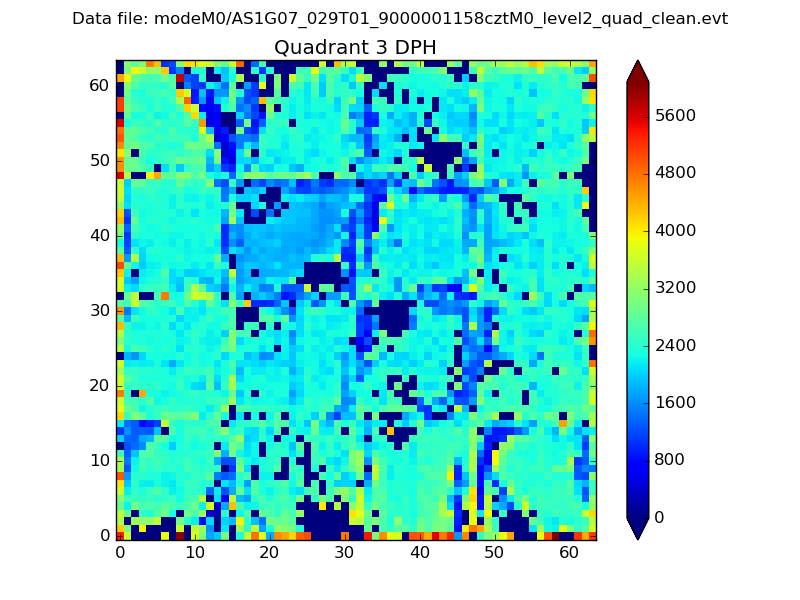 |
 |
Quadrant C |
| Plot type | Count rate plots | Images |
|---|---|---|
| Comparison with Poisson distribution Blue bars denote a histogram of data divided into 1 sec bins. Red curve is a Poisson curve with rate = median count rate of data. |
 |
 |
| Quadrant-wise count rates Data is divided into 100 sec bins |
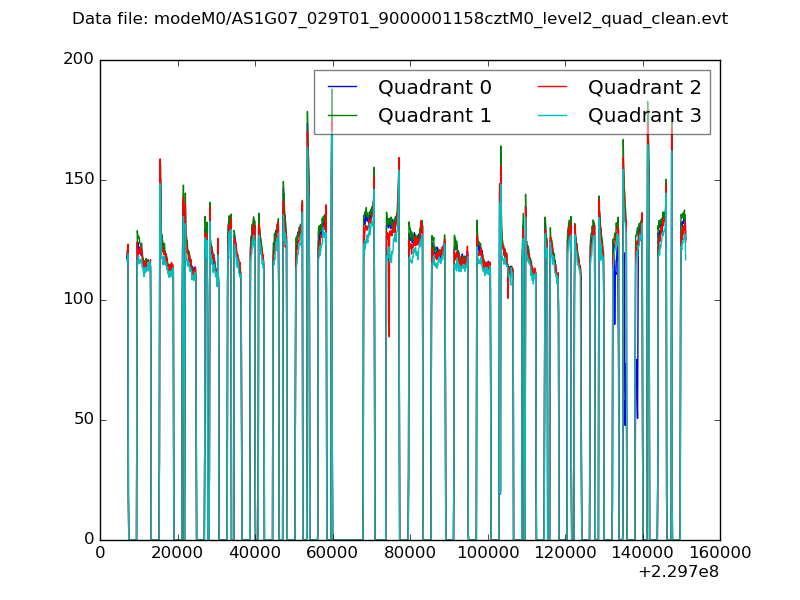 |
|
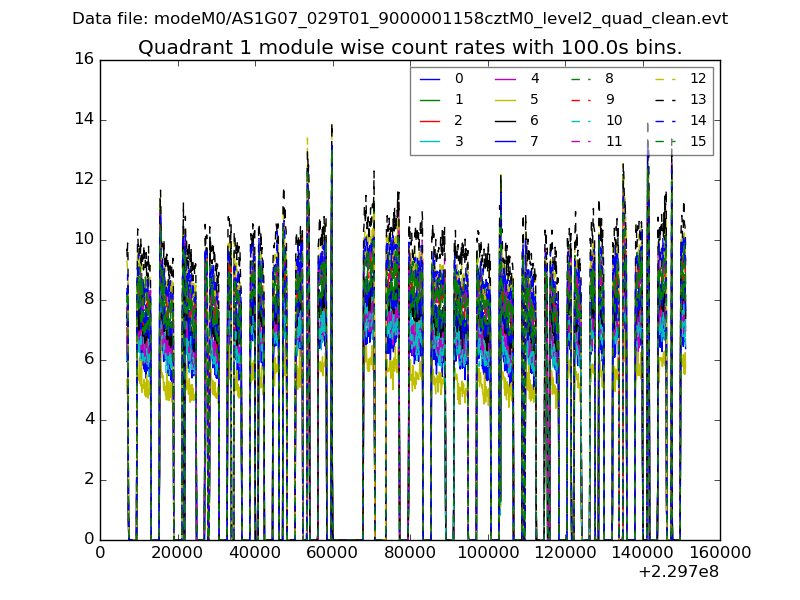
| Module-wise count rates for Quadrant A Data is divided into 100 sec bins |
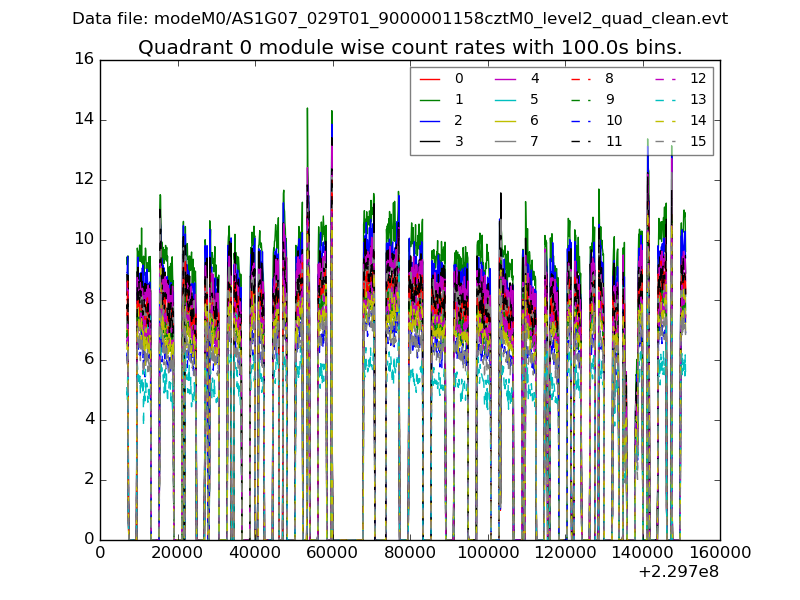 |
 |
| Module-wise count rates for Quadrant B Data is divided into 100 sec bins |
 |
 |
| Module-wise count rates for Quadrant C Data is divided into 100 sec bins |
 |
 |
| Module-wise count rates for Quadrant D Data is divided into 100 sec bins |
 |
 |
| Parameter | Plot |
|---|---|
| CZT HV Monitor |  |
| D_VDD | 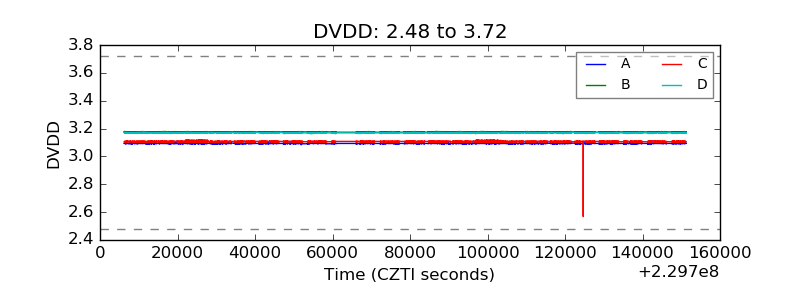 |
| Temperature 1 |  |
| Veto HV Monitor |  |
| Veto LLD | 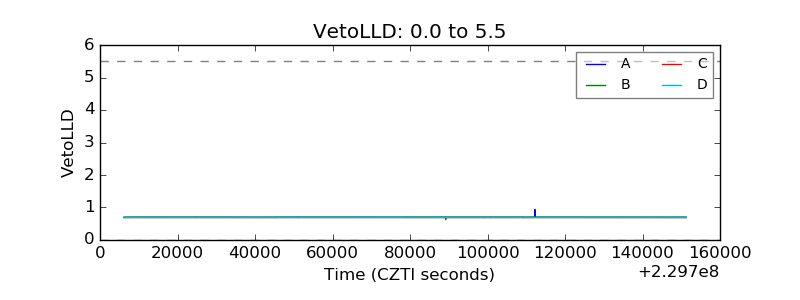 |
| Alpha Counter |  |
| _CPM_Rate | 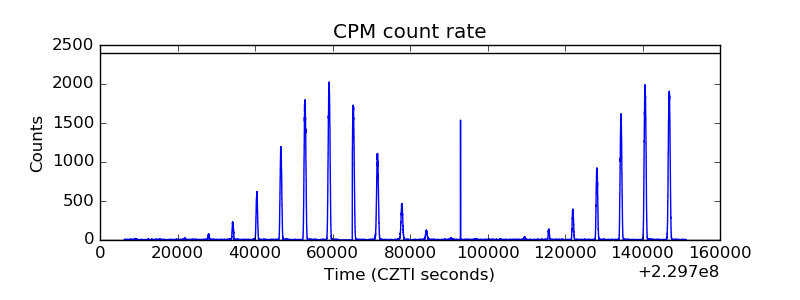 |
| CZT Counter | 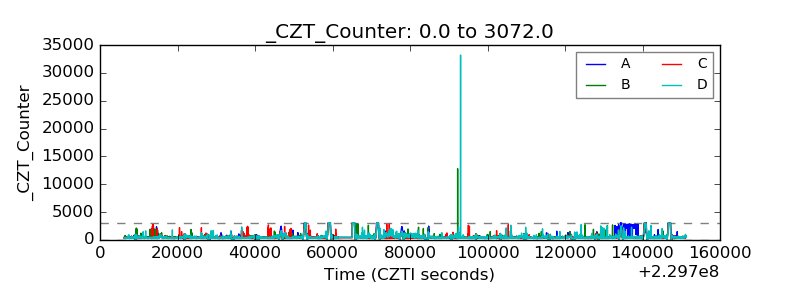 |
| +2.5 Volts monitor | 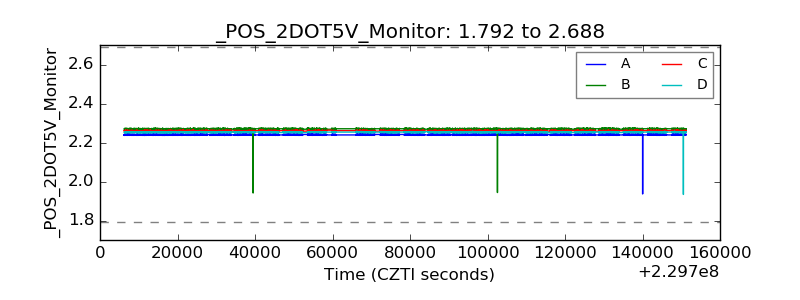 |
| +5 Volts monitor | 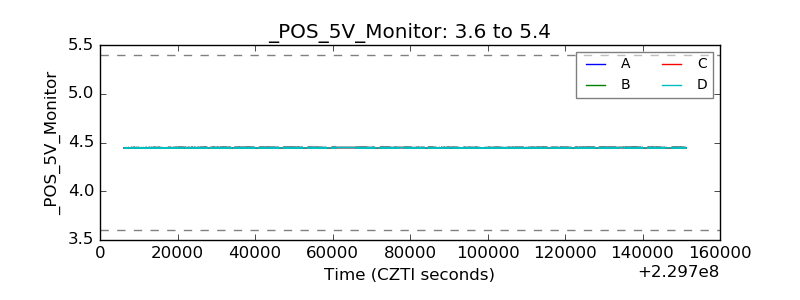 |
| _ROLL_ROT | 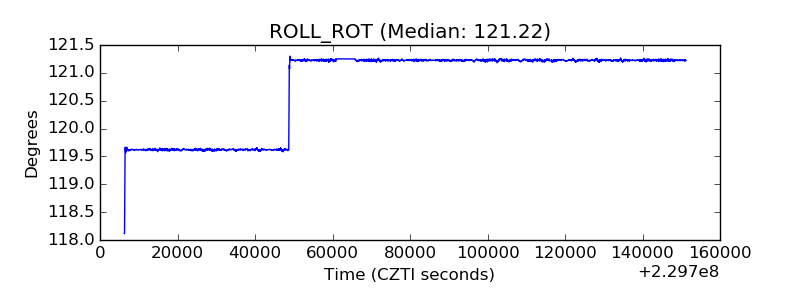 |
| _Roll_DEC |  |
| _Roll_RA |  |
| Veto Counter |  |